RGB Image Compression by Low Complexity
Multi-Level Block Truncation Code Algorithm
Dev Prakash Singh1, Dr. Vineeta Saxena Nigam2
M. Tech. Scholar, Department of Electronics and Communication, UIT, RGPV, Bhopal, India1
Professor, Department of Electronics and Communication, UIT, RGPV, Bhopal, India 2
ABSTRACT: This paper aims to proposed multi-level block truncation code (BTC) based image compression of continuous tone still image to achieve low bit rate and high quality. The algorithm has been proposed by combining bit map and quantization. The algorithms are proposed based on the assumption that the computing power is not the limiting factor. The parameters considered for evaluating the performance of the proposed methods are compression ratio and subjective quality of the reconstructed images. The performance of proposed algorithm including color image compression, progressive image transmission is quite good. The effectiveness of the proposed schemes is established by comparing the performance with that of the existing methods.
KEYWORDS: Block Truncation Code (BTC), Bit Map, Multi-level, Quantization
I. INTRODUCTION
transform decomposes a signal into its various frequency components. In the case of natural images, one obtains many small or zero-valued coefficients corresponding to the high-frequency components of the image. Due to the large number of small coefficients, the transformed signal is often easier to code than the original signal itself [6]. JPEG 2000 standard is based on transform coding employing DWT. It achieves high compression ratio and improved subjective quality especially at low bit rates than the previous DCT-based JPEG [7].
II. ELEMENTS OF LOSSY IMAGE COMPRESSION SYSTEM
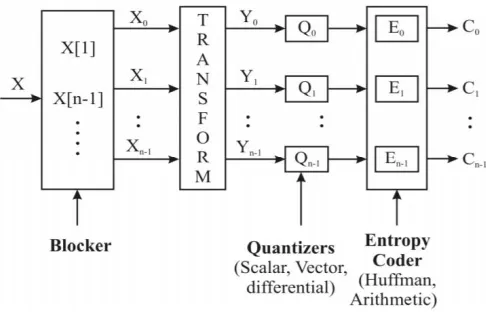
In transform based image compression, the image is subjected to transformation and then the transformed data are encoded to produce the compressed bit stream. The general structure of a transform-based image compression system is shown in Figure 1. There are two versions of transform coding. One is frame based and the other is the block based. The block based approach requires fewer computations and allows adaptive quantization of coefficients.
In Figure 1, X represents the original image pixel values; Yi denotes the transformed values of the original image. All the transformed coefficients are then quantized and entropy coded which are represented by Ci. These compressed bit streams are either transmitted or stored. Reconstructed image can be obtained by decompressing the coded signal. The goal is to design a system so that the coded signal Ci can be represented with fewer bits than the original image X [8]. In the 1980’s, almost all transform based compression approaches were using the DCT. Later, the trend moved to compression schemes based on the DWT. DWT overcomes the effect of blocking artifacts associated with DCT. Perhaps the most significant improvement in conventional coding is achieved by the use of arithmetic coders instead of simple Huffman coders, which increases the compression ratio by 5-8%. However, the multimedia content in daily life is growing exponentially; therefore, a performance gain of about 10% in ten years does not satisfy the demand. Therefore, researchers have been looking for new solutions that could solve the problem of the stagnating image compression performance.
Figure 1: Transform-based image compression system
III. IMAGE QUALITY MEASURES
It is a major task in evaluating the image quality of an image compression system to describe the amount of degradation in the reconstructed image. In the case of lossy compression, the reconstructed image is only an approximation to the original. The difference between the original and reconstructed signal is referred to as approximation error or distortion. Generally, the performance is evaluated in terms of compression ratio and image fidelity [10]. A good image compression algorithm results in a high compression ratio and high fidelity. Unfortunately, both requirements cannot be achieved simultaneously. Although many metrics exist for quantifying distortion, it is most commonly expressed in terms of means squared error (MSE) or peak-signal-to-noise ratio (PSNR). The performance of image compression systems is measured by the metric defined in equations (1) and (2). It is based on the assumption that the digital image is represented as
N
1
N
2 matrix, whereN
1andN
2 denote the number of rows and columns of the image respectively. Also,f
(
i
,
j
)
andg
(
i
,
j
)
denote pixel values of the original image before compression and degraded image after compression respectively.Mean Square Error (MSE)
2 1 1 1 2 2 1))
,
(
)
,
(
(
1
N j N ij
i
g
j
i
f
N
N
(1)Peak Signal to Noise Ratio (PSNR) in dB
10
log
(
255
)
2 10
MSE
(2)Evidently, smaller MSE and larger PSNR values correspond to lower levels of distortion. Although these metrics are frequently employed, it can be observed that the MSE and PSNR metrics do not always correlate well with image quality as perceived by the human visual system. For this reason, it is preferable to supplement any objective lossy compression performance measurement by subjective tests such as the Mean Opinion Score (MOS) to ensure that the objective results are not misleading [11].
Sometimes compression is quantified by stating the Bit Rate (BR) achieved by compression algorithm expressed in bpp (bits per pixel). Another parameter that measures the amount of compression is the Compression Ratio (CR) which is defined as
size
image
Compressed
size
image
Original
CR
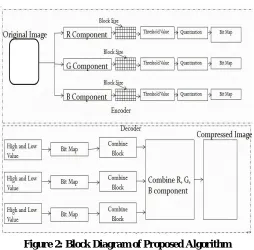
(3)IV. PROPOSED METHODOLOGY
Figure 2: Block Diagram of Proposed Algorithm
Threshold value means the average of the maximum value (max) of ‘k × k’ pixels block, minimum value (min) of ‘k × k’ pixels block and
m
1 is the mean value of ‘k × k’ pixels block. Where k represents block size of the color image. Sothreshold value is:
(4)
Each threshold value is passing through the quantization block. Quantization is the process of mapping a set of input fractional values to a whole number. Suppose the fractional value is less than 0.5, then the quantization is replaced by previous whole number and if the fractional value is greater than 0.5, then the quantization is replaced by next whole number. Each quantization value is passing through the bit map block. Bit map means each block is represented by ‘0’ and ‘1’ bit map. If the Threshold value is less than or equal to the input image value then the pixel value of the image is represent by ‘0’ and if the threshold value is greater than the input image value then the pixel value of the image is represented by ‘1’.
Bit map is directly connected to the high and low component of the proposed decoder multi-level BTC algorithm. High (H) and low (L) component is directly connected to the bit map, bitmap converted the ‘1’ and ‘0’ pixel value to high and low pixel value and arrange the entire block.
(5)
(6)
Wi represent the input color image block, q is the number of zeros in the bit plane, p is the number of ones in the bit
plane. In the combine block of decoder, the values obtained from the pattern fitting block of individual R, G,B
3
min
max
m
1T
V. SIMULATIONRESULT
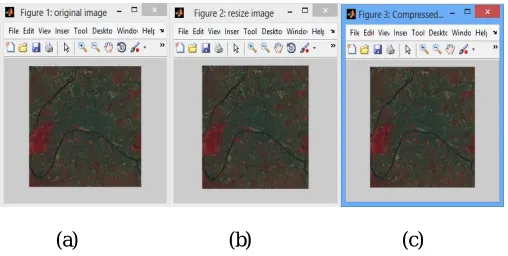
Figure 3; shows the Satellite image of 2×2 block pixel. In this figure 3 (a) show the random image of the Satellite image and resize the image of the 512×512 in the Satellite image shown in figure 3 (b). The compressed image is 2×2 block pixel of Satellite image shown in figure 3 (c) respectively.
Figure 3: Multi-level BTC Algorithm applied on Satellite Image of block size 2×2
Figure 4; shows the Satellite image of 4×4 block pixel. In this figure 4 (a) show the random image of the Satellite image and resize the image of the 512×512 in the Satellite image shown in figure 4 (b). The compressed image is 4×4 block pixel of Satellite image shown in figure 4 (c) respectively.
Figure 4: Multi-level BTC Algorithm applied on Satellite Image of block size 4×4
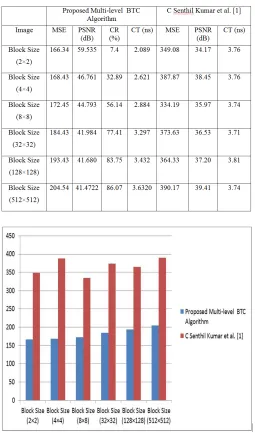
As shown in table 1 the peak signal to noise ratio (PSNR) and computation time are obtained from the proposed multi-level block truncation code algorithm. The values obtained for various block sizes is the average value of red, blue and green component of the image.
(a) (b) (c)
Table 1: Experimental Results MSE, PSNR, CT and CR for Satellite Image
Figure 5: MSE for Different Block Size using Satellite Image
Figure 6: MSE for Different Block Size using Satellite Image
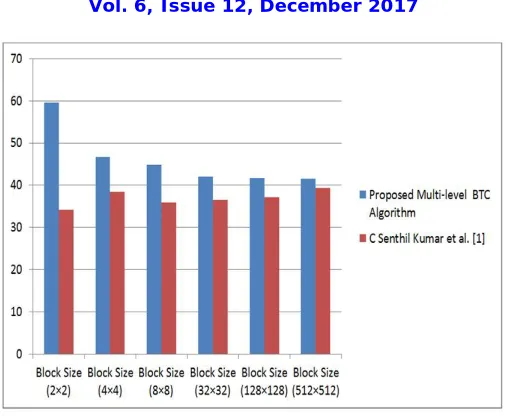
Figure 6 shows the graphical illustration of the performance of different block size discussed in this research work in term of PSNR. From the above graphical representation it can be inferred that the proposed multi-level block truncation code algorithm gives the best performance for 2×2 Block Pixel.
Figure 7: Computation Time for Different Block Size using Satellite Image
VI. CONCLUSION
In the proposed method compression ratio for block size (2×2) is 7.4%, block size (4×4) is 32.89%, block size (8×8) is 56.14%, block size (16×16) is 69.95%, block size (32×32) is 77.41%, block size (128×128) is 83.75% and block size (512×512) is 86.07% for satellite image. It is clear that by increasing block size, compression ratio also increases and image quality degrades for satellite image.
REFRENCES
[1] C. Senthil kumar, “Color and Multispectral Image Compression using Enhanced Block Truncation Coding [E-BTC] Scheme”, accepted to be
presented at the IEEE WiSPNET, PP. 01-06, 2016 IEEE.
[2] Jing-Ming Guo, Senior Member, IEEE, and Yun-Fu Liu, Member, IEEE, “Improved Block Truncation Coding Using Optimized Dot Diffusion”, IEEE TRANSACTIONS ON IMAGE PROCESSING, VOL. 23, NO. 3, MARCH 2014.
[3] Jayamol Mathews, Madhu S. Nair, “Modified BTC Algorithm for Gray Scale Images using max-min Quantizer”, 978-1-4673-5090-7/13/$31.00 ©2013 IEEE.
[4] Ki-Won Oh and Kang-Sun Choi, “Parallel Implementation of Hybrid Vector Quantizerbased Block Truncation Coding for Mobile Display Stream Compression”, IEEE ISCE 2014 1569954165.
[5] Seddeq E. Ghrare and Ahmed R. Khobaiz, “Digital Image Compression using Block Truncation
Coding and Walsh Hadamard Transform Hybrid Technique”, 2014 IEEE 2014 International Conference on Computer, Communication, and Control Technology (I4CT 2014), September 2 - 4, 2014 - Langkawi, Kedah, Malaysia.
[6] M. Brunig and W. Niehsen. Fast full search block matching. IEEE Transactions on Circuits and Systems for Video Technology, 11:241 – 247, 2001.
[7] K. W. Chan and K. L. Chan. Optimisation of multi-level block truncation coding. Signal Processing: Image Communication, 16:445 – 459, 2001.
[8] C. C. Chang and T. S. Chen. New tree-structured vector quantization with closed-coupled multipath searching method. Optical Engineering, 36:1713 – 1720, 1997.
[9] C. C. Chang, H. C. Hsia, and T. S. Chen. A progressive image transmission scheme based on block truncation coding. In LNCS Vol 2105, pages 383–397, 2001.
[10] William H.Equitz, 1989: “ A New Vector Quantization Clustering Algorithm” IEEE Transactions on Acoustics, Speech and Signal Processing, Vol. 37, No. 10, pp. 1568-1575.
[11] Wu X. and Zhang K., 1991: “ A Better Tree-Structured Vector Quantizer”, in IEEE Proceedings of Data Compression Conference, Snowbird, UT, pp. 392-4