R E S E A R C H A R T I C L E
Open Access
Characterization and quantification of
angiogenesis in rheumatoid arthritis in a mouse
model using
μ
CT
Svitlana Gayetskyy
1, Oleg Museyko
1, Johannes Käßer
2, Andreas Hess
2, Georg Schett
3and Klaus Engelke
1*Abstract
Background:Angiogenesis is an important pathophysiological process of chronic inflammation, especially in inflammatory arthritis. Quantitative measurement of changes in vascularization may improve the diagnosis and monitoring of arthritis. The aim of this work is the development of a 3D imaging and analysis framework for quantification of vascularization in experimental arthritis.
Methods:High-resolution micro-computed tomography (μCT) was used to scan knee joints of arthritic human tumor necrosis factor transgenic (hTNFtg) mice and non-arthritic wild-type controls previously perfused with
lead-containing contrast agent Microfil MV-122. Vessel segmentation was performed by combination of intensity-based (local adaptive thresholding) and form-based (multi-scale method) segmentation techniques. Four anatomically defined concentric spherical shells centered in the knee joint were used as analysis volumes of interest. Vessel density, density distribution as well as vessel thickness, surface, spacing and number were measured. Simulated digital vessel tree models were used for validation of the algorithms.
Results:High-resolutionμCT allows the quantitative assessment of the vascular tree in the knee joint during arthritis. Segmentation and analysis were highly automated but occasionally required manual corrections of the vessel
segmentation close to the bone surfaces. Vascularization was significantly increased in arthritic hTNFtg mice compared to wild type controls. Precision errors for the morphologic parameters were smaller than 3% and 6% for intra- and interoperator analysis, respectively. Accuracy errors for vessel thickness were around 20% for vessels larger than twice the resolution of the scanner.
Conclusions:Arthritis-induced changes of the vascular tree, including detailed and quantitative description of the number of vessel branches, length of vessel segments and the bifurcation angle, can be detected by contrast-enhanced high-resolutionμCT.
Keywords:Angiogenesis, Vascularization, Inflammatory arthritis,μCT, Vessel segmentation
Background
Rheumatoid arthritis is a chronic inflammatory joint dis-ease characterized by proliferation of the synovial tissue and influx of immune cells into the joint, which results in articular cartilage and bone degradation [1,2]. The complex changes in tissue architecture during inflamma-tory arthritis rely on a profound reorganization of the vasculature of the joint, which governs cell in- and efflux
as well as the proliferation, an invasion of inflammatory tissue into the cartilage and the bone [3].
Angiogenesis is the formation of new blood vessels by sprouting and pruning of existing vessels [4]. This process occurs physiologically in the embryo and during pathology such as wound healing but also in conjunction with more chronic processes such as cancer or chronic inflammatory disease. During inflammatory arthritis new blood vessels are continuously built in the synovial tissue in order to support the high metabolic activity of the in-flammatory tissue. These microvessels allow the migra-tion of immune cells into the inflammatory tissue but * Correspondence:[email protected]
1
Institute of Medical Physics, University of Erlangen-Nuremberg, Henkestr. 91, 91052 Erlangen, Germany
Full list of author information is available at the end of the article
also facilitate the invasion of inflammatory synovial tis-sue into bone and cartilage [5-7]. Furthermore, the pro-liferation of resident mesenchymal cells as well as the high metabolic activity of immune cells in the context of joint inflammation requires an energy supply, which es-sentially depends on an appropriate perfusion enabled by microvessels.
Most of the studies to date have assessed the vascu-larization of the arthritic joints by histology, which has limitations based on its 2-dimesional character. Histo-logic examination of the blood vessels hardly allows understanding changes of the vascular tree and the vascular architecture during arthritis [8,9]. We there-fore aimed to visualize and quantify the anatomical basis of the vascularization of the joint during arthritis. We employed high-resolution contrast-enhanced μCT imaging in order to get a comprehensive picture of the changes of the vasculature in the inflamed joint.
The problem to quantify angiogenesis and vascu-larization is relevant beyond arthritis and similar tech-niques also using high resolution μCT imaging have recently been developed for tumor research [10,11]. In this methodologically-orientated study we developed dedicated imaging and image analysis protocols for arth-ritis and applied them in a preclinical model.
Methods μCT imaging
In order to optimize the contrast between blood vessels and surrounding soft tissue, the lead-containing contrast agent Microfil MV-122 (http://www.flowtech-inc.com/ microfil.htm) was administered into the aorta of wild type and human tumor necrosis factor transgenic (hTNFtg) mice (each N = 7) prior to imaging [12]. All animal experi-ments were according to the German Laws for Animal Protection (Tierschutzgesetz) and Animal Experiments (Tierversuchsgesetz) and approved by the responsible in-stitutions (Bundesinstitut für Risikobewertung).
Systemic perfusion was started by anesthetizing the animals with 100 μl Ketamin (100 mg/ml, Pfizer) and 50 μl Xylacin (20 mg/ml, Bayer). After deep anesthesia, checking that no withdrawal reflexes were present, the chest was opened and the left heart chamber punctuated by a 20G cannula. The perfusion was started by flushing the circulation system with 20 ml NaCl 0.9% + 2000 IE heparin with a pump (Ismatec ISM597D). Immediately after begin the circulation system was relieved by cutting large parts of the liver. After perfusion with 20 ml NaCl the perfusant was switched to 20 ml buffered 10% for-malin. All solutions were delivered at 37°C and with a pressure of 130 mmHG. Afterwards the manual perfu-sion was performed with yellow Microfil® (MV-122, 4 ml compound + 5 ml diluent + 0,5 ml curing agent). Finally
the aorta and portal vein were ligated and the mice were placed at 4°C for 24 h.
After hardening of the contrast agent, the knee joints were excised. The samples were scanned with a custom built high-resolution μCT scanner developed at the In-stitute of Medical Physics [13] using 70 kV and 140μAs. Datasets were reconstructed with an isotropic voxel size of 15 microns using 600 projections. Scan times were approximately one hour per sample.
Quantification of vascularization
A multi step 3D segmentation procedure described in detail in the Appendix was developed to separate vessels from bone and soft tissue. Two different techniques, both originally developed for the analysis of trabecular bone architecture were used for the quantification of the vascularization in four concentric volumes of interest (VOIs) centered in the knee joint. Vessel density (vessel volume per tissue volume, VV/TV) was computed in analogy to bone volume per tissue volume (BV/TV). Based on the assumption of a rod-like vessel geometry [14] vessel thickness (V.Th2D), vessel separation (V.Sp2D)
and vessel number (V.N2D) were calculated as averages
from a slice by slice analysis.
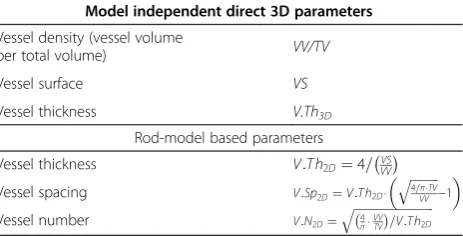
The second technique [15], which does not require specific model assumptions, was applied to calculate ves-sel surface (V.S) and the direct vessel thickness (V.Th3D), determined as a distance transform of the centerline voxels of the vessels obtained by a thinning algorithm. Table 1 summarizes the quantitative parameters used in this study. It should be noted that the vessel thickness represents the contrast filled lumen diameter of the ves-sel but for readability we will continue to use the term vessel thickness.
Vascular tree models
[image:2.595.307.539.615.733.2]To estimate the accuracy of computed parameters, CT datasets of 10 different digital vessel tree models were simulated. Each tree consisted of various vessel seg-ments of different orientation and diameter. The vessel tree models were used to compare the different seg-mentation methods. In addition to the local adaptive
Table 1 Parameters to quantify vascularization
Model independent direct 3D parameters
Vessel density (vessel volume
per total volume) VV/TV
Vessel surface VS
Vessel thickness V.Th3D
Rod-model based parameters
Vessel thickness V:T h2D¼4=VVVS
Vessel spacing V:Sp2D¼V:T h2D⋅
ffiffiffiffiffiffiffiffiffiffi 4=π⋅TV VV
q
−1
Vessel number V:N2D¼
ffiffiffiffiffiffiffiffiffiffiffiffiffiffiffiffiffiffiffiffiffiffiffiffiffiffiffiffiffi 4
π⋅VVTV
threshold (LAT) and multi scale (MS) segmentation techniques described in the Appendix, a simple global threshold (GT) segmentation was also used to classify vessels. In addition, the digital vascular tree models were used to compare the accuracy of the two vessel thickness parameters. The true thickness is known from the model generation.
Analysis reproducibility
Intra- and inter-operator reanalysis precision calculated as root mean square coefficient of variation CVrms [16] was determined using datasets from 6 different mice. For intraoperator precision one operator analyzed each 6 datasets three times. Inter-operator precision was de-termined from the analysis of the six datasets by three different operators.
Results
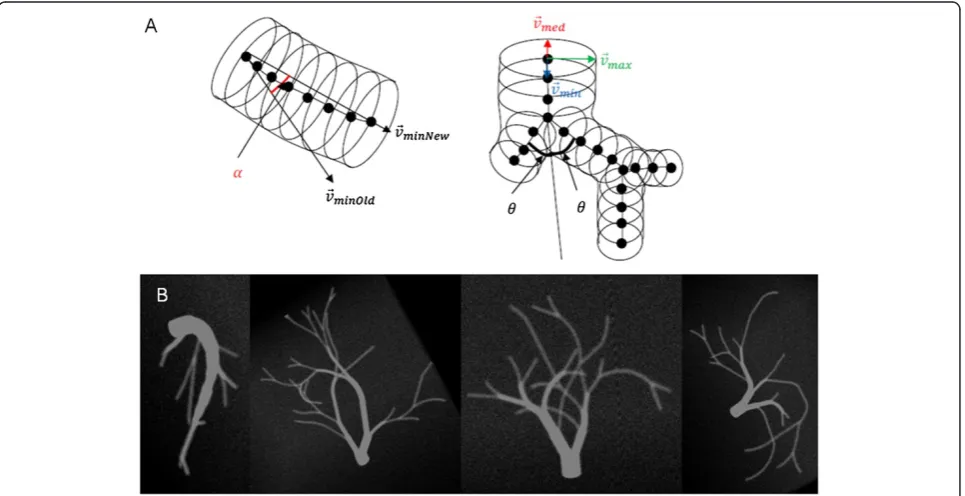
Construction of digital vascular models
The generation of the digital vascular models is illus-trated in Figure 1. An individual vessel segment con-sisted of oriented circles to approximate a curved cylinder. The curving and branching anglesαand θand the vessel diameter were randomly chosen based on cer-tain boundary conditions, for example that branching re-duced the vessel diameter but total cross-sectional vessel area before and behind the branch was constant. To simulate realistic data, the generated vascular vessel tree datasets were then smoothed by Gaussian blurring and noise was added.
Accuracy of vessel volume measurement
We first addressed the effect of the three different seg-mentation techniques (GT, MS, LAT) on vessel volume and number (Figure 2). Most accurate results for vessel volume (Figure 2A) were obtained with the MS segmen-tation, whereas the LAT method consistently overesti-mated vessel volume by a factor two. In contrast, the MS segmentation in most models could not reproduce the vessel number of the model. Each model consisted of one connected structure, but with MS on average more than 10 separate entities were measured, i.e. more than 10 disruptions of the vessel tree were falsely ob-tained. This was not the case with the LAT segmenta-tion, which almost perfectly preserved the connectivity.
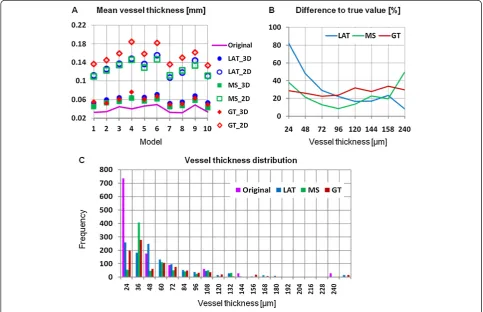
Accuracy of vessel thickness measurement
[image:3.595.58.541.467.715.2]Next we addressed the effect of the three segmentation techniques on vessel thickness, either determined by a rod-model measuringV.Th2Dor by direct measure ofV. Th3D. Obviously, the accuracy error was much higher in V.Th2D compared toV.Th3D. Nevertheless, even the dir-ect measurement considerably overestimated the true vessel thickness. The GT segmentation technique re-sulted in accuracy errors between 20% and 35% inde-pendent of vessel thickness. Accuracy errors were smaller (below 20%) except for very thin (<40 μm) or very thick vessels (>150 μm) when using the MS seg-mentation technique. Finally, the LAT segseg-mentation per-formed similar to MS in the thickness range between 100 to 150 μm but below a thickness of 50μm resulted
in increasing accuracy errors with decreasing vessel thick-ness (Figure 3B). This is confirmed in Figure 3C, which shows the V.Th3Ddistribution of the articular blood
ves-sels. In the digital model a voxel size of 12μm was used but vessels had a minimum radius of one voxel, thus only
[image:4.595.58.539.90.249.2]vessel diameters of more than 24μm appear in the digital models. The simulated CT images also had a voxel size of 12 μm but due to partial volume artifacts and noise, in particular cortical thickness is overestimated for true thickness values of less than 48μm.
Figure 2Accuracy dependence on segmentation. (A)vessel volume(B)vessel number measured as number of connected vessel segments. LAT: local adaptive threshold, MS: multi-scale and GT: global threshold based segmentation.
Figure 3Accuracy of vessel thickness determined with the digital vascular tree models. (A)2D and 3D vessel thickness compared to the true value for different segmentation algorithms. LAT: local adaptive threshold, MS: multi-scale and GT: global threshold based segmentation.
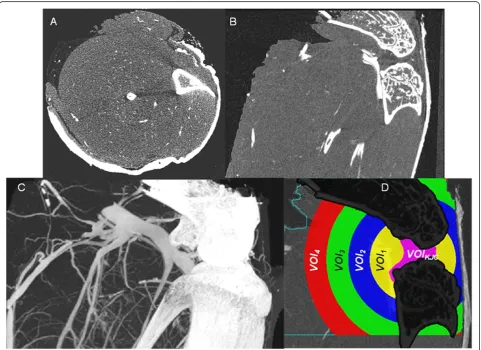
[image:4.595.56.540.366.678.2]Visualization of vascularization
Axial and oblique coronal multi-planar reformations (MPR) of a μCT dataset of a knee joint are shown in Figure 4. Some of the blood vessels perfused with lead-containing contrast agent can be recognized but the vas-cular tree of a normal non-arthritic wild-type mouse be-comes only visible in the maximum intensity projection (MIP). The technique to‘remove’ the bones and to seg-ment the vessel is described in the Appendix. Figure 4D shows the four VOIs (1–4) used for the vessel quantifi-cation, representing concentric sphere shells positioned around the center of the segmented knee joint cavity (VOIKJC). In each of the four analysis VOIs the
parame-ters described in Table 1 were measured.
Comparison of non-arthritic and arthritic mice
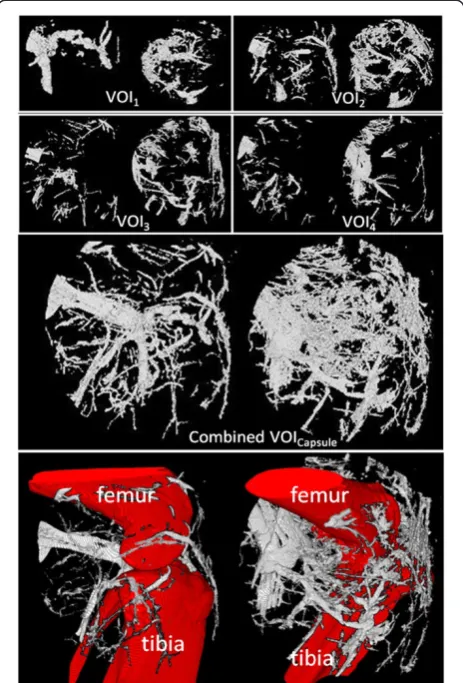
Finally, we compared the vascular tree of non-arthritic wild type mice (controls) and arthritic hTNFtg mice. Representative volume renderings for each of the four
VOIs in non- arthritic wild type mice and arthritic hTNFtg mice are shown in Figure 5. Vessel density and number decreased in both strains from the most central VOI1to the most peripheral VOI4, (Table 2). This effect
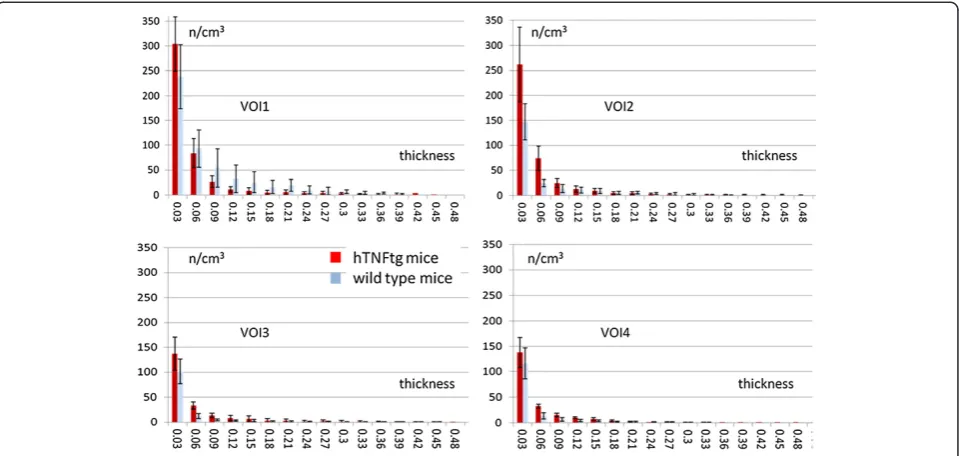
is independent of vessel thickness; meaning that the closer the VOI is located to the joint, the higher the vascularization is (Figure 6). Furthermore, in all four VOIs the number of smaller vessels was consistently larger than the number of larger vessels but obviously larger vessels have a higher impact on VV/TV than smaller vessels.
In VOI2, VOI3, and VOI4average vessel density, vessel
surface and vessel number were significantly increased in arthritic hTNFtg mice and vessel spacing was signifi-cantly decreased compared to the wild type controls (Figure 6). In VOI2, VOI3, and VOI4vessel thickness did
[image:5.595.58.540.335.685.2]not differ significantly between the two strains (Table 2) although numerically thickness was higher in arthritic hTNFtg mice than in controls. In VOI1, which is closest
Figure 4μCT images of a knee joint of a non-arthritic mouse perfused with lead containing contrast agent. (A)Axial and(B)oblique coronal multiplanar reformations (MPR).(C)Maximum intensity projection (MIP) showing similarity in image contrast of bone and contrast agent filled blood vessels. Beam hardening artifacts, which complicate vessel segmentation, are visible as dark bars between tibia and fibula in(A).(D)
to the knee joint results differed. Results for averageVV/ TV,VS,V.N2D, and V.Sp2D were no longer significantly different between the two strains (Table 2). Average
VV/TV was numerically 50% larger in the wildtype
controls and averageV.Th3Din VOI1was even
signifi-cantly larger in the wildtype controls, suggesting profound reorganization of the vascular tree during arthritis. Further insights were taken from the analysis of vessel thickness in VOI1. The central joint compartment contained more
small (30–45μm) vessels in the hTNFtg mice than in con-trols but the number of thicker (>60μm) vessels is higher in the controls, explaining the higher average VV/TV value for VOI1in the controls.
Precision errors and computing time
Reanalysis precision results are shown in Table 3. Preci-sion errors varied between 1% and 6%. Typically
inter-operator precision errors were higher than intra-inter-operator errors, which rarely exceeded 3%. High inter-operator errors were found in VOI1for VV/TV and VS, which
in-dicates differences in manual corrections of vessel seg-mentation close to the bone surface, since in VOI1the
proportion of bone surface is higher than in the other three VOIs. Average analysis time for a 8003voxel data-set (size 1.4 GB) including potential manual corrections was 15 min on a 3.4 GHz Intel Xeon 4 core PC with 16 GB of memory.
Discussion
We presented an integrated framework for high-resolutionμCT imaging and analysis of vascularization in the normal and arthritic knee joint of the mouse. Com-pared to other studies the main advantage of this tech-nique is the fully 3D imaging and analysis approach. The application of lead containing contrast agent in combin-ation with a hybrid segmentcombin-ation technique and the vir-tual removal of bone tissue allows for a reliable separation of the blood vessel system from bone and soft tissue.
Recently several studies have used comparative ap-proaches applying μCT in vitro in mice perfused with Microfil to study angiogenesis in tumors. [10,11] which also demonstrated the potential of this in vitro tech-nique. One additional complication in our application was the comparable contrast of perfused vessels and bone which required the use of a hybrid segmentation approach. The presence of bone also prevents the effect-ive use of advanced fluorescence based 3D analysis tech-niques used in tumor research [17].
[image:6.595.58.290.90.432.2]We tested the integrated framework developed here for the analysis of vascularization in an animal model of Figure 5Vessel segmentation results using MSLAT algorithm in
the four different volumes of interests (VOIs) 1–4 and in the combined VOICapsule.In each box the results for a non-arthritic
wild-type control (left images) and an arthritic human tumor necrosis factor alpha transgenic (hTNFtg) mouse (right images) are shown. The combined VOICapsuleis shown with and without femur, tibia and fibula. Also please note that the images of VOIs 1–4 are scaled differently.
Table 2 Vascular parameters in non-arthritic and arthritic mice
VOI1 VOI2 VOI3 VOI4
TV [mm3] WT 10.6 ± 5.2 34.6 ± 4.9 59.6 ± 4.6 69.0 ± 7.0
hTNFtg 11.5 ± 3.1 40.0 ± 11.3 66.0 ± 13.4 78.4 ± 14.4
VV/TV [%] WT 5.9 ± 3.1 2.0 ± 0.6
2 1.1 ± 0.51 1.4 ± 0.52
hTNFtg 3.7 ± 1.8 3.2 ± 0.7 1.8 ± 0.4 2.4 ± 0.3
VS [mm2] WT 6.2 ± 3.7 8.4 ± 3.0
2 9.4 ± 3.81 12.5 ± 5.02
hTNFtg 6.0 ± 1.9 18.7 ± 7.9 16.0 ± 5.6 22.3 ± 5.4
V.Th3D[μm]
WT 81.4 ± 19.51 71 ± 14.6 56.2 ± 10.2 57.4 ± 7.1
hTNFtg 59.0 ± 13.9 61 ± 9.1 65.0 ± 21.5 64.0 ± 6.5
V.N2D[1/mm]
WT 1.4 ± 0.3 0.9 ± 0.23 0.8 ± 0.12 0.8 ± 0.12
hTNFtg 1.6 ± 0.2 1.5 ± 0.2 1.0 ± 0.1 1.0 ± 0.1
V.Sp2D[mm]
WT 0.6 ± 0.2 0.9 ± 0.23 1.1 ± 0.22 1.1 ± 0.21
hTNFtg 0.5 ± 0.1 0.6 ± 0.1 0.9 ± 0.1 0.8 ± 0.1
TV: total volume; VV: vessel volume; VS vessel surface; V.Th3D: vessel thickness;
V.N2D: vessel number; V.Sp2D:vessel spacing; WT: wild type mice; hTNFtg:
human tumor necrosis factors transgenic mice.
1
0.01≤p < 0.05.2
0.001≤p <0.01;3
[image:6.595.304.538.110.292.2]inflammatory arthritis, which is characterized by in-creased vasculogenesis. Indeed, this approach was sensi-tive enough to detect the increased vascularization elicited by arthritis. Independent of vessel thickness, ves-sel density was increased in arthritic hTNFtg mice com-pared to non-arthritic controls. Consistent with this finding vessel surface and vessel number were increased, whereas vessel spacing was decreased in arthritis. Stun-ningly, the distribution of larger and smaller size vessels was fundamentally different between arthritic and non-arthritic mice.
Technically, we have overcome several hurdles in ana-lyzing the microvascular tree of arthritic joints in mice. First, the combination of two different segmentation algo-rithms improved the overall segmentation result at accept-able computational performance. While still some user interaction was necessary to edit the vessel segmentation intra-operator reanalysis precision errors were low and interoperator reanalysis precision errors were acceptable. Nevertheless, operator interactions should be further de-creased to improve reanalysis precision. Second, the size of the VOIs was adjusted to the size of the knee, which fa-cilitates the analysis of cross-sectional studies involving mice of different sizes. Importantly, total VOI volume did not differ significantly between arthritic and non-arthritic mice for any of the four different VOIs.
Finally, another important part of the study was the use of digital vessel models to validate the quantitative parameters. None of the segmentation techniques was perfect. MS showed lower accuracy errors for vessel thickness and volume but higher accuracy errors for ves-sel number than LAT. Also, one has to consider that due to the blurring step applied to the digital models one cannot expect to exactly measure the true vessel thickness and volume used in the simulation. One can-not correct the limited spatial resolution of a CT scanner and hence resulting problems like partial volume effects are hampering “true” segmentations. Therefore, highest accuracy errors were measured for vessels that were smaller than twice the minimum voxel.
[image:7.595.59.539.89.317.2]One limitation of the study was that the combination of the LAT and MS segmentation and in particular the Figure 6Vessel thickness distribution (mean ± SD) in volume of interests (VOI ) 1–4, averaged over all samples in each group and normalized with the corresponding total volume (TV).Red bars: arthritic human tumor necrosis factor alpha transgenic (hTNFtg) mice; blue bars: non-arthritic wild-type controls.
Table 3 CVRMSin % for inter- and intraoperator analysis
VOI1 VOI2 VOI3 VOI4
TV [mm3] Inter 2.5 2.2 1.5 1.7
Intra 1.6 0.6 1.0 1.6
VV/TV [%] Inter 6.0 3.0 2.8 4.7
Intra 3.3 2.0 2.6 2.5
VS [mm2] Inter 6.0 2.9 4.1 4.9
Intra 5.0 2.5 2.0 4.1
V.Th3D[μm]
Inter 3.1 1.8 3.7 4.7
Intra 2.4 1.8 1.3 1.3
V.N2D[1/mm]
Inter 2.8 1.8 5.6 2.8
Intra 2.2 1.8 1.8 2.2
V.Sp2D[mm]
Inter 3.9 2.2 5.0 3.1
Intra 2.7 2.0 2.0 2.6
TV: total volume; VV: vessel volume; VS vessel surface; V.Th3D: vessel thickness;
[image:7.595.57.289.534.715.2]definition of the VOIs used for one of the two algo-rithms (Figure 7) as well as the separation of the joint capsule into 4 concentric VOIs was empirical. Also the vessel segmentation close to the bone was still not per-fect and required user corrections in about 50% of the cases. No attempts have been integrated into our frame-work to improve the connectivity of the vessel netframe-work, for example by joining branch ends that are close to-gether. Thus, measures of connectedness of the vessel tree other then the number of vessels were not obtained. Our technique could be used to quantify vessel branch-ing but this has not been implemented yet. Another technique recently developed for the vessel quantification in tumors is multispectral fluorescence ultramicroscopy using optical sectioning [17], however, this technique is difficult to use in the presence of bone shading vessels be-hind bone. Alternative techniques such as μMRI do not have the required resolution. More indirect, MR methods like DCE or perfusion have not been published for the mouse knee principally due to the above mentioned limi-tation of spatial resolution.
Finally we did not compare the μCT results with con-ventional histological procedures which often are still considered as gold standard when morphologically char-acterizing vessel density and vessel size. However, as vessel morphology may vary from slice to slice a real comparison would require a 2D-3D registration or a comparison with 3D histology, which was beyond the scope of the current study. Instead we used digital models for the validation process.
Conclusions
A fully 3D imaging and analysis framework has been de-veloped to quantify the vascularization in the mouse knee. The complete knee, i.e. the total joint capsule was included in the investigation. The segmentation using a
hybrid approach of LAT and MS techniques was largely automated and allowed for operator corrections, which may be necessary in the vicinity of the bone tissue. Standard morphological parameters such as VV/TV,VS, V.Th3D andV.Sp2Dwere used to assess the vascular net-work within anatomically defined VOIs centered in the knee joint and covering the complete knee joints cap-sule. Intra- and interoperator analysis precision was good (<3%) and acceptable (<6%) and accuracy was vali-dated with simulated digital vessel models, suggesting that this framework is useful to analyze the changes of the microvascular architecture in arthritis.
Appendix: vessel segmentation Preparative steps
[image:8.595.55.539.536.693.2]The novel vessel segmentation technique introduced in this study is a multi-step procedure consisting of bone segmentation, definition of a volume of interest (VOI) and vessel segmentation inside this VOI. Due to the similarity of the intensity values of bone and contrast agent filled vessels and due to noise and partial volume and beam hardening artifacts in the vicinity of bone (Figure 4), the first step is the virtual removal of the bones from the investigation volume. An alternate ap-proach often used in specimen studies is a decalcifica-tion of the bone matrix. But this is a tedious time consuming technique. Dedicated software tools such as the one developed in this study offer the possibility to virtually remove the bone before the vessel segmenta-tion. After a coarse segmentation of the larger vessels, bone was segmented using an adaptive intensity thresh-old based volume growing algorithm and subsequent morphologic operations as described earlier [18]. The initial coarse vessel segmentation step is required to pre-vent the volume growing process used for the bone seg-mentation from leaking out into the larger vessels.
The next step is the definition of a VOI to constrain the vessel analysis. The size and position of the VOI should be defined relative to the anatomy of the indivi-dual mouse knee in order to be able to compare results in cross-sectional studies. For longitudinal in vivo studies, which are not topic of this investigation, also a good re-producibility of the VOI position is required. During RA propagation the inflammatory process is concentrated within the synovium. Therefore, it is useful to position the VOI in the centre of the knee and define its size as a por-tion of the size of the bounding sphere covering the knee joint cavity.
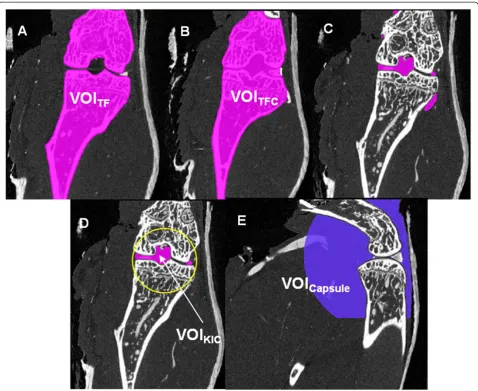
For the required segmentation of the knee joint cavity, the segmented tibia and femur VOIs were combined into one binary volume (VOITF) and closed with a big
structure element resulting in the binary volume VOITFC
(Figure 8). The binary volume of the knee joint cavity (KJC) can then easily be obtained by the subtraction:
VOIKJC¼VOITFCnVOITF
in combination with a subsequent search and selection of the largest connected volume. The bounding sphere was a sphere positioned in the VOIKJC centre and fully included VOIKJC. It was scaled with an empirically de-fined factor of 2.5 to approximate the joint capsule, which is not visible in the μCT datasets. The resulting VOICapsulewas used as VOI for the vessel segmentation (Figure 8). During RA the volume of the joint capsule increases, resulting in a swollen joint. However, in our analysis VOICapsuledoes not depend on disease status.
Volume growing approach using local adaptive threshold (LAT)
After virtual removal of the bones, in VOICapsule vessels
must be separated from soft tissue. Unfortunately due to partial volume artifacts thicker vessels have higher inten-sity values than thinner ones, which are difficult to seg-ment in the presence of noise. As a consequence, the use of global thresholds for segmentation results in dis-continuities in the vessel network. As an alternative we used a local adaptive segmentation, which easily adapts to the changing intensity values in a given neighbour-hood. First, two thresholds were computed:
Tlow¼μSTþ2⋅σST
Thigh¼0:65⋅Hmax
whereμSTis the mean soft tissue value,σSTthe standard deviation and Hmax the maximum value of a Gaussian curve fitted to the histogram of the intensity values of the voxels in VOICapsule. If the intensity value lies outside the interval [Tlow, Thigh] the voxel can be classified as a soft tissue or vessel voxel.
f I xyz¼
if Ixyz<Tlow soft tissue
if Ixyz≥Thigh vessel
otherwise gðμ; σÞ
8 < :
In the ‘otherwise’case the following adaptive classifi-cation is used:
gðμ;σÞ ¼ ifotherwiseσ=μ<α⋅τ soft tissuevessel
τ¼σST=μST
α¼1:0
whereμandσare the mean intensity and standard devi-ation of the 26-neighbourhood of the voxel under con-sideration. All connected voxels satisfying the criterion above will be classified as vessel voxels using again a vol-ume growing algorithm (Figure 3A). The method de-scribed here does not use any vessel form or shape properties. It only searches for homogeneously con-nected voxels of high intensity. In order to use a priori information of vessel properties, in addition a multi-scale segmentation method was implemented and compared to volume growing with local adaptive thresholds.
Multi-scale segmentation (MS)
Based on earlier studies on vessel segmentation [19,20] a multi-scale algorithm was used to enhance the vessel contrast prior to segmentation. It is based on the as-sumption that vessels are of cylindrical shape and that highest voxel intensity values occur in the vessel center. To minimize noise and increase vessel intensity, an it-erative Gaussian smoothing with different mask sizes was used. After each iteration step a response function Rs was determined [20] from the three eigenvalues λ1 -λ3 of the Hessian matrix and the maximum value of each iteration was saved as result.
RSðλ1;λcÞ ¼ e
− λ 2 1 2ðα1λcÞ2
!
λ1≤0;λc≠0
e − λ
2 1 2ðα2λcÞ2
!
λ1>0; λc≠0
0 λc¼0
8 > > > > > > > < > > > > > > > :
λc¼ minð−λ2;−λ3Þ
α1¼0:5; α2¼2:0
λ1≥λ2≥λ3:
Figure 8Definition of volumes of interest (VOI) and segmentation of the knee joint cavity. (A)Combined tibia and femur VOIs (VOITF),
(B)after closing VOITFwith a big structure element (VOITFC),(C)resulting preliminary knee joint cavity after subtraction of VOITFfrom VOITFC,
(D)largest connected volume defined as final knee joint cavity (VOIKJC) with bounding sphere,(E)resulting analysis VOICapsule.
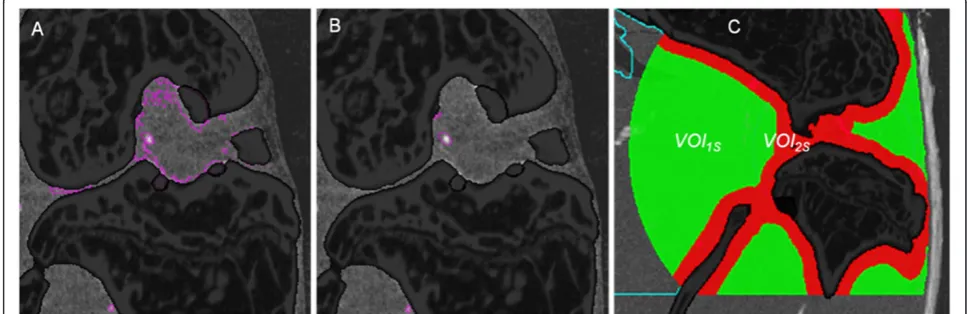
[image:10.595.59.539.525.725.2]Hybrid MSLAT algorithm
The LAT approach can easily be implemented and com-puted. Results are adapted to changing intensity values and LAT shows better vessel connectedness than the MS algorithm (Figure 9). However, due to beam hardening artifacts the intensity values of soft tissue voxels in the vicinity of bone are frequently comparable to those of bone (Figure 7A). Here LAT very often fails and the MS algorithm shows better results (Figure 7B). Therefore, we used a combination of the two methods to improve the overall result. Consequently VOICapsule was divided into
two VOIs (Figure 7C). LAT segmentation was applied in VOI1S(green) and MS segmentation in VOI2S(red).
Abbreviations
BV/TV:Bone volume per tissue volume; CT: Computed tomography; CVrms: Root mean square coefficient of variation; hTNFtg: Human tumor necrosis factor transgenic; GT: Global threshold; KJC: Knee joint cavity; LAT: Local adaptive threshold; MIP: Maximum intensity projection; MPR: Multi-planar reformations; MS: Multi scale; MSLAT: Hybrid of MS and LAT segmentation; TV: Tissue volume;μCT: Micro-computed tomography; VOI: Volume of interest; V.N2D: Vessel number; V.S: Vessel surface; V. Sp2D: Vessel spacing; V.Th2D: Vessel thickness; V.Th3D: Vessel thickness calculated with direct method; VV: Vessel volume; VV/TV: Vessel volume per tissue volume.
Competing interests
The authors declare that they have no competing interests.
Authors’contributions
SV developed the vessel segmentation software, performed the analysis and co-drafted the manuscript. OM contributed to the software design, data management and statistical analysis. JK performed the preparation of the animals, in particular the contrast agent injection. AH contributed to study design, imaging and analysis. GS contributed to study design, data interpretation and careful revision of the manuscript. KE contributed to study design, guided the software development and statistical analysis and co-drafted the manuscript. All authors read and approved the final manuscript.
Acknowledgements
We acknowledge support of the German Research Foundation DFG (Forschergruppe 661, TP4 and TP7 and SPP1468-Immunobone), the Bundesministerium für Bildung und Forschung (Ankyloss), the Masterswitch project of the European Union and the IMI funded project BTCure. Initial study results have been presented at the Osteologie meeting 2012, Basel, Switzerland and at the BVM (Bildverarbeitung in der Medizin) meeting 2013, Heidelberg, Germany.
Author details 1
Institute of Medical Physics, University of Erlangen-Nuremberg, Henkestr. 91, 91052 Erlangen, Germany.2Institute of Pharmacology and Toxicology,
University of Erlangen-Nuremberg, Erlangen, Germany.3Department of
Internal Medicine 3 and Institute for Clinical Immunology, University of Erlangen–Nuremberg, Erlangen, Germany.
Received: 13 August 2014 Accepted: 27 August 2014 Published: 6 September 2014
References
1. Neumann E, Lefevre S, Zimmermann B, Gay S, Muller-Ladner U:Rheumatoid arthritis progression mediated by activated synovial fibroblasts.Trends Mol Med2010,16(10):458–468. 2010/08/27.
2. Ospelt C, Neidhart M, Gay RE, Gay S:Synovial activation in rheumatoid arthritis.Front Biosci2004,9:2323–2334. 2004/09/09.
3. Kennedy A, Ng CT, Biniecka M, Saber T, Taylor C, O’Sullivan J, Veale DJ, Fearon U:Angiogenesis and blood vessel stability in inflammatory arthritis.Arthritis Rheum2010,62(3):711–721. 2010/02/27.
4. Risau W:Mechanisms of angiogenesis.Nature1997,386(6626):671–674. 1997/04/17.
5. Ashraf S, Walsh DA:Angiogenesis in osteoarthritis.Curr Opin Rheumatol 2008,20(5):573–580. 2008/08/14.
6. Fearon U, Veale DJ:Angiogenesis in arthritis: methodological and analytical details.Methods Mol Med2007,135:343–357. 2007/10/24. 7. Marrelli A, Cipriani P, Liakouli V, Carubbi F, Perricone C, Perricone R,
Giacomelli R:Angiogenesis in rheumatoid arthritis: a disease specific process or a common response to chronic inflammation?Autoimmun Rev 2011,10(10):595–598. 2011/05/07.
8. Raatz Y, Ibrahim S, Feldmann M, Paleolog EM:Gene expression profiling and functional analysis of angiogenic markers in murine collagen-induced arthritis.Arthritis Res Ther2012,14(4):R169. 2012/07/24. 9. Zhao Q, Shen X, Zhang W, Zhu G, Qi J, Deng L:Mice with increased
angiogenesis and osteogenesis due to conditional activation of HIF pathway in osteoblasts are protected from ovariectomy induced bone loss.Bone2012,50(3):763–770. 2011/12/24.
10. Ehling J, Theek B, Gremse F, Baetke S, Mockel D, Maynard J, Ricketts SA, Grull H, Neeman M, Knuechel R, Lederle W, Kiessling F, Lammers T: Micro-CT imaging of tumor angiogenesis: quantitative measures describing micromorphology and vascularization.Am J Pathol2014, 184(2):431–441. 2013/11/23.
11. Savai R, Langheinrich AC, Schermuly RT, Pullamsetti SS, Dumitrascu R, Traupe H, Rau WS, Seeger W, Grimminger F, Banat GA:Evaluation of angiogenesis using micro-computed tomography in a xenograft mouse model of lung cancer.Neoplasia2009,11(1):48–56. 2008/12/25. 12. Marxen M, Thornton MM, Chiarot CB, Klement G, Koprivnikar J, Sled JG,
Henkelman RM:MicroCT scanner performance and considerations for vascular specimen imaging.Med Phys2004,31(2):305–313. 2004/03/06. 13. Engelke K, Karolczak M, Lutz A, Seibert U, Schaller S, Kalender W:[Micro-CT.
Technology and application for assessing bone structure].Radiologe 1999,39(3):203–212.
14. Parfitt AM, Drezner MK, Glorieux FH, Kanis JA, Malluche H, Meunier PJ, Ott SM, Recker RR:Bone histomorphometry: standardization of
nomenclature, symbols, and units.J Bone Miner Res1987,2:595–610. 15. Hildebrand T, Rüegsegger P:A new method for the model independent
assessment of thickness in three-dimensional images.J Microsc1997, 185:67–75.
16. Glüer CC, Blake G, Lu Y, Blunt BA, Jergas M, Genant HK:Accurate assessment of precision errors: how to measure the reproducibility of bone densitometry techniques.Osteoporos Int1995,5(4):262–270. 17. Dobosz M, Ntziachristos V, Scheuer W, Strobel S:Multispectral fluorescence
ultramicroscopy: three-dimensional visualization and automatic quantifi-cation of tumor morphology, drug penetration, and antiangiogenic treatment response.Neoplasia2014,16(1):1–13. 2014/02/25.
18. Kang Y, Engelke K, Kalender WA:A new accurate and precise 3-D segmen-tation method for skeletal structures in volumetric CT data.IEEE Trans Med Imaging2003,22(5):586–598.
19. Korfiatis PD, Kalogeropoulou C, Karahaliou AN, Kazantzi AD, Costaridou LI: Vessel tree segmentation in presence of interstitial lung disease in MDCT.IEEE Trans Inf Technol Biomed2011,15(2):214–220. 2011/02/15. 20. Sato Y, Nakajima S, Shiraga N, Atsumi H, Yoshida S, Koller T, Gerig G, Kikinis
R:Three-dimensional multi-scale line filter for segmentation and visualization of curvilinear structures in medical images.Med Image Anal 1998,2(2):143–168. 2000/01/26.
21. Xiong H, Wu J, Chen J:K-means clustering versus validation measures: a data-distribution perspective.IEEE Trans Syst Man Cybern B Cybern2009, 39(2):318–331. 2008/12/20.
doi:10.1186/1471-2474-15-298
Cite this article as:Gayetskyyet al.:Characterization and quantification of angiogenesis in rheumatoid arthritis in a mouse model usingμCT.