2019 International Conference on Information Technology, Electrical and Electronic Engineering (ITEEE 2019) ISBN: 978-1-60595-606-0
Simulation Analysis for the Air Conditioning System of a Conference Hall
Fu-jen WANG
1,*, John-win SIEW
1and Wen-bin NG
21
Department of Refrigeration, Air Conditioning, and Energy Engineering, National Chin-Yi University of Technology, Taichung, Taiwan
2
Heating, Ventilation, Air Conditioning and Refrigeration Section, University Kuala Lumpur, Selangor, Malaysia
*Corresponding author
Keywords: Conference hall, Computational fluid dynamic (CFD), Numerical simulation, Temperature distribution, Predicted mean vote (PMV)
Abstract. The conference hall airflow type is one of the most representative and typical pattern for air-conditioning of large space area. However, little quantitative knowledge has been presented especially for optimum supply air temperature and velocity for the concern of thermal comfort and energy saving. In this study, numerical simulation of a full scale conference hall has been carried out extensively for the exhibition hall in Taiwan. Different air velocity and temperature of supply air have been evaluated from ceiling to floor level under audience seats. Through Computational Fluid Dynamic (CFD) of the temperature distribution and airflow distribution, better indoor environmental parameters as well as energy saving concern of the conference hall could be achieved. The simulation results show that air velocity range in conference hall is 0.1~1.0 m/s, and temperature distribution is between 18~24˚C, which presents satisfactory thermal comfort. Different temperature and velocity of supply air can be evaluated not only to meet the design specification of 20~25˚C but also for the thermal comfort and energy-efficient concern. It implements not only the design strategies for practice different design temperature and air velocity, but also reduce running cost at full operation condition.
Introduction
Large spaces often exhibit large variations in airflow distribution and temperature distribution especially in the vertical direction. Therefore, to obtain a good thermal environment in large space area, the most important concern is airflow and temperature distribution for the overall area. The study of the temperature distribution and airflow inside large space in the conference hall can be conducted extensively through computational fluid dynamic (CFD) simulation. Zhao1 used CFD simulation to compare two types of underground bus terminal models with ventilation system and without ventilation system on two conditions which is March and July. They found that it will exist serious concern on high temperature and air pollution. Installing ventilation system will decrease the indoor air temperature 3-5˚C and achieve the permissible air quality limitation. According to Wang2, CFD method was conducted to simulate temperature and air distribution in terms of the energy saving potential for bio-cleanroom. They found the simulation results that the improvement of energy consumption can be achieved by reducing supply airflow and increasing supply air temperature. Besides, the simulation results revealed wall surface temperature and heat flux could be treated as energy boundary conditions and the accuracy of boundary conditions can be derived based on CFD method on a multizone model by Li3. Furthermore, Zeng4 investigated the temperature and velocity field in an automobile museum by using CFD software. They found the temperature was around 26~28˚C, and the nozzle jet diffuser length was limited, coupled with the influence of the temperature distribution, so the temperature will be higher which affecting the comfort of the air conditioning.
performance. Kosutova6 investigated the non-isothermal mixing ventilation in enclosure with a heated floor with systematic analysis of impact of computational and physical parameters. They found that direction of the air recirculation will changes from clockwise to anti clockwise, if inlet velocity is decreased by 25% and 50%. Song7 carried out the actual data of classroom and improves the ventilation performance by using CFD software with four different ventilation systems. They found the thermal comfort condition will be more efficient if install double rows windows. Besides, Zhang8 conducted CFD simulations on indoor temperature distribution and air velocity distribution for floor-type fan coil air-conditioner in summer. They carried out results by adjusting blast amount of fan coil which blasting parameters can make air temperature more comfortable in summer.
Lee9 found that form-active beams (FABs) ceiling installed inside indoor space will lower the indoor air temperature at 0.4˚C based on CFD analysis. The FABs had faster heat absorption rate comparison with flat ceiling due to increased surface geometrical profile. According to Stavrakakais10, the PMV (predicted mean vote) and PMV (SET*) (predicted mean vote corrected for humidity effects) predictions differ by approximately 24 and 25% for a seated occupant respectively, and 10% and 13% differences to standing occupants by using CFD method.
System Description
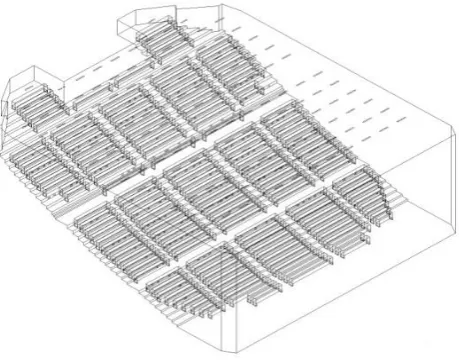
This investigated conference hall is a part of a large space for an expo building. It provides the good indoor built environment at 24˚C after full occupation of the people inside the hall. The schematic diagram of the conference hall is shown in Figure 1. Supply air temperature was fixed at 13˚C, and air velocity was set at 2 m/s through 146 pieces linear supply diffusers from 5th floor. Return air through 466 pieces return grille from 4th floor of audience seat and stable temperature was set at 24˚C for the conference hall to improve the energy-efficiency with different supply air temperature and air velocity will be conducted. The investigated conference hall with the dimension of length 50.3 m, width 42.35 m, and ceiling height 16.6 m respectively.
This study was conducted through numerical simulation of conference hall. Conference hall are needed to design for low airflow, comfortable and suitable temperature distribution. The conference hall design condition is shown in Table 1. Design for conference hall each supply air volume is 1600 m3/hr. The dimension of supply air diffuser is 1.5m x 0.15m, with supply air velocity at 2 m/s.
[image:2.595.183.413.501.683.2]Figure 1. 3D Model of conference hall.
Table 1. Design condition of supply air diffuser.
Inlet Condition Specification
CFD Modeling
The Computational Fluid Dynamic (CFD) is a very powerful, useful tool with flexibility, accuracy and breadth of application for state-of-the-art research and efficient in parametric studies for air distribution and temperature distribution. In this study, the temperature and air distribution of the conference hall was conducted by a commercial CFD code (FLUENT). It will examine the improvement of conference hall configuration and energy saving potential.
To evaluate energy saving with different temperature and air velocity of supply air, the performance improvement strategies through increasing temperature and reducing velocity of supply air were conducted by using numerical simulation. The 3D model of the conference hall is shown in Figure 1. The supply air temperature is 13˚C initially, and then increase to 15˚C and 17˚C. Air velocity of supply air at 2 m/s and is assumed initially, and then reduces to 1.5 m/s and 1 m/s to examine the variation of environmental parameter of conference hall. The heat source in the conference hall is assumed at 150 W/m2. k-ɛ equations were applied and the well-known finite control volume method with a Semi Implicit Method for Linked Equations (SIMPLE) algorithm is adopted to solve all the equations simultaneously.
Results and Discussion
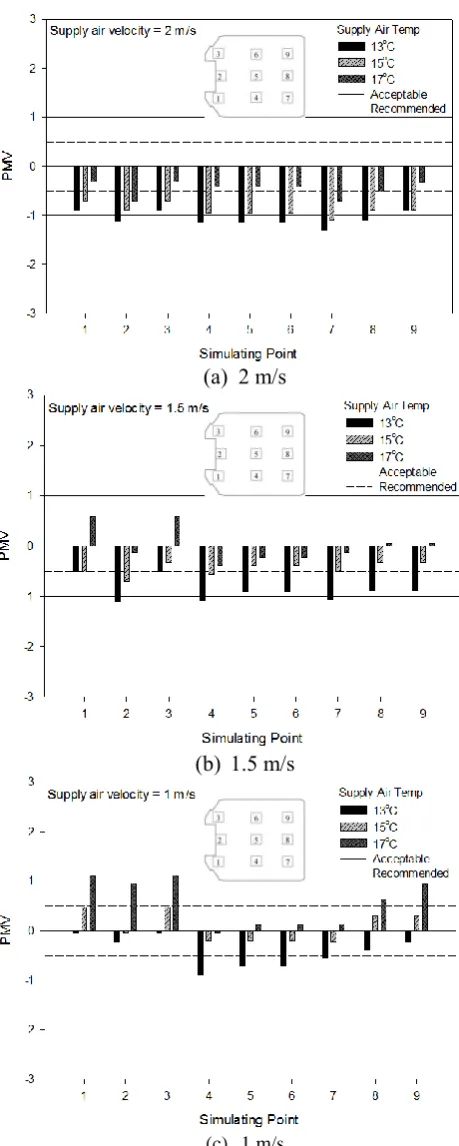
The HVAC systems with different supply air temperature and velocity have been assessed by CFD simulation to support the energy-saving strategies for the conference hall. As shown in Figure 2(a), 9 sampling simulating points were selected to evaluate temperature variation at supply air velocity of 2 m/s. All of the sampling points demonstrate the temperature variation below 25˚C the design condition of under different supply air temperature at 13˚C, 15˚C and 17˚C. It presents the feasibility of energy saving strategies by reducing air velocity and increasing air temperature accordingly. Figure 2(b) presents the temperature variation at the supply air velocity at 1.5 m/s under different supply air temperature. The results reveal the trend is similar to Figure 2(a), except for higher temperature (above 25˚C) at sampling point 1 and 3 under supply air temperature of 17˚C. Figure 2(c) shows the results for the highest temperature at supply air temperature 17˚C with face velocity 1 m/s. Figure 2(a), (b), and (c) represent the HVAC system cooling capacity can achieve the design condition for most of the cases under the different air temperature and air velocity. The feasibility of reducing the air velocity from 2 m/s to 1.5 m/s and 1 m/s is possible. It also reveals the feasibility of increasing of supply air temperature from 13˚C to 15˚C to reduce energy consumption for HVAC system to achieve energy saving concern. Figure 2(c) presents the case with supply velocity at 1 m/s and supply air temperature at 17˚C shown worst temperature distribution which presents the unacceptable thermal condition with temperature variation about 27-28˚C.
(a) 2 m/s
(b) 1.5 m/s
[image:4.595.310.540.66.640.2](c) 1 m/s
Figure 2. Temperature variation at different supply air velocity.
(a) 2 m/s
(b) 1.5 m/s
(c) 1 m/s
[image:4.595.59.291.72.637.2]Conclusion
The CFD approach was used to evaluate the thermal environment conditions under different supply air temperature and velocity in the conference hall. The temperature distribution will vary under different personnel occupancy. After extensive simulation for the conference hall, the temperature distribution is between 18~24˚C which is a little bit low while using supply air temperature 15˚C. Different supply air velocity and temperature distribution responds to the demand for air conditioning energy saving. Energy saving can be achieved while temperature distribution increasing from 13˚C to 15˚C and supply air velocity reducing from 2 m/s to 1 m/s, which the thermal comfort is still acceptable. It reveals that the energy saving potential can be improved without sacrifice of thermal comfort by using numerical temperature and air velocity distribution.
Acknowledgement
The author would like to express their great appreciation to the financial support by the Ministry of Science and Technology under the grant No. MOST 105-2221-E-167-003.
References
[1]R. Zhao, L. Zhou, J.S. Ma, CFD design of ventilation system for large underground bus terminal in Macau Barrier Gate, J. Wind Eng. & Ind. Aerodynamics. 179 (2018) 1-13.
[2]F.J. Wang, Y.H. Yau, Z.R. Liu, Y.R. Zheng, Performance evaluation through CFD simulation and field measurement on a bio-cleanroom for vaccine storage, J. Appl. Sci. 9 (2009) 4232-4239.
[3]X.D. Li, J. Gao, F.S. Gao, Simulation of temperature distribution in a large space with CFD based on a multizone model, J. Harbin Inst. of Technol. 37 (2005) 683-686.
[4]Y. Zeng, Z.Q. Han, N. Hu, Air distribution by CFD software of Beijing automobile meseum, HV&AC. 41 (2011) 34-37.
[5]B.P.P. Barbosa, N.D.C.L Brum, Validation and assessment of the CFD-0 module of CONTAM software for airborne contaminant transport simulation in laboratory and hospital applications, Build. And Environ. 142 (2018) 139-152.
[6]K. Kosutova, T.V. Hooff, B. Blocken, CFD simulation of non-isothermal mixing ventilation in a generic enclosure: Impact of computational and physical parameters, Int. J. Therm. Sci. 142 (2018) 139-152.
[7]J.F. Song, X.Q. Meng, The improvement of ventilation design in school building using CFD simulation, Proc. Eng. 121 (2015) 1475-1481.
[8]Q.L. Zhang, Y.Q. Jiao, M.K. Cao, L.W. Jin, Simulation analysis on summer conditions of ancient architecture of tower buildings based on CFD, Energy Proc. 143 (2017) 313-319.
[9]L.S.H. Daniel, E. Naboni, Exploring the relationship between structurally defined geometrical parameters of reinforced concrete beams and the thermal comfort on indoor environment, Proc. Eng. 180 (2017) 741-750.