© 2015, IRJET.NET-All Rights Reserved
Page 175
Tuning of PSO Algorithm For Single-Machine and Multi-machine Power
System Using STATCOM Controller
A.Sagarika
1, T.R.Jyothsna
2PG Student [Power Systems], Dept. of EEE, Andhra University, Visakhapatnam, India
1Professor, Dept. of EEE, Andhra University, Visakhapatnam,India
2---***---Abstract:
Damping of low-frequency electro-mechanical oscillations is essential for reliable operation of power systems. The fast acting, power electronics based FACTS controllers which are capable of improving both steady state and dynamic performance permit enhanced approaches to system stabilization. This thesis presents the control laws and location index proposed for a static synchronous compensator (STATCOM) based on a circuit analogy of the electro-mechanical system. The signals which are used can be synthesized using locally available measurements. A detailed study of small signal analysis is carried out to study the effectiveness of the control law and strategic location of the damping controller. With the objective of damping oscillations, a nonlinear constrained optimization technique has been presented for tuning the controller parameters.
Transient stability analysis has then been performed with STATCOM for a multi-machine power system. The Particle Swarm Optimization technique is developed for the STATCOM. Direct evaluation of the effect of STATCOM on transient stability is investigated. Case studies on a single machine infinite bus system and three machine systems illustrate the effect of STATCOM on the improvement of small signal and transient stability.
Objectives of a Transient Stability Analysis:
The desired objectives of a transient stability analysis are: i. The stability of the power system. Is it stable or not, to what degree is it stable, and how far is it from the stability limits?
ii. Time responses of generator variables, bus voltages, currents, and active and reactive power.
iii. System quantities that affect the performance of protective devices. The above objectives are key issues in power system design, planning and operation to ensure system stability for different prescribed disturbances. The time solution method of stability analysis, although it is s very reliable, accurate, and suitable for different modeling orders, has the following disadvantages;
1. The method involves numerical integration of a large number of differential equations for each disturbance considered. A large number of repetitive simulations is required for each case to determine either the stability
limits or the critical clearing time. This procedure is very time consuming in the system planning stage where a large number of cases need to be considered.
2. In system operations, there are situations where fast solution is needed to make operational decisions. These situations could be different from those previously considered during planning. Since the time solution method is slow, the system operator has either to overreact to ensure system security or to make decisions that may put stability of the system at risk.
3. The power system operating conditions change during the' course of the day and year, while stability studies are done off - line for certain severe cases. This leads to improper decisions in some cases and, therefore, may increase operational expenditures.
1.1.1 Transient Stability Problems:
The sustained increasing demand for electrical power requires larger interconnected power systems and operation at or near to full capacity. Therefore, transient stability of power systems becomes a major factor in planning and day-to-day operations and there is a need for fast on-line solution of transient stability to predict any possible loss of synchronism and to take the necessary measures to restore stability.
1.2 Catastrophe Theory:
It is a natural phenomenon that sudden changes can occur as a result of smooth or gradual changes. Examples might include the breakdown of an insulator when voltage is built up gradually, the collapse of a bridge by gradual load increases and the loss of synchronism of generators in a power system when subject to smooth changes in operating conditions.
© 2015, IRJET.NET-All Rights Reserved
Page 176
1.3.1 First Generation of FACTS Devices:Power electronic based controllers were in use in power systems before N.G.Hingornani’s use of terminology, FACTS. The first generations FACTS Devices have a common characteristic that is the necessary reactive power required for the compensation is generated or absorbed by traditional capacitor or reactor banks and thyristor switches are used for control of the combined reactive impedance these banks present to the system during successive periods of voltage application.
This made construction of modern Static Var Compensator (SVCs), Thyristor controlled/ Switched Series Capacitors (TCSCs/TSSCs), and thyristor Controlled Phase Shifter Regulators (TCPSs).A fundamental features of the thyristor based switching controllers is that the speed of response of passive power system components such as a capacitor or a reactor is enhanced, but their compensation capacity is still solely determined by the size of the reactive component.
1.3.2 Second Generation of FACTS devices:
The second generation of FACTS controllers is based on voltage source converters, which use turn off devices like GTO’s. A normal thyristor, having no current interruption capability, changes from on state to off-state when the current drops below the holding current and, therefore, has a serious deficiency that prevents its use in switched mode applications. With the development of the high voltage, high current gate turn-off thyristors (GTOs, IGBTs…etc), it became possible to overcome this deficiency.
STATCOM from the generation FACTS device is considered. STATCOM previously referred to as STATCON, ASVC or ASVG, resembles in many respects a rotating machine used for reactive power compensation.
Wang in [10] established the linearized Phillips-Heffcon model of power system installed with a STATCOM and demonstrated the application of the model in analyzing the damping effect of the STATCOM. Then the work was extended in [11] to study the negative interactions between STATCOM AC and DC control. To overcome the reported negative interaction a technique to design a decoupled multivariable sampled regulator for multi input multi output systems was applied for the coordinated control of STATCOM AC and DC voltage.
2.1 Particle Swarm Optimization (PSO):
Particle swarm optimization (PSO) is a population based stochastic optimization technique developed by Dr. Eberhart and Dr. Kennedy in 1995, inspired by social behavior of bird flocking or fish schooling.
PSO shares many similarities with evolutionary computation techniques such as Genetic Algorithms (GA).
The system is initialized with a population of random solutions and searches for optima by updating generations. However, unlike GA, PSO has no evolution operators such as crossover and mutation. In PSO, the potential solutions, called particles, fly through the problem space by following the current optimum particles. Each particle keeps track of its coordinates in the problem space which are associated with the best solution (fitness) it has achieved so far. (The fitness value is also stored.) This value is called pbest. Another "best" value that is tracked by the particle swarm optimizer is the best value, obtained so far by any particle in the neighbors of the particle.
2.2 Parameter Selection: 1. Range of the particles:
The ranges of the particles depend on the problem to be optimized. One can specify different ranges for different dimension of the particles
2. Maximum velocity vmax:
The maximum velocity vmax determines the maximum change one particle can take during one iteration. Usually, the range of the particle is set as vmax. In this work, a vmax = 4 is chosen for each particle as this gives better optimal results.
3. The inertia parameter:
The inertia parameter is introduced by Shi and Eberhartand provides improved performance in a number of applications. It has control over the impact of the previous history of velocities on current velocity and influences the balance between global and local exploration abilities of the particles. A larger inertia weight favors a global optimization and a smaller inertia weight favors a local optimization.
4. The parameters c1 and c2:
The acceleration constants c1 and c2 indicate the stochastic acceleration terms which pull each particle towards the best position attained by the particle or the best position attained by the swarm. Low values of c1 and c2 allow the particles to wander far away from the optimum regions before being tugged back, while the high values pull the particles toward the optimum or make the particles to pass through the optimum abruptly. If the constants c1 and c2 are chosen equal to 2 corresponding to the optimal value for the problem studied. In the same reference, it is mentioned that the choice of these constants is problem dependent. In this work, c1 = 1 and c2 = 1 are chosen which give better optimal results in lesser iterations
3.1 Static Synchronous Compensator:
© 2015, IRJET.NET-All Rights Reserved
Page 177
as GTOs. The principle of working is similar to that of asynchronous condenser. The primary control in the STATCOM is reactive current control. The reactive current is controlled by firing angle control and it is a closed loop control as the reactive current is dependent on the system parameters, unlike in the case of SVC where the control is open loop because of the dependence of susceptance on firing angle alone. However, for stability studies involving low frequency oscillations, it is adequate to ignore the closed loop controller for the reactive current and assume that Ir follows Irord with appropriate time delay (Figure
3.1).
3.2 CONTROLLER STRUCTURE:
The general block diagram of the STATCOM
supplementary modulation controller with phase compensating lead/lag network is show in Figure 3.2. In the figure, the feedback gain Xshth is the Thevenin reactance
of the STATCOM supplementary modulation controller which is tunable,
Vl is the magnitude of voltage at bus l where the controller
is connected,
Ir is the reactive current injected by the STATCOM into the
bus,
and Kr is the reactive current modulation controller gain.
mr denotes the number of stages of the compensating block
of the STATCOM modulation controller (it is zero, if the
design of the SMC is carried out without
compensation).The work presented in this chapter does not consider the phase compensating network.
ΔVl + th l V Δ mod r I
Ir
- p sT 1 1 c sT s 1 th sh X r 2 1 1 1 m r r r sT sT K Figure 3.2: Block diagram of STATCOM with supplementary modulation controller
The transfer function of STATCOM supplementary modulation controller with phase compensator is given by
th l r m 2 r 1 r c r mo d r V sT sT sT s K
I
1 1 ) 1 ( (3.1)
where the subscript ‘mod’ stands for modulating signal.
c
sT s
1
is the derivative circuit, where Tc is a small time
constant (say 0.01 sec).
Since the time delays associated delays associated with firing controls and natural response of the STATCOM can be represented by a single time constant the dynamics of the STATCOM is characterized by a first order plant transfer function c sT s 1
, where Tp = 0.02 second. Thus, the
overall transfer function of STATCOM with its supplementary modulation controller is given by
th p r m r r c r r V sT sT sT sT s K I l 2 1 1 1 1 1 ) 1 ( (3.2)
3.3 TUNING OF STATCOM SUPPLEMENTARY MODULATION CONTROLLERS:
The design parameters of the SMC for shunt and series FACTS controllers are the controller gain Kr and the
Thevenin reactance Xshth. The tuning of the SMC for
STATCOM can be viewed as getting the solution to a constrained optimization problem defined below:
j m
1 j
j
k
W
σ
min
(3.3) Such that 1 2 i 2 i i i C ω σ σ D (3.4)n
i
,
C
σ
i
2
1,2,....,
(3.5)3.4 DESIGN OF FACTS SUPPLEMENTARY MODULATION CONTROLLERS:
The damping of low frequency oscillations in power systems can be enhanced significantly by the use of supplementary modulation controllers for FACTS controllers like STATCOM and SSSC. In order to damp the oscillations due to a particular swing mode, location of the controller is very important, in addition to selection of suitable feedback signals and the corresponding control laws. Hence suitable location indices have to be used to determine the best location to damp the mode of interest. The location of FACTS controllers need not be based on damping considerations alone. Improvement in power transmission capability, active and reactive power flow control and transient stability enhancement are some of the other factors which need to be considered for determining the location of the FACTS controller
3.5 EXCITATION SYSTEM:
The synchronous machine is provided with automatic feedback controllers for regulation of terminal voltage and frequency. These controllers indirectly influence the reactive and active power outputs of the generators respectively. The main objective of the excitation system is to control the field current of synchronous machine. The field current is controlled to regular design of STATCOM.
4.1 Tunning of PSO for SMIB system
© 2015, IRJET.NET-All Rights Reserved
Page 178
introduction of STATCOM stabilizes the system. By usingthe particle swarm optimization algorithm STATCOM parameters are tuned inorder to improve the eigen values obtained with STATCOM.
The bounds for the control parameters are shown in table 4.1 and Table 4.3 shows the STSTCOM Parameters obtained from the particle swarm optimization algorithm. A STSTCOM has been used with speed as the input signal to damp this mode. The optimum value of the STATCOM gain is obtained by using particle swarm optimization algorithm. The optimum STSTCOM gain shown in Table 4.3 is chosen such that the real part of eigen value of the critical mode has maximum negative value, without destabilizing other mode. The value of washout time constant Tw is selected as 2.0 sec.
Table 4.4 shows the eigen values of the SMIB system with STSTCOM on the excitation system of the generator. The critical mode of interest is well damped with the real part of eigenvalue changing from 1.3831 to -4.1423, However there is a good improvement in the stability of the system with STATCOM-PSO compared to CSTATCOM.
Table 4.1: Bounds of Control Parameters
Bounds Kr Xsh
Lower 0.01 0.01
Upper 50 1.0
Table 4.2: PSO parameters Population size
Maximum generation Dimensions
Limit Runtime
64 100 2 20 10
Table 4.3: Optimal STATCOM Parameters Obtained From PSO
Kr Xsh
[image:4.612.340.568.92.319.2]1.40000 0.140000
Table 4.4: Eigen values of the system with CSTATCOM and PSOSTATCOM
Eigen values of the system with CSTATCOM
Eigen values of the
system with
PSOSTATCOM
-6.316358462458362 -10.333417748538750
+14.260602992687263i
-0.285647215467 +6.424865412994i
-10.333417748538750 -14.260602992687263i
-0.285647215467 +6.424865412994i -13.582165221524
0.025357871733690 +6.776195009965491i
-3.698563231218 +1.724545154541i
0.025357871733690 -6.776195009965491i
-3.698563231218 -1.724545154541i
-2.68776733940635 -3.565284846756
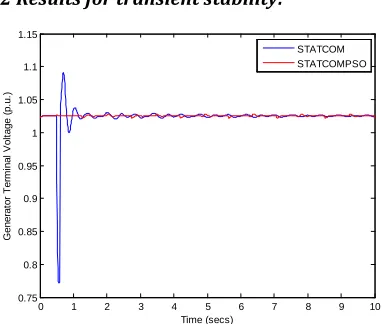
4.2 Results for transient stability:
0 1 2 3 4 5 6 7 8 9 10
0.75 0.8 0.85 0.9 0.95 1 1.05 1.1 1.15
Time (secs)
G
e
n
e
ra
to
r
T
e
rm
in
a
l
V
o
lt
a
g
e
(
p
.u
.)
[image:4.612.332.523.280.442.2]STATCOM STATCOMPSO
Figure 4.2: Variation in Terminal Voltage at 2nd Generator
with fault at 3rd Bus
0 1 2 3 4 5 6 7 8 9 10
2 4 6 8 10 12 14 16 18 20
Time (secs)
R
o
to
r
A
n
g
le
(
d
e
g
)
STATCOM STATCOMPSO
[image:4.612.41.273.356.491.2] [image:4.612.334.519.490.656.2] [image:4.612.41.286.605.724.2]© 2015, IRJET.NET-All Rights Reserved
Page 179
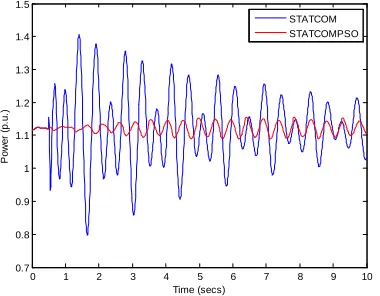
0 1 2 3 4 5 6 7 8 9 10
0.7 0.8 0.9 1 1.1 1.2 1.3 1.4 1.5
Time (secs)
P
o
w
e
r
(p
.u
.)
[image:5.612.48.238.104.252.2]STATCOM STATCOMPSO
Figure 4.5: Variation in torque at 3rd generator with fault at
3rd Bus
5.1 Tunning of PSO for Multi-Machine system:
3-machine systems to study the performance of STATCOM supplementary modulation controller with regard to the enhancement of damping of the low frequency swing mode. The generators are represented using detailed model 1.1 in all the systems. The results presented in this chapter concern the following objectives:
i) Development of transient stability program using the STATCOM model described in the preceding sections in the presence of large and heavy disturbances.
ii) Direct evaluation of transient stability is conducted with STATCOM using the Ant Colony optimization method, which is incorporated in the transient stability program. Two types of fault studies are considered:
a) Symmetrical fault b) Unsymmetrical fault
Both kinds of disturbances are cleared with line outage. Generalized MATLAB based programs have been developed using the models which have been described in the preceding sections. The programs have been implemented on Pentium(R) CPU system 3.40 GHz.
5.2 TRANSIENT STATBILITY:
From the results of the eigenvalue analysis, a STATCOM placed at bus #7 can improve the damping of both swing modes simultaneously. Hence, for the study of transient stability a STATCOM with its SMC is placed at bus #7. Figure 3.1 illustrates the variation of the rotor angles relative to Centre of Inertia with respect to time for a large disturbance. The disturbance considered is a 3-phase fault near bus #7 in the line connecting buses 7 and 8 occurring at 0.5 second, followed by clearing the fault at the end of 0.1 seconds with line outage considered. The limits chosen on the output of the SMC is 0.05p.u. The STATCOM with
its SMC parameters obtained from the small signal stability are considered for the transient stability evaluation. In addition to eigenvalue analysis, the performance of the supplementary modulation controllers is also evaluated by carrying out transient stability and STATCOM technique.
5.3 The Eigen Values of System:
Table: 5.1 Values of STATCOM with PSO parameters
Kr Xsh
Valu
e 4.55090000000000
4
0.02960000000000 0
Table: 5.2 Eigen values of the multi machine system Eigen values of
the system
Without STATCOM
Eigen values of the system with CSTATCOM
Eigen values of
the system
with
PSOSTATCOM
-46.374714778 699690 +43.74673180 1946716i
-9.85257268 8574890 +17.796477 803484706 i
-9.4453539291 14711
-46.374714778 699690
-43.746731801 946716i
-9.85257268 8574890 -17.7964778 03484706i
-24.672094973 5356
-9.2985254379 83557 +17.56367919 3384157i
-10.3697605 57402726 +13.238735 112328321 i
-10.339059059
1467 +
14.856478345 4579i
-9.2985254379 83557
-17.563679193 384157i
-10.3697605 57402726 -13.2387351 12328321i
-10.339059059
1467 –
14.856478345 4579i
-0.4953444879 41100 +13.13296272 1693765i
-11.2552755 11194872 +11.334088 324496678
-11.256740459
4501 +
[image:5.612.337.561.290.728.2]© 2015, IRJET.NET-All Rights Reserved
Page 180
i
-0.4953444879 41100
-13.132962721 693765i
-11.2552755 11194872 -11.3340883 24496678i
-11.256740459
4501 –
11.341366937 3125i
-10.412467926 385009 +13.27629005 5365273i
-0.48123582 5639200 +13.199797 150983658 i
-0.3640341248
801 +
13.161218277 9621i
-10.412467926 385009
-13.276290055 365273i
-0.48123582 5639200 -13.1997971 50983658i
-0.3640341248
801 -
13.161218277 9621i
-11.238742479 164834 +11.12612803 0582240i
-0.05553612 7222806 + 8.64497842 8797739i
-0.3409497288
118 +
9.1547985488 435i
-11.238742479 164834
-11.126128030 582240i
-0.05553612 7222806 - 8.64497842 8797739i
-0.3409497288
118 –
9.1547985488 435i
-0.0454365770 09432 +
8.5527917528 77999i
0.04310795 0673294 + 4.99853584 9420547i
-0.5010157987
570 +
8.9284079504 064i
-0.0454365770 09432
-8.5527917528 77999i
0.04310795 0673294 - 4.99853584 9420547i
-0.5010157987
570 -
8.9284079504 064i
0.0000000000 00001
-0.0000000000 00000
-3.5418845656 75317 +
4.3492591275 13447i
-3.5418845656 75317
-4.3492591275 13447i
-4.5175050080 49569
-4.35670577
1832423
-3.2608957055 787
-3.2524404097 78222
-3.24592599
6540990
-4.3683935895 053
-3.2258064516 12904
-3.22580645 1612904
-3.2258064516 129
5.4 Simulation Results:
From Figure 4.1, it can be observed that STATCOM with PSO helps in reducing the first swing stability and the settling time is also smaller. This is because the damping of mode #1 is higher in the case of STATCOM at bus #7 and its component decays faster as time progresses. Figures 4.2, 4.3, show the plot of second and third generator for STATCOM bus voltages and have been regulated well with PSO STATCOM.
© 2015, IRJET.NET-All Rights Reserved
Page 181
0 1 2 3 4 5 6 7 8 9 10
15 20 25 30 35 40
Time (secs)
R
ot
or
A
ng
le
(
de
g)
[image:7.612.337.537.103.247.2] [image:7.612.53.265.269.440.2]STATCOM STATCOMPSO
Figure 5.2: Variation in rotor angle of STATCOM using PSO with fault at 7th Bus
0 1 2 3 4 5 6 7 8 9 10
2 4 6 8 10 12 14 16 18 20
Time (secs)
R
o
to
r
A
n
g
le
(
d
e
g
)
STATCOM STATCOMPSO
Figure 5.3: Variation in rotor angle with fault at 7th Bus
0 1 2 3 4 5 6 7 8 9 10
0.85 0.9 0.95 1 1.05 1.1 1.15 1.2
Time (secs)
G
e
n
e
ra
to
r
T
e
rm
in
a
l
V
o
lt
a
g
e
(
p
.u
.)
STATCOM STATCOMPSO
Fig ure 5.4: Variation in terminal voltage at 1st generator with
fault at 7th Bus
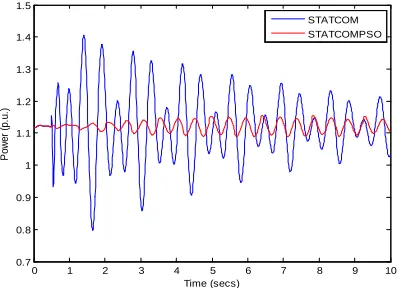
0 1 2 3 4 5 6 7 8 9 10
0.7 0.8 0.9 1 1.1 1.2 1.3 1.4 1.5
Time (secs)
P
o
w
e
r
(p
.u
.)
STATCOM STATCOMPSO
Figu re 5.8: Variation in power at 2nd generator with fault at 7th
Bus
5.5 CONCLUSION:
In this chapter, the application of a single STATCOM with its supplementary modulation controller to enhance the damping of the low frequency swing mode is presented with three machine systems. The control laws for the supplementary modulation controllers are taken from [23]. The control laws are simple and have control signals that can be synthesized using local signals. The controller parameters are tuned by solving a sequential linear programming problem.
The closed loop Eigen values indicate that the improvement achieved in the damping of the critical mode with just a single controller. The performance of the controllers is validated by nonlinear simulations. The STATCOM with PSO has been accurately incorporated into a STATCOM with detailed generator model, inclusive of AVR. Inclusion of STATCOM with PSO is a simple extension of the STATCOM for voltage-dependent loads and the inclusion of limits is also straight forward. The optimization technique is slowly settled along the post-fault trajectory. The results obtained from nonlinear simulation are perfectly reflected in the Particle Swarm Optimization method. STATCOM with PSO contributes significantly to improve the transient stability of the system.
5.6 Future Scope:
[image:7.612.44.255.465.613.2]© 2015, IRJET.NET-All Rights Reserved
Page 182
REFERENCES:[1] P.Kundur, Power System Stability and Control, McGraw-Hill Press 1994.
[2] K.R. Padiyar, Power System Dynamic-Stability and Control, BS Publications, Hyderabad, India, 2006.
[3] .Thorn, "Structural Stability and Morphogenesis", Benjamin-Addison Wesley, New York, 1975.
[4] I. Stewart, "Elementary Catastrophe Theory", IEEE Trans, on Circuits and Systems,Vol. CAS-30, pp. 578-586, August 1983.
[5] A.A. Fouad, "Application of Transient Energy functions to Practical Power System Problems", IEEE Special Publication on Rapid Analysis of Transient Stability, No.87 TH0169-3-PWR.
[6] V.R. Sastry, "Validity of Nelgecting Transfer Conductances in Transient StabilityStudies", Proc IEE, Vol. 120, No. 12, December 1973.]
[7] Understanding FACTS, “Concepts and technology of Flexible AC Transmission Systems” Narain G.Hingorani, Laszlo Gyugyi.
[8] Lazlo Gyugi,”Converter based facts controllers” , IEE colloquium on FACTS pages 1-11, Nov 23 1998.
[9] H.F. Wang and F.J. Swift, “A Unified Model for the Analysis of FACTS Devices in Damping Power System Oscillations Part 1: Single Machine Infinite bus Power Systems,” IEEE Trans. PWRD, Vol.12, No.2, 1997, pp.941-946.