http://dx.doi.org/10.4236/oje.2016.66035
How to cite this paper: Nooshabadi, S.J.Y., Jahansuz, M.R., Hosseini, N.M. and Peykani, G.R. (2016) Evaluation on Water Resources and Determining the Values of Exported and Imported Virtual Water in Hashtgerd Region. Open Journal of Ecol-ogy, 6, 366-376. http://dx.doi.org/10.4236/oje.2016.66035
Evaluation on Water Resources and
Determining the Values of Exported and
Imported Virtual Water in Hashtgerd Region
Seyed Jalal Yadollahi Nooshabadi, Mohammad Reza Jahansuz*,
Nasser Majnoun Hosseini, Gholam Reza Peykani
College Agriculture & Natural Resources, University of Tehran, Karaj, Iran
Received 16 January 2016; accepted 16 May 2016; published 19 May 2016
Copyright © 2016 by authors and Scientific Research Publishing Inc.
This work is licensed under the Creative Commons Attribution International License (CC BY). http://creativecommons.org/licenses/by/4.0/
Abstract
The concept of virtual water in recent years has been proposed with the world’s water resource consumption management approach. Hashtgerd study area is one of 609 study areas of the coun-try that is located entirely in Alborz Province. Average annual rainfall in this region was about 200 to 340 mm and the average agricultural production per year was more than one million tons and had more than 16 million cubic meters surplus recovery from underground water resources. The aim of this study is to evaluate resources and amounts of virtual water in the agricultural sector of the study area and its impact on the area water resources balance and ultimately provide solu-tions to reduce water consumption by the agricultural sector. The most important exported water products in Hashtgerd area in order of importance are peaches and nectarines (33% of water ex-ports), plums (15% of water exex-ports), vegetables (5.14 percent of water exex-ports), cherry (4.7% of water exports) and wheat (6.5 percent of water exports). Virtual water trade balance of agricul-tural and horticulagricul-tural products in the digital range is equal to 260+ million cubic meters. Density of agricultural lands can be mentioned as the main reasons for positive balance of virtual water trade in this area.
Keywords
Virtual Water, Agriculture, Consumption, Hashtgerd
1. Introduction
The concept of virtual water was presented for the first time by Tony Allen in 1993, as total consumed water to
produce a certain quantity of the product as commodity, agricultural products and/or services. Researchers with the introducing the results indicate that interior water resources of a country can supply its water needs or each country how much depends on water resources of exporting products countries [1] [2].
Many countries in arid and semi-arid regions have surplus recovery from renewable water resources to man-age food security and food self-sufficiency. Virtual water trade can reduce the crisis of water resources, pro-vided that the countries with water resources limitation have the ability to import food from countries with high water resources [3].
Hukstra and Hang (2002) stated that total water consumption inside a country was not alone proper criterion of its actual recovery of that country from global water resources. In fact, the volume of imported virtual water should be added to the total internal water consumption so that a true picture of the real needs of a country to global water resources to be drawn. And also, the volume of exported virtual water should be less than the vo-lume of internal water consumption. They introduced total net imports of virtual water and internal water con-sumption as water ecological footprint of a country, which was an indicator to determine the actual concon-sumption of water [1] [2] [4]. Iran has a very inhomogeneous distribution of water resources in the country. In this case, intra-countries virtual water trade between provinces and even townships by spending less can solve a major part of problems in the water distribution [5].
Water use efficiency of all agriculture and horticulture products in Alborz province is higher than national average and even more often higher than all provinces of the country. It is considered in this study that in addi-tion to clarificaaddi-tion capacities, policies and perspectives of soil and water of study area using virtual water con-cept and existing agricultural production statistics, water use in agriculture is to be analyzed widely [6].
The aim of this study is to evaluate resources and amounts of virtual water in the agricultural sector and its impact on water resources balance in the study area of Hashtgerd. In fact, the present study monitors consump-tion management and examines its impact on water resources.
2. Materials & Methods
Water national document data, the book of estimate of water requirements of major agricultural and horticultural plants written by Farshi and colleagues and food consumption capita statistics have been used for net irrigation water need of agricultural plants [3]. Therefore some tables have been prepared which have been calculated wa-ter consumption of different products and overall, compute wawa-ter consumption of entire agricultural sector, but the important point is that the obtained number must be consistent with the realities of the region’s water, so it is necessary that tables to be calibrated in such a way to establish micro and macro communications of agricultural sector in an appropriate and realistic way.
Regarding to the production of all agricultural, horticultural and livestock products in the study area in 2013- 2014 using the concept of water stored in the products calculation of total water consumption in agricultural sector has been studied separately. Also capacities savings and priority management have been identified. Fol-lowing considerations have been regarded to accomplish the calculations:
1) Almost all produced products in the area (Agriculture and horticulture) have been considered. 2) Virtual water trade with a positive sign means exports and with negative sign means imports.
3) In the case of agricultural and horticultural products that their capita consumption does not exist in a way of country have used FAO statistics and their related offices in Jahade Keshavarzi Ministry, and it has been con-sidered equal for all the years.
Great care has been taken to calculate required water and water consumption of agricultural products (which is very important). But comprehensive and accurate information in some cases has not been available because the lack of studies and data recording systems (such as lack of observational wells and groundwater resources quality monitoring system).
2.1. Under Study Area
Under study area of Hashtgerd has been located in the northern half of salt lake watershed, area of mountains and plains in this area are 579 and 6.591square kilometers (a total of 1170.6 square kilometers), respectively and maximum and minimum height of 4058 and 1133 meters, respectively [7].
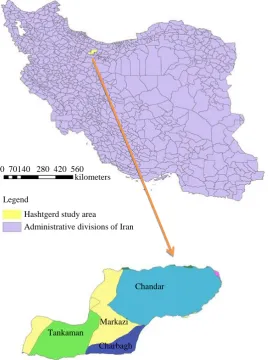
This under study area consists of parts of the two city of Savojbolagh (Alborz province garden pole) and Na-zar Abad (Region Agricultural pole) and more than 90% of agricultural lands of these city. In this study, the data related to these two city considered as Hashtgerd data for the under study area. From the most important of the sections in studied area can be referred to Chandar, Tankaman, Charbaghand Markazi (Figure 1).
Also, most important river in the studied area is the Kurdan river. Economic and political position in this re-gion because of Tehran Mega polis, and localization of a large number of industrial, service units, and major agricultural centers in the area, all lead to large force be pressured on the available water resources.
The total number of beneficiaries in the studied area which has been achieved from the beneficiaries of Naza-rabad (3800) and Savojbolagh (13,000) is about 16800 and share of the agricultural sector employed is 6.7% of the total area population (220 million people).
With an overview of the current status of agriculture in the region of Hashtgerd and compared with provincial and national statistics, will have been considered the following points:
1) Agricultural products’ performance often is more than provincial and national mean and according to Min-istry of Agriculture, record of national wheat production is 5/13 tons per hectare belongs to NazarAadi farmer.
2) Most of the cultivation and production of horticultural products of Alborz province is in this range. Interna-tional record of 70 tons per hectare is recorded by the Savojbolagh farmer.
[image:3.595.183.452.343.704.2]3) The per capita income of each exploiter in agricultural section is more than per capita mean income of each
Figure 1. The geographical coordinates of the study area of Hashtgerd. 0 70140 280 420 560
kilometers
Legend
Hashtgerd study area
Administrative divisions of Iran
Chandar
Markazi
exploiter in range of national section. The feature means production of products by high economic value inside and import of water consuming production by lower economic value is of populated and low water regions of world [8].
2.2. Computation of Water Consumption
Farshi and colleagues have calculated the amount of pure water of each agricultural and horticultural production for Karaj province by reduction of supplied water of rain from total pure water required to plant [3]. Calculation of amount of consumption water of each plant in the region Hashtgerd is done based on cropping patterns and use of multiplying cultivated of each plant by pure water need.
3. Results and Discussion
3.1. Surrounding Water Resources and Water Balance
Exploiter resources of groundwater in the research area contains 6661 wells with an annual discharge 98/318 million cubic meters, 204 spring bit with an annual discharge 65/5 million cubic meters and 18 aqueduct with an annual discharge 73/3 million cubic meters (Table 1).
Volume of water consumption in the study area equals to 363.06 million cubic meters a year which is 320.3 million cubic meters of groundwater (wells and aqueducts) and 42.76 million cubic meters of surface flows and spring that used respectively 330.81 million cubic meters (91%) in agriculture, 24.27 million cubic meters (7%) in consumption and 7.98 million cubic meters (2%) in industry (Table 2).
Balance, is balance between properties and harvesting and about water resources between input and output factors of water in a watershed, a study area or an aquifer in certain time. The balance results of groundwater in-clude volume belongs to each component of recharging and discharging aquifer and alluvial aquifer storage vo-lume change has presented in Table 3.
However, the amount of change in firm storages of surface and groundwater should be balanced between in-put and outin-put factors. Therefore the total outin-put factors of general balance of water in the study area Hashtgerd equals to 302.39 million cubic meters which is more compared to 16.02 million cubic meters of input factors, that the volume equals to reduction volume of alluvial aquifer of Hashtgerd plain, which the extra recovery of firm storage of alluvial aquifer is recovered from Hashtgerd plain.
3.2. Water Consuming of Agricultural Section of Major View
Of the most major cultivated agricultural productions in Hashtgerd area can be aligned respectively 29.4 percent, 24.7 percent and 21 percent to wheat, forage maize and barely and in horticultural productions 21.5 percent is to nectarines, 21.2 percent to peach and 10 percent to apple.
According to Tehran regional water company in the crop year 2013-2014, the amount of water consumption in agricultural section in the study area is about 331 million cubic meters (15.91%) of total 363 million cubic meters of consumed water. According to the present study total of consumption water in agricultural (without considering livestock products) section is about 339 million cubic meters. The deference of 8 million cubic me-ters is due to in the study two cities are considered Sovojbolagh and Nazarabad, while the study area has the less extensive
10 major water consumption products include respectively peach and nectarines, forage maize, wheat, barely, types of plums, cabbage and lettuce, alfalfa, apples, cherries and grapes which are more than 86% of water con-sumption of agricultural and horticultural.
Based on Water Resources Management Company report in Alborz, the most of groundwater withdrawals has been on Hashtgerd plain and the amount of 43.4% of total water withdrawal. The amount of 51.4 of total water withdrawal from groundwater resources is used for agricultural consumption, it should be noted that the plain is of banned plains.
3.3. Cultivated Area and the Levels of Agricultural Production
Table 1. Number and depletion of groundwater resources in the plains and heights (depletion numbers in million cubic me-ters).
Alluvial aquifer Total of area Heights Plain Source type
Discharge Number Discharge Number Discharge Number Discharge Number
84.306 3697 98.318 6661 93.3 1330 05.315 5331 Well
0 0 35.5 204 25.5 198 1.0 6 Fountain
0 1 73.3 18 95.0 1 78.2 17 Aqueduct
84.306 3698 06.328 6883 13.10 1529 9.317 5354 Sum
Table 2. Water consumption and its supplier resources for each plain and heights (million cubic meters).
Sum Surface flow and springs Groundwater sources (wells and aqueducts) Area
Agriculture Industry Drinking Agriculture Industry Drinking
31.337 41.21 0 0 17.186 43.7 3.22 Plain
75.25 31.20 01.0 03.1 92.2 54.0 94.0 Heights
47.313 64.6 0 0 64.280 06.7 14.19 Alluvial aquifer
06.363 72.41 01.0 03.1 09.289 97.7 24.23 Range
Table 3. Balance of groundwater alluvial aquifer.
Cha ng es in st or age vol u m e
Discharge Nutrition
T he ex ten t o f ra ng e o f ba la nce (s q km ) Na m e o f a quif er T o ta l dis cha rg e Underg ro und o ut put E vap or at ion of a quif er Dra ina g e Deplet io n o f wells a nd a queduct s a nd fo unt a ins T o ta l Nut rit io n Inf luence o f do m e st ic a nd indus tria l wa ter Inf luence o f a g ricult ura l wa te r Inf luence o f s ur fa ce current s inf luence o f the a quif er s ur fa ce ra inf a ll input g ro undwa te r fl o w
02.16 41.318 07.11 0 5.0 84.306 39.302 2.18 29.106 87.56 38.27 65.93 7.410 Hashtgerd
About 75 percent of the area under cultivated of agricultural crops in Alborz province (Table 4) is located in two cities Nazar Abad (53%) and Savojbolagh (22 percent). The reason of centralization of cultivation in these cities must be searched in quality and quantity of their water resources.
About 56 percent of the city’s gardens are located in Savojbolagh. Totally (figure), two cities of Nazar Abad (37%) and Savojbolagh (34%) constitute approximately 71 percent of the area under cultivated of agricultural crops. Nearly all of agricultural lands cultivated the study area as watery in the crop year of 2013-2014.
In the year, amount of agricultural products have been 1165213 tons and the overall amount of horticultural products have been 383,627 tons which is included irrigated and rainy products.
About 51 percent of area which covered by greenhouses in the province and 52% of greenhouse products in Hashtgerd the study area has been located in the province. Total of cultivated area of greenhouse products are about 219 hectares that if to be consider 8,000 cubic meters of water per hectare, about 1.7 million cubic meter water has been consumed in this section.
3.4. Water Consumptions in Agricultural and Horticultural Section
Table 4. The vast of cultivated area of Agricultural and horticultural land on segregated city in 2013.
Township Savojbolagh NazarAbad Total Province& Production in Province
Agricultural 10455 25363 35818 47905 75
Horticultural 14743 1844 16587 26023 64
Total 25198 27207 52405 73928 71
Source: Agricultural Jihad Alborz.
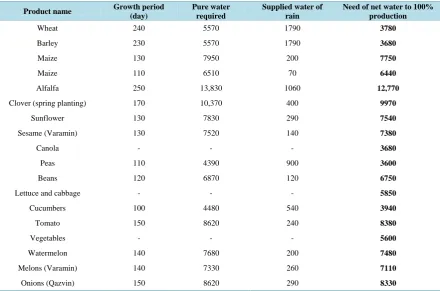
3.5. Need to Irrigation of Agricultural and Horticultural Products
The net consumption of irrigation water of horticultural and agricultural products has been given in Table 5 and
Table 6 respectively.
3.6. Water Consumption of Agricultural and Horticultural Products in the Province
Also required pure water levels in the study field and based on the pattern of cultivation of agricultural products and fertile horticultural products have been calculated and presented in Table 7. The under cultivation percen-tage level of various products in this calculation was effective, and in average for per hectare of agricultural plants under cultivation level 5378 cubic meters and per hectare of horticultural products under cultivation level 8856 cubic meters of water have been consumed (Table 8).
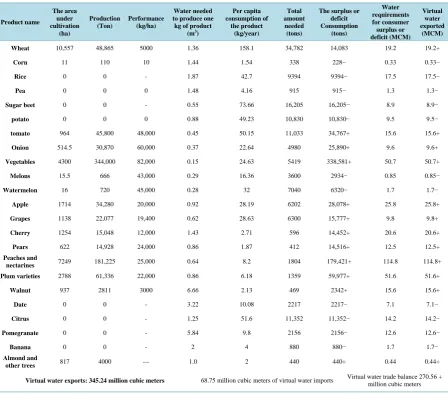
According to calculations in this study, the major provider of food needs of humans and livestock products (agricultural, fertile horticultural and greenhouse), have been consumed 339 million cubic meters of water in the region of Hashtgerd. Virtual water exports in agricultural and horticultural sector is 24.346 million cubic meters, virtual water import 68.75 million cubic meters of, and then virtual water trade balance of agricultural and hor-ticultural products in the range of digital is 56.270 million cubic meters.
Agricultural lands density range, high performance products compared to national average as well as the dis-trict proximity to the country capital that large amount of agricultural production in the region, especially vege-tables, cucurbits, and fruits are consumed in Tehran or in Karaj can be the main reasons for the positive balance of virtual water trade.
Calculations show that two townships of Savojbolagh and Nazarabad with about 64 percent of the horticultur-al lands and 75 percent of agriculturhorticultur-al lands in the province have the highest share of agriculturhorticultur-al consumption water of Alborz Province (Table 9). In such a way that about 40 percent of agricultural consumption water is consumed in this area. At least there is about 35 million cubic meters of low potential managed irrigation in the area study in Hashtgerd in 10 major products cultivation which are allocated 86% of consumption water of agricultural sector.
Virtual water exports in agricultural and horticultural sector in the study area in Hashtgerd is 24.346 million cubic meters that with respect to water consumption in greenhouse products gets to 348 million cubic meters. This water is mostly exported to Tehran and Karaj. Virtual water imports of this region is 75.68 million cubic meters and therefore virtual water trade balance of agricultural and horticultural products in the province in dig-ital is +260 million cubic meters, it means 260 million cubic meters of virtual water is exited annually by agri-cultural products exports.
The most important water exported products in Hashtgerd range in order of importance are peaches and nec-tarines (33 percent of water exports), plums (15 percent of water exports), vegetables (5.14 percent of water ex-ports), cherry (4.7 percent of water exports) and wheat (6.5 percent of water exports). The most water imported products of the range, in order of importance are rice (23 percent of virtual water imports) and citrus (19 percent of water import).
By 25 percent reduction in area under cultivation in peaches and nectarines or by 50 percent of the area under cultivation of these two products equipped with a drip irrigation system, about 16 million cubic meters of water will reduce consumption causing equilibrium in alluvial aquifer balance.
Table 5. Water required and irrigation water for crops (excluding performance) in the study area (cubic meters ha).
Need of net water to 100% production Supplied water of
rain Pure water required Growth period (day) Product name 3780 1790 5570 240 Wheat 3680 1790 5570 230 Barley 7750 200 7950 130 Maize 6440 70 6510 110 Maize 12,770 1060 13,830 250 Alfalfa 9970 400 10,370 170
Clover (spring planting)
7540 290 7830 130 Sunflower 7380 140 7520 130 Sesame (Varamin) 3680 - - - Canola 3600 900 4390 110 Peas 6750 120 6870 120 Beans 5850 - - -
Lettuce and cabbage
3940 540 4480 100 Cucumbers 8380 240 8620 150 Tomato 5600 - - - Vegetables 7480 200 7680 140 Watermelon 7110 260 7330 140 Melons (Varamin) 8330 290 8620 150 Onions (Qazvin)
Source: required water estimation of agricultural and horticulture major plants, Farshi and colleagues. The Country National Water document has been used for grapes, lettuce and cabbage and vegetables. In this study, the irrigation method in which the entire surface of garden gets wet has been considered to calculate the annual water requirement of horticultural product. It should be noted that the value for the initial irrigation (water-soil) has not been included in the calculation of irrigation requirements.
Table 6. Water requirements and the need for irrigation water of horticultural products (excluding performance) in the study area (cubic meters ha).
Need of net irrigation water* Need of net
irrigation water# Water supply of
rainfall Net water required Growth period (day) Product name 6850 8700 1000 9700 230 Peach 6850 8700 1000 9700 230 Apricots 6850 8700 1000 9700 230 Pears 5480 6960 1000 7760 230 Almonds 5480 6960 1000 7760 230 Berry 8240 10,460 840 11,300 230 Apple 8240 10,460 840 11,300 230 Cherry 8240 10,000 840 11,300 230 Walnut 5650 7170 900 8070 --- Grapes
#The methods of irrigation in which the entire surface of garden gets wet. *The methods of irrigation in which part of the garden gets wet. Source: Required water estimation of agricultural and horticulture major plants, Farshi and colleagues. The Country National Water document has been used for grapes, lettuce and cabbage and vegetables.
[image:7.595.89.538.467.632.2]Table 7. Net needs of Irrigation of agricultural and horticultural crops (million cubic meters per year).
Row
Agricultural products
row
*horticultural products
Product name
Area under cultivation
(ha)
Annual irrigation requirement
(M∙m∙m)
Product name
Area under cultivation
(ha)
Annual irrigation requirement (M∙m∙m)
1 Wheat 10,557 90.39 1 Apple 1714 09.17
2 Barley 7500 35.28 2 Pears 622 4.5
3 Forage maize 8383 98.53 3 Cherry 1254 1.13
4 Alfalfa 1862 77.23 4 Peaches and
nectarines 7249 63
5 Cabbage and
lettuce 4064 77.23 5 Walnut 937 3.9
6 tomato 964 07.8 6 Plum varieties 2788 2.4
7 Other vegetables 235 3.1 7 Grapes 1138 1.8
8 Maize 11 09.0 8 Almonds 306 1.2
9 Cucumbers 7.94 4.0 9 Cherry and
other trees 511 4
10 Peas 669 34.3 Total garden 3.146
11 Melons 15.5 11.0 Total net volume irrigation 4.337
12 An onion 5.514 29.4
13 Canola 100 37.0
14 Green beans 487 28.3
15 Watermelon 16 12.0
16 Other productions 0 0
Total crop 11.191
Source: research findings.
Table 8. Net irrigation requirement of fertile agricultural and horticultural products (cubic meters per hectare) to separation of the study area in the crop year 2013-2014.
Study area Products type
Agricultural Horticultural
Hashtgerd 5378
8856
Source: research findings.
Regarding to water consumption for the production of forage maize and alfalfa and comparison of water use efficiency of these two products (respectively 7.3 and 6.0 kilograms per cubic meter) and also due to importance of animal husbandry in the province, an increase of area under cultivation of forage maize in the province due to better performance and less water consumption has relative advantage and reduces forage imports and it seems reasonable. Due to the relative advantage of forage maize compared to alfalfa, regional farmers have increased area under cultivation of this products compared to alfalfa properly in current years.
4. Suggestions
1) It is recommended that methods such as increasing water productivity at the farm level which has been a priority of the relevant organs for years optimized and modified by combination of correction procedures culti-vation applying on culticulti-vation pattern based on virtual water consumption level in different situations, modify-ing consumption patterns in the community which has been emphasized on it in Arabic study by Yazdi and Nik ta [9], no increase in area under cultivation in the basin aquifers under water stress, optimizing the cultivation methods and using the concept of virtual water trade to control the export volume of water through this way.
[image:8.595.80.539.99.409.2]Table 9. Identification and analysis of water consumption and trade of agricultural and horticultural crops in 2012-2013 Al-borz Province (population: 220 thousand).
Product name
The area under cultivation
(ha)
Production (Ton)
Performance (kg/ha)
Water needed to produce one kg of product
(m3
)
Per capita consumption of
the product (kg/year)
Total amount needed (tons)
The surplus or deficit Consumption
(tons)
Water requirements for consumer surplus or deficit (MCM)
Virtual water exported
(MCM) Wheat 10,557 48,865 5000 1.36 158.1 34,782 14,083 19.2 19.2+
Corn 11 110 10 1.44 1.54 338 228− 0.33 0.33−
Rice 0 0 - 1.87 42.7 9394 9394− 17.5 17.5−
Pea 0 0 0 1.48 4.16 915 915− 1.3 1.3−
Sugar beet 0 0 - 0.55 73.66 16,205 16,205− 8.9 8.9−
potato 0 0 0 0.88 49.23 10,830 10,830− 9.5 9.5−
tomato 964 45,800 48,000 0.45 50.15 11,033 34,767+ 15.6 15.6+
Onion 514.5 30,870 60,000 0.37 22.64 4980 25,890+ 9.6 9.6+
Vegetables 4300 344,000 82,000 0.15 24.63 5419 338,581+ 50.7 50.7+
Melons 15.5 666 43,000 0.29 16.36 3600 2934− 0.85 0.85−
Watermelon 16 720 45,000 0.28 32 7040 6320− 1.7 1.7−
Apple 1714 34,280 20,000 0.92 28.19 6202 28,078+ 25.8 25.8+
Grapes 1138 22,077 19,400 0.62 28.63 6300 15,777+ 9.8 9.8+
Cherry 1254 15,048 12,000 1.43 2.71 596 14,452+ 20.6 20.6+
Pears 622 14,928 24,000 0.86 1.87 412 14,516+ 12.5 12.5+
Peaches and
nectarines 7249 181,225 25,000 0.64 8.2 1804 179,421+ 114.8 114.8+ Plum varieties 2788 61,336 22,000 0.86 6.18 1359 59,977+ 51.6 51.6+
Walnut 937 2811 3000 6.66 2.13 469 2342+ 15.6 15.6+
Date 0 0 - 3.22 10.08 2217 2217− 7.1 7.1−
Citrus 0 0 - 1.25 51.6 11,352 11,352− 14.2 14.2−
Pomegranate 0 0 - 5.84 9.8 2156 2156− 12.6 12.6−
Banana 0 0 - 2 4 880 880− 1.7 1.7−
Almond and
other trees 817 4000 --- 1.0 2 440 440+ 0.44 0.44+
Virtual water exports: 345.24 million cubic meters 68.75 million cubic meters of virtual water imports Virtual water trade balance 270.56 + million cubic meters
Source area under cultivation of production and performance: Jahade Keshavarzi Organization in Alborz Province. Capita consumption: food balance sheets of the Islamic Republic of Iran.
Required pure water for irrigation (cubic meters per hectare): National Water Document and the provincial syntheses and calibration by experts re-search Other columns: Rere-search Findings *—Numbers in the fourth column (related to the performance) in case of virtual water imports are the country performance mean and in the case of virtual water exports are the province performance.
study area, it is worthy that the livestock products and its role in water consumption and export of virtual water will be calculated in further studies.
3) Optimum cultivation pattern in Hashtgerd region based on the potential of water resources, region lands talent, farmer economic profit and the need and the consumer market of agricultural products is to be determined by mathematical programming methods. At this particular, Nematollahi et al. in Dashte Mashhad, Mohammadi and colleagues in Marvdasht, Fars and Akbari and Zahedi in Hamedan achieved good results [10] [11].
References
[1] Aldaya, M.M., Santos. P.M. and Llamas, M.R. (2010) Incorporating the Water Footprint and Virtual Water into Policy: Reflections from the Manta Occidental Region. Spain. Water Resource Management, 24, 941-958.
http://dx.doi.org/10.1007/s11269-009-9480-8
[3] Farshi, A.A., Shariati, M.R. and jarollahi, R. (1997) Estimates of Crop & Garden Plants Water Requirement. Agricul-tural Education Publishing, 20-25 & 690-699.
[4] Hoekstra (2008) Water Neutral: Reducing and Offsetting the Impacts of Water Footprints. Value of Water. Research Report Series No. 28, 42.
[5] Hoekstra, A.Y., Chapagain, A.K., Aldaya, M.M and Mekonnen, T.M. (2009) Water Footprint Manual. State of the Art, Web. 131. www.waterfootprint.org
[6] Hedari, N. (2011) Determination and Evaluation of Water Use Efficiency of Crops, Managed by Farmers. Journal of
Water Management and Irrigation, 2, 43-57. (In Farsi)
[7] Tehran Regional Water Company (2013) The Water Balance Report of Hashtgerd Study Area. www.albrw.ir/
[8] Alborz Province Agriculture of Jahad Organization (2015) The Final Report 2015.
[9] Web Pages and On-line Material: ArabiYazdi, A. and Nikta, N. (2012) Study of Virtual Watertradein South Khorasan Province and Its Impact on Aquifers. South Khorasan Regional Water Company. http://www.skhrw.ir/
[10] Mohammadi, H. and Bostani, F. (2011) Determine Optimal Crop Pattern by Algorithm Multi-Objective Optimization Fuzzy. Journal of Water and Wastewater, 4, 43-54.