http://dx.doi.org/10.4236/ojop.2016.52009
How to cite this paper: Al Malki, A., Rizk, M.M., El-Shorbagy, M.A. and Mousa, A.A. (2016) Hybrid Genetic Algorithm with K-Means for Clustering Problems. Open Journal of Optimization, 5, 71-83. http://dx.doi.org/10.4236/ojop.2016.52009
Hybrid Genetic Algorithm with K-Means for
Clustering Problems
Ahamed Al Malki1, Mohamed M. Rizk1,2, M. A. El-Shorbagy3, A. A. Mousa1,3* 1Department of Mathematics and Statistic, Faculty of Science, Taif University, Taif, Saudi Arabia 2Department of Mathematics, Faculty of Science, Menoufia University, Al Minufya, Egypt
3Department of Basic engineering sciences, Faculty of Engineering, Menoufia University, Al Minufya, Egypt
Received 21 May 2016; accepted 17 June 2016; published 21 June 2016
Copyright © 2016 by authors and Scientific Research Publishing Inc.
This work is licensed under the Creative Commons Attribution International License (CC BY).
http://creativecommons.org/licenses/by/4.0/
Abstract
The K-means method is one of the most widely used clustering methods and has been implemented in many fields of science and technology. One of the major problems of the k-means algorithm is that it may produce empty clusters depending on initial center vectors. Genetic Algorithms (GAs) are adaptive heuristic search algorithm based on the evolutionary principles of natural selection and genetics. This paper presents a hybrid version of the k-means algorithm with GAs that efficiently eliminates this empty cluster problem. Results of simulation experiments using several data sets prove our claim.
Keywords
Cluster Analysis, Genetic Algorithm, K-Means
1. Introduction
Genetic Algorithms (GAs) were introduced by Holland [1] and further described by Goldberg [2] as optimiza-tion approaches to find a global or near-global optimal soluoptimiza-tion. GAs are randomized heuristic search algorithm based on the evolutionary principles of natural selection and genetics. GAs represent smart exploitation of the random search which used for solving optimization problems. GAs are designed to simulate processes in natural systems necessary for evolution (i.e. it follows the principles first laid down by Charles Darwin of “survival of the fittest”) [3]-[8]. GA starts with a set of potential solutions (chromosomes). Next, genetic operators (selection, mutation and crossover) are applied one after another to obtain a new generation of chromosomes. This process is repeated until the termination criterion is met. In addition, GA uses only a simple scalar performance measure,
so it is easy to use and implement [9]. Data mining techniques comprise three components model, preference criterion and search algorithm. The most common functions in data mining techniques are association rule min-ing, classification, clustermin-ing, regression, sequence, link analysis and dependency modelling. The flexibility of the model for representing the underlying data and the interpretability of the model in human terms is deter-mined by Model representation. This includes decision trees and rules, linear and nonlinear models, probabilistic graphical dependency models, relational attribute models and example-based techniques such as the NN-rule and case-based reasoning [10]. The preference criterion is used for determining which model to use for mining, depending on the underlying dataset, by associating some measure of goodness with the model functions. It tries to generating a model function with a large number of degrees of freedom (i.e. avoid over-fitting of the underly-ing data). After selectunderly-ing the model and the preference criterion, specification of the search algorithm is defined. Descriptive and predictive are two mainly kinds of data mining tasks. The descriptive techniques provide a summary of the data, while the predictive techniques learn from the current data to make predictions about the behaviour of new datasets. One of the popular descriptive data mining techniques is Clustering; where it is used for partitioning an input dataset into a number of clusters. Clustering or grouping is an exploratory procedure that searches for “natural” structure within a data set. This process involves sorting the data cases or objects, into groups or clusters, so that objects in the same cluster are more like one another than they are like objects in other clusters. Sorting occurs in the basis of similarities calculated from the data. Clustering is useful for data reduction, developing classification schemes, and suggestion or supporting hypotheses about the structure of the data [11].
2. Clustering
Clustering techniques have been used in a wide range of disciplines such as: A novel approach of cluster based optimal ranking of clicked URLs using genetic algorithm for effective personalized web search [12], Optimal clustering of microgrids based on droop controller for improving reliability using a hybrid of harmony search and GAs [13], Cluster analysis using optimization algorithms with newly designed objective functions [14], and GA optimization of defect clusters in crystalline materials [15].
The most popular clustering tool used in scientific and industrial applications is The K-means clustering algo-rithm [16]-[20]. It proceeds as follows: Firstly, K objects are randomly selected; where each of which initially represents a cluster mean or center. Secondly, for each of the remaining objects, based on the distance between the object and the center, an object is assigned to the cluster to which it is the most similar. Finally, the new center for each cluster is computed and the process iterates until the criterion function converges. Typically, the squared-error criterion is used.
K-means works well when the clusters are compact clouds that are rather well separated from one another by adopting the squared-error criterion. On the other hand, when clusters have widely different sizes, densities, or non-spherical shapes it has difficulty detecting the natural clusters [21]. It will divide the objects in one cluster into two or more clusters to attempt to minimize the square-error criterion. In addition to that, the optimal cluster corresponds to the extremum when applying this criterion to evaluate the clustering results. Moreover, the algo-rithm will terminate at local optimum if the results of initialization are exactly near the local minimal point. So, this paper intends to present hybrid GA with K-means cluster algorithm that efficiently eliminates this draw-backs of K-means.
The rest of this paper is organized as follows: Previous work in clustering is presented in Section 2. GA is de- scribed in Section 3. Hybrid genetic algorithm with k-means is introduced in Section 4. The experimental results are discussed in Section 5. Finally, we conclude the paper in Section 6.
Clustering [22]-[26] is an important unsupervised classification technique where a set of patterns are grouped into clusters in such a way that patterns in the same cluster are similar in some sense and patterns in different clusters are dissimilar in the same sense. Clustering in Rd (d-dimensional Euclidean) space is the process of partitioning a given set of n points into a number, say K, of clusters
{
C C1, 2,,CK}
based on somesimilari-ty/dissimilarity metric. The value of K may or may not be known a priori. The main objective of any clustering technique is to produce a K×n partition matrix U X
( )
of the given dataset X consisting of n patterns,{
1, 2, , n}
X = x x x . The partition matrix may be represented as U= ukj , k=1,,K&j=1,,n; where ukj is the membership of pattern xj to cluster CK. In the case of hard or crisp partitioning,
1 if . 0 if j k kj j k x C u x C ∈ = ∉
In the following, some popular distance measures are described; which are used to characterize the clusters.
2.1. Distance Measure
A distance measure is used to compute the amount of dissimilarity between two data points. The choice of dis-tance function plays an important role in cluster analysis. Suppose the given dataset X contains n points, i.e.,
{
1, 2, , n}
X = x x x . If d is the dimension of the data, then x iij, =1,, ,n j=1,, ,d denotes the value of the i-th point in the j-thdimension. The distance between two data points xi and xj is denoted by D x x
(
i, j)
and should be satisfying the following properties:1) D x x
(
i, j)
≥0 for all x xi, j∈X , and D x x(
i, j)
=0 only if i = j.2) D x x
(
i, j) (
=D x xj, i)
for all x xi, j∈X ; and3) D x x
(
i, j)
≤D x x(
i, l)
+D x x(
l, j)
for all x x xi, j, l∈X.Two widely used distance measures, Euclidean distance and correlation-based distance [11], are defined as fol-lows.
2.1.1. Euclidean Distance Measure
The Euclidean distance D x x
(
i, j)
between two feature vectors xi and xj is computed as(
)
(
)
21
, .
d
i j ij jl
i
D x x x x
=
=
∑
− (2)2.1.2. Pearson Correlation-Based Distance Measure
The Pearson correlation coefficient Cor x x
(
i, j)
between two feature vectors xi and xj is computed as:(
)
(
)
(
)
(
)
(
)
1 2 2 1 1 , ; dil xi jl xj
l
i j
d d
il xi jl xj
l l
x x
Cor x x
x x µ µ µ µ = = = − − = − −
∑
∑
∑
(3)where µxi and µxj represent the arithmetic means of the components of the feature vectors xi and xj, re-spectively. The Pearson correlation coefficient is a measure of similarity between two points in the feature space. The distance between two points xi and xj is computed as D x x
(
i, j)
= −1 Cor x x(
i, j)
, which represents the dissimilarity between those two points.Clustering methods can be broadly classified into hierarchical, partitional and density-based. In the following, some basic clustering techniques from each category are described.
2.2. Hierarchical Clustering
In hierarchical clustering, the clusters are generated in a hierarchy, where every level of the hierarchy provides a particular clustering of the data, ranging from a single cluster to n clusters. For generating hierarchical clustering, there are two basic approaches either agglomerative or divisive.
Agglomerative: start with singleton clusters, and merge the two least distant clusters at each step, and hence the number of clusters reduces by 1. This proceeds iteratively in a hierarchy, providing a possible partitioning of the data at every level. The algorithm is terminated when the target number of clusters K is achieved. Single, average and complete linkage agglomerative algorithms differ only in the linkage metric used. The distance
(
i, j)
D x x between two clusters Ci and Cj for the three linkage algorithms are defined as follows: For single linkage,
(
,)
min,{
(
,)
}
i j
i j
x C y C
D x x D x y
∈ ∈
= (4)
For average linkage,
(
)
{
( )
}
, 1 , , i j i jx C y C
i j
D x x D x y
C C ∈ ∈
For complete linkage,
(
)
{
(
)
}
,
, max , ;
i j
i j
x C y C
D x x D x y
∈ ∈
= (6)
where D x y
(
,)
denotes the distance between the data points x and y, and Ci denotes the number points in cluster Ci.Divisive clustering just follows the reverse process, i.e., it starts from a single cluster containing all the points. At each step, the biggest cluster is divided into two clusters until the target number of clusters is achieved.
One of the main advantages of hierarchical clustering is that it offers flexibility regarding the levels of granu-larity and it can adopt any kind of distance metric easily. While the drawbacks of this clustering technique are its inability to improve already constructed clusters and the problem of choosing suitable stopping criteria.
2.3. Partitional Clustering
The partitional clustering algorithms obtain a single clustering solution for a dataset instead of a hierarchical clu- stering structure. Partitional methods are more computationally efficient compared to hierarchical techniques. K-means [26] and its fuzzy version [27] are the two partitional clustering algorithms that are widely used. K-means clustering is described in following subsection.
K-Means Clustering
The K-means clustering algorithm consists of the following steps:
1) K initial cluster centers z z1, 2,,zK are chosen randomly from the n points
{
x x1, 2,,xn}
.2) Assign point x ii, =1, 2,,n to cluster Cj,j∈
{
1, 2,,K}
, iff(
j, i) (
p, i)
, 1, 2, , & .D z x <D z x p= k j≠ p (7)
3) New cluster centers * * 1, , K
z z are computed as follows:
* 1
, 1, 2, , ;
j i
i j
x C i
z x i K
n ∈
=
∑
= (8)where ni is the number of elements belonging to cluster Ci. 4) If * , 1, 2, ,
i i
z =z i= K then terminate. Otherwise continue from Step 2.
K-means algorithm may converge to values that are not optimal [28]. Also, for large problems global solu-tions cannot be found with a reasonable amount of computation effort [29].
2.4. Density-Based Clustering
In density-based clustering methods, clusters are considered as zones in the data set space, where the points are densely situated, and which are separated by regions of low point density (noise). These zones may have arbi-trary shapes and the interior points may be arbitrarily distributed.
Density-based spatial clustering of applications with noise D-BSCAN [30] is a popularly used density-based clustering method, where a cluster is defined using the notion of density-reachability. A point y is said to be di-rectly density-reachable from another point x if it is within a given distance ε (i.e., y is a part of x’s ε-neighbor- hood), and if x is surrounded by sufficiently many points in its ε-neighborhood such that x and y may be consi-dered as a part of a cluster. Again, y is called indirectly density-reachable from x if there is a sequence of points
1, 2, , p
point and the minimum number of points required to form a cluster).
3. Genetic Algorithm (GA)
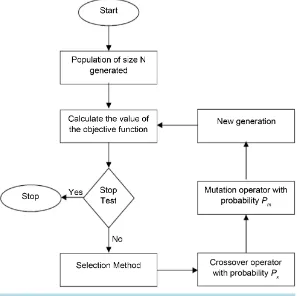
GAs were introduced by Holland [1] and further described by Goldberg [2] as optimization approaches to find a global or near-global optimal solution. GA starts with a set of potential solutions (chromosomes). Next, genetic operators (selection, mutation and crossover) are applied one after another to obtain a new generation of chro-mosomes. This process is repeated until the termination criterion is met. Algorithmically, the basic steps of GAs are outlined as below [3]-[7]:
Step I [Start]: random population of chromosomes is generated, that is, suitable solutions for the problem.
Step II [Fitness]: the fitness of each chromosome in the population is evaluated.
Step III [New population]: a new population is created by repeating the following steps:
1) Selection: Select two parents (chromosomes) from a population according to their fitness value. The chance for each chromosome to be selected, as a parent, is determined according to its fitness.
2) Crossover: According to the crossover probability (Pc), new offspring (children) is generated from parents. 3) Mutation: According to mutation probability (Pm), new offspring at each locus (position in chromosome) is mutated.
4) Accepting: new offspring is placed in the new population.
Step IV [Replace]: Use new generated population for a further run of the algorithm.
Step V [Test]: If the end condition is satisfied, return the best solution in current population and stop.
Step VI [Loop]: Go to step II.
The Flowchart of Simple GAs is shown in Figure 1.
4. Hybrid Genetic Algorithm with K-Means for Clustering Problems
[image:5.595.166.463.417.713.2]The K-means cluster algorithm is one of the most widely used clustering algorithms and has been applied in many fields of science and technology. The major problems of the K-means algorithm are that:
• It may produce empty clusters depending on initial centre vectors. • May converge to values that are not optimal.
• For large problems global solutions cannot be found with a reasonable amount of computation effort. This paper presents hybrid genetic algorithm with K-means cluster algorithm that efficiently eliminates this drawbacks.
4.1. Phase I: K-Means Algorithm
Step 1: K initial cluster centres z z1, 2,,zK are chosen randomly from the n observations
{
x x1, 2,,xn}
.Step 2: A point x i1, =1, 2,,n is assigned to cluster Cj,j∈
{
1, 2,,k}
iff, 1, 2, , &
i j i p
x −z < x −z p= K j≠ p (9)
Step 3: New cluster centres z z1, 2,,zK are computed as follows:
* 1
, 1, 2, , ;
i j
j i
x C i
z x i K
n ∈
=
∑
= (10)where ni is the number of elements belonging to cluster Cj. Step 4: If * , 1, 2, ,
i i
z =z i= K then terminate, otherwise continue from step 2. After this phase we get an initial centre for all predetermined clusters.
4.2. Phase II: Genetic algorithm
Step 1: Population initialization
Each individual represent a row-matrix 1×n where n is the number of observation, each gene contain integ-er
[ ]
1,K which represent the cluster which this observation belongs to it. E.g., let there is ten observation{
x x1, 2,,x10}
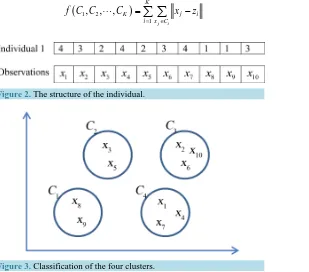
which must be assigned to four cluster k=4. Figure 2 shows the structure of the individual. Also Figure 3 represents the four clusters classification.Step 2: Evaluation
Evaluate the desired objective function; where the task is to searching for appropriate cluster classifications such that the fitness function is minimized. The clustering fitness function for the K clusters C C1, 2,,CK is given by
(
1 2)
1
, , ,
j i
K
K j i
i x C
f C C C x z
= ∈
=
∑ ∑
− [image:6.595.182.491.451.723.2] (11)
Figure 2. The structure of the individual.
Step 3: Selection
The aim of selection is to direct GA search towards promising regions in the search space. We employ rou-lette wheel selection in this study; where the individuals on each generation are selected for survival into the next generation according to a probability value. The probability of variable selection is proportional to its fit-ness value in the population, according to the formula below:
( )
{
( )
( )
Min( )
( )
}
Min;
x
f x f
p x
f x f
ψ
ψ ψ
∈
− =
−
∑
(12)where p x
( )
, selection probability of a string x in a population ψ and( )
{
( )
}
Min Min | .
f ψ = f x x∈ψ (13)
Step 4: crossover operator
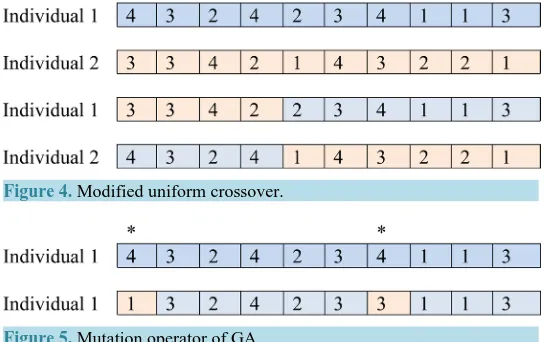
In this step, we present a modified uniform crossover as shown in Figure 4, where the crossover is done on each individual, in such a way that offspring is constructed by choosing the individual with a probability Pc.
Step 5: mutation operator
For each individual, mutation operator is implemented as follows, first select two columns randomly from ith individual and then generate two new columns as shown in Figure 5.
Step 6: Keep the best solutions of the existing population; where GA keeps the best solutions found so far
during the process.
4.3. Implementation Results
The experimental results for the proposed algorithm are provided for 4 problems containing artificial data set (problem 1, problem 2, problem 3, and problem 4) which described as follows:
4.3.1. Problem 1
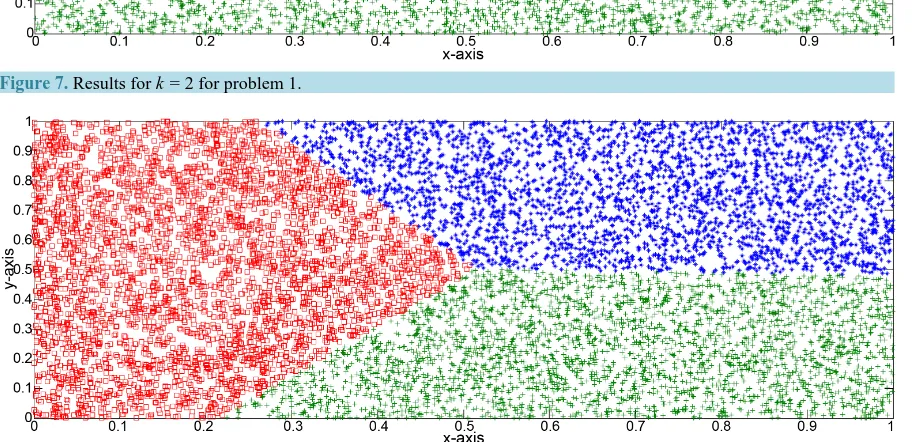
This problem containing a no overlapping data which has two attribute (two-dimensional data), where the num-ber of cluster is varied from two to five
{
k=2,k=3,k=4,k=5}
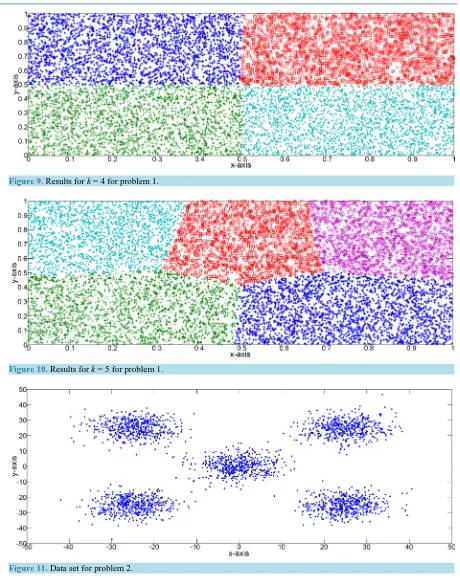
, it has 1000 points as shown in Figure 6. Figures 7-10 show the results for k=2,k=3,k=4,k=5.4.3.2. Problem 2
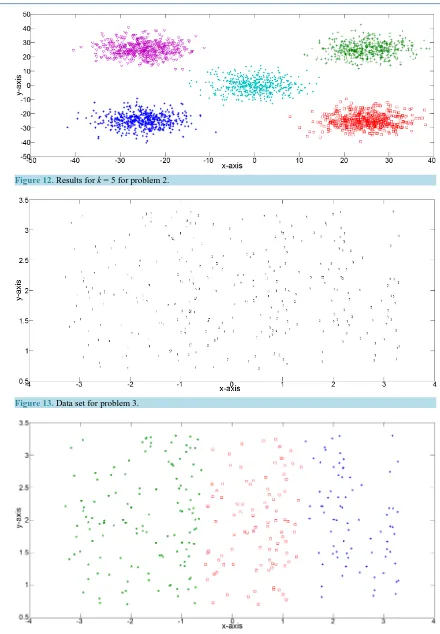
This problem containing a no overlapping, data which has two attribute (two-dimensional data), where the num- ber of clusters is five
(
k=5)
. Figure 11 shows the data set for problem 2 while, Figure 12 shows the results for k=5.4.3.3. Problem 3
[image:7.595.177.449.547.718.2]This problem containing a no overlapping, data which has two attribute (two-dimensional data), where the num- ber of cluster is three
(
k=3)
. It has 300 data points. The ranges for the three classes are as follows:Figure 4. Modified uniform crossover.
Figure 6. Data set for problem 1.
[image:8.595.77.542.94.341.2]Figure 7. Results for k = 2 for problem 1.
Figure 8. Results for k = 3 for problem 1.
[
] [
]
[
]
[
]
[
]
[
]
Class 1: 3.3, 0.7 0.7, 3.3 ,Class 2: 1.3, 1.3 0.7, 3.3 ,
Class 3: 0.7, 3.3 0.7, 3.3 .
[image:8.595.89.545.417.638.2]Figure 9. Results for k = 4 for problem 1.
Figure 10. Results for k = 5 for problem 1.
Figure 11. Data set for problem 2.
Figure 13 shows the data set for problem 3 while, Figure 14 shows the results for k=3.
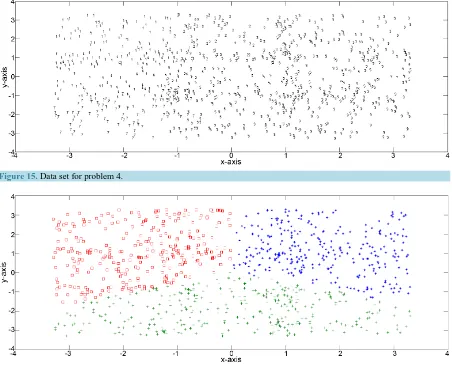
4.3.4. Problem 4
Figure 12. Results for k = 5 for problem 2.
Figure 13. Data set for problem 3.
assumed to have equal a priori probabilities. The ranges for the nine classes [31] are as follows:
[
] [
]
[
]
[
]
[
]
[
]
[
] [
]
[
]
[
]
[
]
[
]
[
]
Class 1: 3.3, 0.7 0.7, 3.3 ,
Class 2: 1.3, 1.3 0.7, 3.3 ,
Class 3: 0.7, 3.3 0.7, 3.3 ,
Class 4: 3.3, 0.7 1.3, 1.3 ,
Class 5: 1.3, 1.3 1.3, 1.3 ,
Class 6: 0.7, 3.3 1.3, 1.3 ,
Class 7: 3.3, 0.7
− −
−
− − −
− −
−
− −
[
]
[
]
[
]
[
]
[
]
3.3, 0.7 ,Class 8: 1.3, 1.3 3.3, 0.7 ,
Class 9: 0.7, 3.3 3.3, 0.7 .
− −
− − −
− −
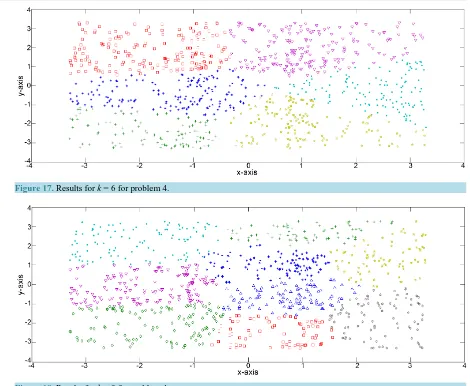
[image:11.595.243.394.102.253.2] [image:11.595.88.540.339.707.2]Thus the domain for the triangular distribution for each class and for each axis is 2.6. The data set is shown in Figure 15, while Figures 16-18 show the results for k=3,k=6,k=9.
5. Conclusion
This paper proposes a hybrid version of the well-known K-means clustering algorithm with GA. The modified
Figure 15. Data set for problem 4.
Figure 17. Results for k = 6for problem 4.
Figure 18. Results for k = 9 for problem 4.
algorithm maintains all important characteristic features of the basic K-means and at the same time eliminates the possibility of generation of empty clusters. Experimental results show that the proposed clustering algorithm is able to solve the clustering problem. Results of simulation experiments using several data sets prove our claim.
References
[1] Holland, J.H. (1975) Adaptation in Natural and Artificial Systems. University of Michigan Press, Ann Arbor.
[2] Goldberg, D.E. (1989) Genetic Algorithms in Search, Optimization and Machine Learning. Addison Wesley Publish-ing Company, Boston.
[3] Deb, K. (1999) An Introduction to Genetic Algorithms. Sadhana, 24, 293-315. http://dx.doi.org/10.1007/BF02823145
[4] Michalewicz, Z. (1996) Genetic Algorithms + Data Structures = Evolution Programs. 3rd Edition, Springer-Verlag, USA. http://dx.doi.org/10.1007/978-3-662-03315-9
[5] EL-Sawy, A.A., Hussein, M.A., Zaki, E.M. and Mousa, A.A. (2014) An Introduction to Genetic Algorithms: A Survey A Practical Issues. International Journal of Scientific & Engineering Research, 5, 252-262.
[6] Osman, M.S., Abo-Sinna, M A. and Mousa, A.A. (2006) IT-CEMOP: An Iterative Co-Evolutionary Algorithm for Multiobjective Optimization Problem with Nonlinear Constraints. Journal of Applied Mathematics & Computation,
183, 373-389. http://dx.doi.org/10.1016/j.amc.2006.05.095
[7] Abd El-Wahed, W.F., Mousa, A.A. and El-Shorbagy, M.A. (2011) Integrating Particle Swarm Optimization with Ge-netic Algorithms for Solving Nonlinear Optimization Problems. Journal of Computational and Applied Mathematics,
[8] El-Shorbagy, M.A., Mousa, A.A. and Nasr, S.M. (2016) A Chaos-Based Evolutionary Algorithm for General Nonli-near Programming Problems, Chaos, Solitons and Fractals, 85, 8-21. http://dx.doi.org/10.1016/j.chaos.2016.01.007
[9] Mousa, A.A., El-Shorbagy, M.A. and Abd El-Wahed, W.F. (2012) Local Search Based Hybrid Particle Swarm Opti-mization for Multiobjective OptiOpti-mization. Swarm and Evolutionary Computation, 3, 1-14.
[10] Fayyad, U.M., Piatetsky-Shapiro, G. and Smyth, P. and Uthurusamy, R. (1996) Advances in Knowledge Discovery and Data Mining. MIT Press, Menlo Park.
[11] Han, J. and Kamber, M. (2000) Data Mining: Concepts and Techniques. Morgan Kaufmann, San Francisco.
[12] Chawla, S. (2016) A Novel Approach of Cluster Based Optimal Ranking of Clicked URLs Using Genetic Algorithm for Effective Personalized Web Search. Applied Soft Computing, 46, 90-103.
http://dx.doi.org/10.1016/j.asoc.2016.04.042
[13] Abedini, M., Moradi, M.H. and Hosseinian, S.M. (2016) Optimal Clustering of MGs Based on Droop Controller for Improving Reliability Using a Hybrid of Harmony Search and Genetic Algorithms. ISA Transactions, 61, 119-128.
http://dx.doi.org/10.1016/j.isatra.2015.12.012
[14] Binu, D. (2015) Cluster Analysis Using Optimization Algorithms with Newly Designed Objective Functions. Expert
Systems with Applications, 42, 5848-5859. http://dx.doi.org/10.1016/j.eswa.2015.03.031
[15] Kaczmarowski, A., Yang, S., Szlufarska, I. and Morgan, D. (2015) Genetic Algorithm Optimization of Defect Clusters in Crystalline Materials. Computational Materials Science, 98, 234-244.
http://dx.doi.org/10.1016/j.commatsci.2014.10.062
[16] Forgy, E.W. (1965) Cluster Analysis of Multivariate Data: Efficiency vs Interpretability of Classifications. Biometrics,
21, 768-780.
[17] McQueen, J. (1967) Some Methods for Classification and Analysis of Multivariate Observations. Computer and Che-mistry, 4, 257-272.
[18] Rahman, M.A. and Islam, M.Z. (2014) A Hybrid Clustering Technique Combining a Novel Genetic Algorithm with K-Means. Knowledge-Based Systems, 71, 345-365. http://dx.doi.org/10.1016/j.knosys.2014.08.011
[19] Farag, M.A., El-Shorbagy, M.A., El-Desoky, I.M., El-Sawy, A.A. and Mousa, A.A. (2015) Genetic Algorithm Based on K-Means-Clustering Technique for Multi-Objective Resource Allocation Problems. British Journal of Applied
Science & Technology, 8, 80-96. http://dx.doi.org/10.9734/BJAST/2015/16570
[20] Farag, M.A., El-Shorbagy, M.A., El-Desoky, I.M., El-Sawy, A.A. and Mousa, A.A. (2015) Binary-Real Coded Genetic Algorithm Based K-Means Clustering for Unit Commitment Problem. Applied Mathematics, 6, 1873-1890.
http://dx.doi.org/10.4236/am.2015.611165
[21] Jiang, S.-Y. and Xu, Y.-M. (2004) An Efficient Clustering Algorithm. International Conference on Machine Learning
and Cybernetics, 3, 1513-1518.
[22] Anderberg, M.R. (1973) Cluster Analysis for Application. Academic Press, New York.
[23] Devijver, P.A. and Kittler, J. (1982) Pattern Recognition: A Statistical Approach. Prentice-Hall, London.
[24] Hartigan, J.A. (1975) Clustering Algorithms, Wiley
[25] Jain, A.K. and Dubes, R.C. (1988) Algorithms for Clustering Data. Prentice-Hall, Englewood Cliffs.
[26] Tou, J.T. and Gonzalez, R.C. (1974) Pattern Recognition Principles. Addison-Wesley, Reading.
[27] Bezdek, J.C. (1981) Pattern Recognition with Fuzzy Objective Function Algorithms. Plenum, New York.
http://dx.doi.org/10.1007/978-1-4757-0450-1
[28] Selim, S.Z. and Ismail, M.A. (1984) K-Means Type Algorithms: A Generalized Convergence Theorem and Characte-rization of Local Optimality. IEEE Transactions on Pattern Analysis and Machine Intelligence, 6, 81-87.
http://dx.doi.org/10.1109/TPAMI.1984.4767478
[29] Spath, H. (1989) Cluster Analysis Algorithms. Ellis Horwood, Chichester.
[30] Ester, M., Kriegel, H.-P., Sander, J. and Xu, X. (1996) A Density-Based Algorithm for Discovering Clusters in Large Spatial Databases with Noise. 2nd International Conference on Knowledge Discovery and Data Mining, Portland, OR, August 1996, 226-231.