http://dx.doi.org/10.4236/mme.2013.34027
Optical Microstructure Design Optimization for
Display Backlighting
Chi-Chang Hsieh1, Yan-Huei Li2
1Department of Mechanical and Automation Engineering, National Kaohsiung
First University of Science and Technology, Taiwan
2Instiute of Engineering Science and Technology, National Kaohsiung
First University of Science and Technology, Taiwan Email: [email protected], [email protected]
Received September 6,2013; revised October 22, 2013; accepted November 8, 2013
Copyright © 2013 Chi-Chang Hsieh, Yan-Huei Li. This is an open access article distributed under the Creative Commons Attribution License, which permits unrestricted use, distribution, and reproduction in any medium, provided the original work is properly cited.
ABSTRACT
This study proposes an innovative design method for functional optical film microstructures used in displays and ap-plies this design to LCD backlighting to replace multi-layer optical film functional integration with composite optical film. We design a novel optical film microstructure based on light uniformity and wide-angle lumination distribution and determine the optimal optical microstructure parameters by combining the global optimization of a genetic algo-rithm with ray tracing. The purpose of this study is to develop substitutes for traditional multi-layer prism brightness enhancers and light-diffusing film stacks and to examine the structural changes during calculations and summarize the characteristics. In this study, we focus on determining the optimal light uniformity of new optical film microstructures. The seven-inch LED backlight module of the method proposed in this study achieved 94.59% uniformity and 168˚ lu-mination distribution while reducing thickness by 66% to 82% compared to a traditional multi-layer optical film stack.
Keywords: Optical Film; Microstructure; Display; Backlight
1. Introduction
In recent years, green energy-saving and ultra-thin dis- plays have become the demand for the mainstream mar- ket. Therefore, backlight modules with extremely high cost and assembling ratios have become fiercely con- tested items among major manufacturers because of the technological innovation requirements. Multiple optical films with various effects are stacked in layers in back- light modules to focus the light energy and equalize the light distribution. However, this increases the cumulative thickness and overall cost of backlight modules. Cur- rently, backlight modules for displays typically comprise brightness enhancing films with prismatic structures to enhance luminance in the normal direction. However, this approach is likely to cause significant declines in lu- minance at minor angles away from the normal direction. Therefore, diffusion films are commonly added to reduce the significant decline in luminance and improve unifor- mity. However, this reduces the axial luminance. During this back-and-forth tuning process, the backlight module tends to become excessively thick because of the addi-
tion of extra optical films, which also dissipate the light energy. Thus, the goal of this study was to design a compound optical film with an innovative structure em-phasizing light uniformity. The aim was to widen the lu- minance distribution viewing angle and resolve the un- even luminance in the central viewing angles of older structures to achieve one-to-two or one-to-many perfor- mances, replace the traditional process of stacking multi- ple optical films together, reduce the thickness of back- light modules, design an easy-to-manufacture structure, and effectively reduce costs.
Fresnel lenses of varying geometries and densities. This method achieved the highly uniform flux concentration required for the design of photovoltaic cells [3].
Genetic algorithm has less been applied in backlight module with a light guide structure design. In 2008, Fan
et al. applied genetic algorithms to design LED lens in direct type LED Backlight Unit to achieve high uniform-ity [4]; In 2009, Li et al. applied genetic algorithm to optimize the distribution density of the prism pattern to improve the uniformity of the light guide plate [2]. In 2013, Kim et al. applied genetic algorithm to numerical model of a planar prism LED luminaire, and to the analysis of the best angle prism [5]. This study proposes an innovative design and optimize structure applied Ge-netic algorithm, which can achieve high uniformity of the illuminance distribution with a large angle.
2. Design Analysis of optical Film Structure
2.1. Configuration of Backlight ModulesThis study used sidelight-type backlight modules with 7-in no-wedge angle light guide plates with the following dimensions: 92 mm in width, 158 mm in length, and 2.5 mm in thickness. The material used was PMMA with a refractory index of 1.49. The reflectivity was approxi-mately 95%. The distance between the light exit face of the light guide plate and the receiver board was 0.45 mm. Only the no-wedge angle light guide plates contained concave hemispheric structures, the rest were all unstruc- tured optical surfaces. The diameter of the structure was 0.1 mm. The distance between the structures was 1 mm in both the X and Y directions. The light source was an LED, specifically item number NESW020A from NICHA, which emits 3.7 lm with a 20 mA electrical supply at a light-emitting angle of 120˚. The light pattern was close to a Lambertian distribution. Additionally, 7 LEDs were arranged equidistantly along the short edge of the light guide plate.
2.2. Design Method for the optical Structure Geometry
The structural geometry concept of this study was based on achievements in surface microstructure design for LED packaging completed by our laboratory [6,7]. Re-sults from the research have indicated that stepped struc-tures have light focusing effects. Applying this charac-teristic to the design of optical films has a potential to provide excellent performances. The original stepped structure (shortened to original structure hereafter) in the patent awarded to our laboratory in 2008 for composite optical film can achieve a wider luminance distribution throughout the viewing angle [8]. However, the axial luminance remains inferior to that of a prismatic sheet combined with a diffusion film. Because our laboratory
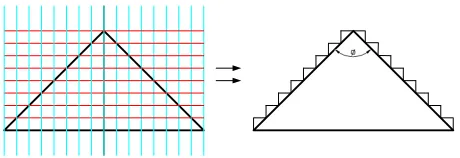
had already generated a conceptual structure, which had room for improvement, we focused on introducing light- focusing novel structures to enhance the brightness and performance. Therefore, this study used the concept of geometric shape combinations to combine the prismatic structure providing brightness-enhancing effects with stepped structures providing broader luminance distribu-tions throughout the viewing cone, in the hopes that mul-tiple performance improvements could be achieved. Fig-ure 1 shows the design concept diagram for combining
geometric shapes. Square structures were introduced into the original prismatic structure, forming stepped geomet-ric structures similar to oblique prisms. Novel structures were created through equidistant division, changing an-gles, or changing the structural width and height. This enabled the structural parameters to be defined, which facilitated the experimental process to identify optimal solutions.
The shape and dimension of the optical film structure refer to the structural dimensions of the prismatic bright-ness-enhancing film 3M BEFII 90/50. The structural shape of 3M BEF 90/50 comprises equilateral triangles 23 μm in height, with a tip angle of 90˚, and arranged in parallel rows. The novel geometrical structure in this study was based on this geometry and further divided equidistantly into 16 sections in the horizontal direction and 8 sections in the vertical direction. The equidistant division lines along the edges of the prismatic surfaces were joined to form the stepped structure proposed in this study. Figure 2 shows a conceptual diagram of the
de-sign of this novel structure.
2.3. Defining the structural Parameters of the optical Geometry
Figure 3 shows a diagram that defines the structural
shape of the stepped structure. In this figure, W repre-sents the base width of a single structure. The width of each exposed step was W/16. H represents the overall height of the structure, and the height for each step was H/8. θ represents the angle from the edge of the stepped structure to the horizontal plane. When θ was 45˚, the
[image:2.595.309.539.642.721.2]or
Figure 1. Design concept for the combination of geometries.
H
P W
θ
Figure 3. The external dimensions of the stepped structure.
formed structure was a triangular prism. P represents the distance between each structure. The 8-stepped structural arrays could be defined completely using these 4 parame- ters. Once the parameters were defined, the machining limit or the size of commercially available optical film sheets was used as the boundary conditions for the rea-sonable ranges of structural parameters. This mitigates the manufacturing difficulties caused by excessively small structures, or an inability to effectively downscale the thickness of backlight modules because of exces-sively large structures.
2.4. Methods for Measuring Uniformity
This study used the 9-point VESA measurement method as a reference for uniformity measurements of the 7-inch backlight module. The luminance value of each point was first measured, then the 9-point VESA measurement method commonly employed throughout the industry was applied [9]. The minimum and maximum luminance values of backlight modules measured using the 9-points were shown as percentages, which were the level of uni-formity of the panel. The uniuni-formity formula is shown below:
min
max
L
Uniformity 100%
L
(1)2.5. Full Width at Half Maximum
In 2009, Sang-HoonBaik used the full width at half maximum (FWHM) to define the angular luminance dis-tribution of optical films to determine the size of the view angle [10], which was then examined against an orthogonally arranged dual prismatic sheet for perform-ance comparison. This study referenced this definition of view angle to define the view angle of the angular lumi-nance distribution curve. This lumilumi-nance angle differs from the commercially available viewable angle deter-mined by the level of contrast. For TFT-LCDs, a higher luminance angle is less likely to cause uneven brightness and luminance declines when viewed from multiple an-gles.
3. Results and Discussion
[image:3.595.61.287.71.153.2]3.1. Results from the genetic Algorithm
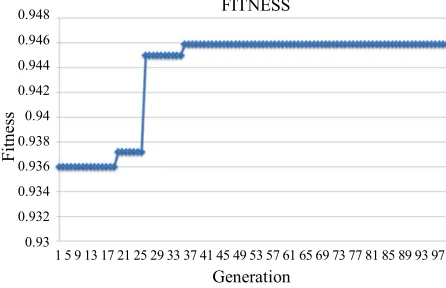
Figure 4 is a fitness function curve for the GA. The
fig-ure shows that by generation 33, the difference between chromosomes was sufficiently minor that neither mating nor mutation could achieve superior solutions. The iter-ating computation using the optimal value obtained in this GA was stopped at generation 100 because the ter-mination criteria were satisfied. Figure 5 shows the
op-timized exterior structure through a global search method using the GA.
3.2. Analysis of structural form and Performance
3.2.1. Discussion on the Relationship between structural form and View Angle Luminance Distribution
Table 1 shows the interval combinations and uniformity
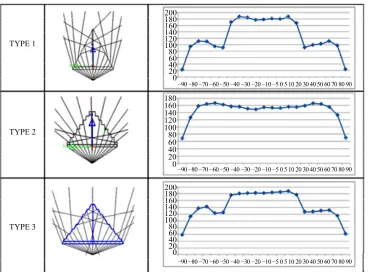
values for intervals of 0.03 mm, with uniformity values above 92%. Because of the many combinations, only combinations with uniformity values above 92% were included in the examination. Based on the 26 combina-tions of structural shapes and light trace charts, we found that the structural shapes could be roughly classified into 3 types. The various shape types are shown in Figure 6.
[image:3.595.311.534.478.622.2]TYPE 1 comprises prismatic structures, TYPE 2 com-prises step-shaped structures with larger side angles, and TYPE 3 comprises step-shaped structures with smaller side angles.
Figure 6 shows that the prismatic structure of TYPE 1
shapes characteristically corrects light rays at greater angles of deviation from the normal line to within plus or minus 30˚ from the center. Luminance at the central view angles is higher and more concentrated than the lumi-
FITNESS
1 5 9 13 17 21 25 29 33 37 41 45 49 53 57 61 65 69 73 77 81 85 89 93 97 Generation
0.948 0.946 0.944 0.942 0.94 0.938 0.936 0.934 0.932 0.93
Fitne
[image:3.595.309.537.650.706.2]ss
Figure 4. Fitness function curve of the genetic algorithm.
Table 1. Parameter combinations with intervals of 0.03 mm and respective uniformity values.
Width Height Angle Interval Uniformity (%) Generation
0.858 0.265 79.131 0.030 92.01 G34
0.061 0.038 80.520 0.030 92.02 G50
0.061 0.038 85.367 0.030 92.03 G59
0.061 0.038 85.168 0.030 92.04 G74
0.061 0.038 66.625 0.030 92.07 G69
0.061 0.019 65.000 0.030 92.09 G42
0.122 0.038 65.000 0.030 92.09 G43
0.061 0.038 72.855 0.030 92.09 G69
0.061 0.031 65.000 0.030 92.12 G65
0.061 0.038 87.724 0.030 92.12 G71
0.137 0.038 65.000 0.030 92.13 G62
0.061 0.021 65.000 0.030 92.35 G55
0.061 0.038 74.936 0.030 92.35 G62
0.106 0.038 65.000 0.030 92.35 G62
0.061 0.038 84.619 0.030 92.38 G63
0.636 0.300 65.000 0.030 92.76 G39
0.061 0.021 65.000 0.030 92.81 G72
0.083 0.038 65.000 0.030 92.84 G58
0.061 0.026 65.000 0.030 92.85 G41
0.064 0.038 65.000 0.030 92.86 G99
0.161 0.096 65.000 0.030 92.92 G45
0.090 0.038 65.000 0.030 93.27 G53
0.061 0.064 65.000 0.030 93.51 G51
0.136 0.038 65.000 0.030 93.63 G67
0.061 0.035 65.000 0.030 93.88 G42
0.061 0.040 65.000 0.030 94.59 G33
nance at larger view angles, ranging between 180 nit and 190 nit. The luminance view angle was measured as 80˚
using the FWHM measurement method.
TYPE 2 comprised stepped structures with larger side angles. The light trace chart of TYPE 2 shapes in Figure 6 shows that the overall luminance distribution of these
structures was generally wider, with weaker luminance in the central view angles, ranging between approximately 150 nit and 160 nit. However, the luminance view angle was wider at approximately 178˚. This indicates that the characteristic of TYPE 2 structures is a wider viewing angle from the light source.
TYPE 3 also comprises stepped structures, but these
[image:4.595.60.284.111.564.2]structures have smaller side angles that are generally below 80˚. The light trace chart of TYPE 3 structures in
Figure 6 shows that, similar to that of TYPE 2 structures,
the light travel angle is slightly enlarged, causing the light to proceed in directions with greater viewing angles. When light travels through the side inclination angles of stepped structures, the law of refraction guides the light toward more central viewing angles, achieving the same light-focusing effect as that of prismatic structures. This causes the view angle luminance distribution chart for TYPE 3 structures to show higher central luminance at between approximately 180 nit and 190 nit. The lumi-nance values for larger viewing angles are significantly higher than the values for prismatic structures with viewing angles of approximately 168˚. These comparison results indicate that stepped TYPE 3 structures have the light-focusing characteristic of prismatic structures with the wide-angle characteristic of TYPE 2 stepped struc-tures. This improved the low luminance value in central viewing angles. With the structural parameter combina-tions derived from the GA, an excellent uniformity of 94.59% was obtained.
3.2.2. Comprehensive Comparisons
Figure 7 is a comprehensive comparison chart of various
optical film combinations and viewing angle luminance distributions. The results were used to evaluate the lumi-nance distribution of various types of optical films in various angles. Compared to optical films with the origi-nal stepped structure, regardless of whether the origiorigi-nal stepped structure had a viewing angle approximately 10˚
wider than that of the GA structure, the axial luminance of the GA structure was 17.2% higher than that of the original step structure, with a 1.99% increase in uniform-ity.
Backlight modules generally use light-focusing pris- matic structures in brightness-enhancing films. However, uneven brightness occurs at greater viewing angles with extremely steep declines. Therefore, another diffusion film is typically used to equalize the light distribution and reduce the significant decline in luminance. Light smoothing also improves the uniformity of backlight modules. As shown in Figure 6, the viewing angle for
the GA structure was 67˚ wider than that of a single brightness enhanced film (BEF) with increased mem-brane, and shows a significant difference in luminance gap beyond the plus or minus 50˚ viewing angels.
200 180 160 140 120 100 80 60 40 20 0 180 160 140 120 100 80 60 40 20 0 200 180 160 140 120 100 80 60 40 20 0
−90 −80 −70 −60 −50 −40 −30 −20 −10 −5 0 5 10 20 30 40 50 60 70 80 90
−90 −80 −70 −60 −50 −40 −30 −20 −10 −5 0 5 10 20 30 40 50 60 70 80 90
−90 −80 −70 −60 −50 −40 −30 −20 −10 −5 0 5 10 20 30 40 50 60 70 80 90 TYPE 1
TYPE 2
[image:5.595.115.483.84.356.2]TYPE 3
Figure 6. Comparison of the light trace charts and viewing angle luminance distribution curves for each type of structural form.
250
200
150
100
50
0 −90 −80 −70 −60 −50 −40 −30 −20 −10 −5 0 5 10 20 30 40 50 60 70 80 90
L
um
inance
(
nit)
Angle (Degree)
GA 1BEF + D 2BEF + D
original stepped structure
Figure 7. The viewing angle luminance distribution curve for various groups.
4. Conclusion
These comparisons show that the GA structures pro-vide performances that are comparable or even superior to those of commercially available optical films. Re-garding the number of optical films used, the GA struc-ture optical films achieved the optimal performance with a single layer. Compared to the 100 μm to 200 μm thick- ness and high cost of diffusion films commonly used in the market, the height of the GA structure was merely 41
μm. The prismatic sheet plus diffusion film measured 123 μm to 223 μm in thickness. The GA structure re-duced the thickness by 66% to 82%. Thus, the film thickness and costs were substantially reduced, and vari-ous issues associated with stacking multiple optical films together were also avoided.
In this study, we proposed the idea of combining geo-metric shapes to design new compound function optical microstructures. Real-valued coding was used to intro-duce the GA, which then identified a set of optimized optical microstructures with superior uniformity at 94.59%. Conclusions based on analysis of the modeling results and consolidated data are provided below:
[image:5.595.131.464.398.541.2]nance view angle, and a good axial luminance, the over- all thickness is reduced by approximately 66% to 82%. By only requiring the use of a single optical film, the structural alignment and abrasion damage problems in-volved in stacking multiple optical films are avoided, and the light source use rate is improved through the reduced dissipation of light energy. Thus, the goal of reducing the thickness of the backlight module through the design of a compound optical film is achieved.
2) The influence of the shapes on the angular lumi- nance distribution can be observed by classifying the structural forms. The results indicate that the prismatic structure is extremely effective for focusing light, but a steep angular luminance decline occurs at greater view-ing angles. Additionally, the width of the viewview-ing angle is insufficient. Stepped structures with larger side angles are more effective for dispersing light, showing greater viewing angles. However, the brightness at central view-ing angles tends to decline. The GA structure was a stepped structure with smaller side angles. When light passes through the higher part of the stepped structure, the prismatic collimation effect was exhibited. The light was dispersed when passed through the wide part. There- fore, this structure can combine these two features to achieve the optimal design of an optical microstructure.
3) After optimization, the GA structure proposed in this study had a luminance viewing angle of approxi-mately 168˚. Although it was approximately 10˚ smaller than that of the original structure, the axial luminance was increased by 17.2%, which resolved the problem of low central luminance in the original structure. The uni-formity was also approximately 1.99% higher than that of the original structure.
Comparing the GA structure optimized in this study with the traditional pairing of prismatic sheets and diffu-sion films, the viewing angle of the GA structure was 67˚
better than that of the 1BEF + diffuser, and 118˚ greater than that of the 2BEF + diffuser configuration. Regarding uniformity, the GA structure was superior to both film combinations, increasing uniformity by 2.52% and 3.45%, respectively. The results show that using a single sheet of GA-structured optical film effectively impro- ves the uniformity to provide good luminance viewing angles without requiring diffusion films.
REFERENCES
[1] J. H. Holland, “Adaptive in Natural and Artificial Sys- tems,” University of Michigan Press,Ann Arbor, 1975. [2] C. J. Li, Y. C. Fang and M. C. Cheng, “Study of Optimi-
zation of an LCD Light Guide Plate with Neural Network and Genetic Algorithm,” Optics Express, Vol. 17, No. 12, 2009, pp. 10177-10188.
http://dx.doi.org/10.1364/OE.17.010177
[3] N. Yamada and T. Nishikawa, “Evolutionary Algorithm for Optimization of Non-Imaging Fresnel Lens Geome- try,” Optics Express, Vol. 18, No. S2, 2010, pp. A126- A132. http://dx.doi.org/10.1364/OE.18.00A126
[4] Y. H. Fan, Y. L. Liao, R. J. Chen, S. K. Chang and J. C. T. Hsieh, “Optimal Design of LED Backlight Unit with Double-Triangular Structure Using a Genetic Algorithm,” Fourth International Conference onNatural Computation, Jinan, 25-27 August 2008, pp. 625-629.
[5] Y. S. Kim, A. S. Choi and J. W. Jeong, “Applying Micro Genetic Algorithm to Numerical Model for Luminous In-tensity Distribution of Planar Prism LED Luminaire,” Optics Communications, Vol. 293, 2013, pp. 22-30. http://dx.doi.org/10.1016/j.optcom.2012.11.017
[6] P. Y. Tsai, C. C. Hsieh and Y. H. Li, “Application of a Novel Focused Microlens to Light-Emitting Diode Pack- aging,” Journal of Micro/Nanolithography, MEMS, and MOEMS, Vol. 9, No. 3, 2010, Article ID: 033012. http://dx.doi.org/10.1117/1.3487740
[7] C. C. Hsieh, P. Y. Tsai, Y. H. Li and C. W. Fan, “Inves- tigation of the Influence of Structural Parameters of a Fresnel-Type Lens on the Narrowing of Light-Emitting Diode Light Beams,” Journal of Microlithography, Mi-crofabrication, and Microsystem, Vol. 10, No. 3, 2011, pp. 1-9.
[8] C. C. Hsieh, C. K. Yen and C. Y. Wang, “Composite Optical Film,” Patent M330483, 2008.
[9] P. Downen, “A Closer Look at Flat-Panel-Display Meas-urement Standards and Trends,” Information Display, Vol. 22, 2006, pp. 16-21.
[10] S. H. Baik, S. K. Hwang, Y. G. Kim, G. Park, J. H. Kwon, W. T. Moon, S. H. Kim, B. K. Kim and S. H. Kang, “Simulation and Fabrication of the Cone Sheet for LCD Backlight Application,” Journal of the Optical Society of Korea, Vol. 13, No. 4, 2009, pp. 478-483.