Munich Personal RePEc Archive
Social identity, group composition and
public good provision: an experimental
study
Chakravarty, Surajeet and Fonseca, Miguel A.
University of Exeter
7 June 2010
Online at
https://mpra.ub.uni-muenchen.de/23115/
Social identity, group composition and public good provision: an
experimental study
∗Surajeet Chakravarty†and Miguel A. Fonseca‡
June 7, 2010
Abstract
Social fragmentation has been identified as a potential cause for the under-provision of public goods in developing nations, as well as in urban communities in developed countries such as the U.S. We study the effect of social fragmentation on public good provision using laboratory experiments. We create two artificial social groups in the lab and we assign subjects belonging to both groups to a public good game. The treatment variable is the relative size of each social group, which is a proxy for social fragmentation. We find that while higher social fragmentation leads to lower public good provision, this effect is short-lived. Furthermore, social homogeneity does not lead to higher levels of contributions.
JEL – classification numbers: C92, D02, D03, H41
Keywords: Social Identity, Public Goods, Social Fragmentation, Experiments.
∗Financial support from the Economics Dept. at University of Exeter and ESRC grant RES-000-22-3941 is
gratefully acknowledged. We thank Tim Miller for programming the software and helping running the sessions. We
are also grateful to participants in the 2009 European ESA conference at Innsbruck for insightful comments and
suggestions. The usual disclaimer applies.
1
Introduction
“(W)e hunker down. We act like turtles. The effect of diversity is worse than had been imagined.
And it’s not just that we don’t trust people who are not like us. In diverse communities, we don’t
trust people who do look like us.” (Robert D. Putnam, 2007)
We live in an ever increasingly diverse world, whether measured in terms of ethnicity, religion
or language. In the US, there has been an increase in the proportion of ethnic minorities. While
currently accounting for roughly one third of the population, they are expected to become the
majority in 2042. Currently nearly half of all American children are from ethnic minorities (US
Census Bureau, 2008; 2009). Similarly, the UK’s Office of National Statistics now lists sixteen
major different ethnic groups residing in the UK.
While other social sciences have long looked at the impact of social diversity, economists
have only recently begun to systematically analyzed the impact of diversity on economic outcomes.
The empirical literature on the economic impact of social diversity points to a negative correlation
between social fragmentation (typically measured along ethnic or linguistic lines) and economic
performance. In a seminal paper, Easterly and Levine (1997) find a negative correlation between
ethnic fragmentation and public good provision in African countries. Alesina et al. (1999) study
the impact of social diversity (in particular ethnicity) on public good provision in US cities. They
find that social fragmentation can be detrimental to public good provision for two reasons: firstly,
different groups may prefer different kinds of public goods; secondly, a group’s utility from enjoying
the public may be diminished if another group also benefits from it. Luttmer (2001) investigates
US survey data and finds approval rates on welfare spending are higher in areas where the majority
beneficiaries are of the same racial group as the responder.
block for the analysis of inter-group discrimination. It argues that individuals define themselves
as a function of which groups they belong to and exhibit a discriminatory bias against outsiders.
Formalizations of this concept in economics include the work of Akerlof and Kranton (2000), Alesina
and La Ferrara (2000), Shayo (2009) and Currarini et al. (2009).
A problem with testing the effect of group identity on behavior in the field using econometric
techniques is how to the identify the relevant identity. Individuals can identify themselves through
multiple identities, and separating the effect of different identities can become difficult from an
econometric point of view. For instance, India is a socially diverse country along linguistic, caste
and religion. When studying the effect of a particular identity, it is difficult both to measure it
and to predict the interaction effects between itself and other identities. Experimental methods,
however, allow the researcher a much higher degree of control, and the ability to isolate the effect
of identity keeping all other factors constant. Experiments also allow the researcher to construct
appropriate variations in social fragmentation, thus providing a cleaner test of the theory.
The purpose of this paper is to study the impact of group identity on public good contributions
in laboratory experiments. In particular, we are interested in studying how public good provision
changes as the degree of social fragmentation in a population increases. We employ a simple model
of social identity and we apply it to a linear public good game. We then test the predictions of this
model in the lab.
Most experimental evidence on the effect of social identity on public good provision has looked
at pure in-group/out-group differences in public good games, using either pre-existing identities,
such as gender (Brown-Kruse and Hummels, 1993; Cadsby and Maynes, 1998; Croson et al., 2003)
and membership of social groups (Solow and Kirkwood, 2002); or artificially-induced identities
(Kramer and Brewer, 1984; Wit and Wilke, 1992; Eckel and Grossman, 2005). The general finding
identity raises cooperation levels. Eckel and Grossman (2005) in particular find that group identity
has a positive effect on public good contribution, only if it is supplemented by further team-related
tasks, which enhance the degree to which subjects relate to the group. Charness et. al. (2007)
also find that the saliency with which identity is induced has an important effect on behavior in
Prisoner’s Dillemma.
Our paper makes a contribution by looking at the impact of social heterogeneity on
coopera-tion; in particular, how do individual’s decisions to contribute to a public good change as function of
the proportion of individuals of her type in the population? Our results will help address questions
as: what are the consequences of a multi-cultural society on public good provision? Is it crucial for
a society for there to be a super-ordinate identity (Sen, 2006), which subsumes all others, or will a
society which encompasses a kaleidoscope of different identities be equally apt at providing public
goods to its members?
Following the minimal group paradigm (Tajfel et al. 1971), in our experiments, subjects
select their identity based on their preferences between two artists (Klee or Kandinsky). We
then randomly sorted subjects in groups of six, who then played in public good game for twenty
periods. The main treatment was the composition of the six-player group, which ranged from fully
homogenous (e.g. six Klee players) to the fully fragmented (e.g. three Klee players and three
Kandinsky players).
Our findings are that a higher degree of group fragmentation does lead to significantly lower
contribution levels in the beginning of the experiment. However, over the course of the experiment,
average contributions to the public good decline in all experiments. The free-rider problem dilutes
the effect of identity, and although we still find an effect of group membership in later stages, it is no
longer significant. Furthermore, as per the theoretical predictions of our model, we find differences
of total contributions to the public good, we find no statistical difference between majority groups
and minority groups. The following section deals with the theoretical framework underpinning
our study. Section 3 outlines the experimental design, section 4 reports the results and section 5
concludes.
2
The model
2.1 Social Identity
Social Identity Theory (SIT) argues that every individual engages in a three-stage process. In the
first stage, Categorization, each individual defines a set of categoriesH ={h1, h2, ..., hH}(e.g. race,
gender, religion). Every category is defined on a subset of the real line between 0 and 1.1 Therefore,
for a given category hj, each individual will be a point on that line. For instance, consider the
case of political preferences. An individual may identify himself with an extreme left-wing party or
as a extreme conservative, or anything in between. That individual’s position on the line will be
denoted asqij ∈R. Therefore, each individual could be described as a function of how she identifies
herself in each category: qi= (qi
1, ..., qih, ..., qHi ), where qi ∈RH.
The second stage in SIT is Identification, by which an individual decides the groups within
categories with which she identifies. In-groups are groups with which she identifies; out-groups are
groups with which she does not identify. We define a social group, g, as a subset of two or more
individuals who share an attribute: g∈G={g⊆N :qgi =qjg,∀i6=j}.
The status of a group determines how important that group is. This could be due to a variety
of factors, such as wealth or size. In this paper, we study how the status a particular group varies
with its relative size in the population. LetIgh be the number of insiders of groupg in categoryh,
1
Naturally, some categories such as religion or gender are discrete, rather than continuous variables. However,
and letOhg be the number of outsiders to groupg in categoryh.
The status of groupgin categoryhwill depend on the relative size of the insiders of that group
in the population: Sh g(
Ih g
Ih
g+Ohg), where S
h
g : [0,1]→ R+. We also assume that Sgh(0) = Sgh(1) = 0.
In other words, if there is no variation in types among a particular category, that category is
irrelevant. We make no assumptions as to how Shg behaves with respect to Igh, as this will be a
testable hypothesis later on.
The third and final stage in SIT is Comparison. In this stage, individuals compare themselves
to other, with a negative bias towards out-group members. We formalize this by assuming subjects
will compare themselves along the category in which their in-group is defined. Following Gardenfors
(2000), Nosofsky (1986, 1992) and Shayo (2009) , we conceptualize the process of comparison by
individuals through the distance in category space. In particular, dhi,j is the distance between
individual i, who is a member of a particular group defined on categoryh, and a given out-group
member j.
dhi,j ≡SghX
k6=h
(qki −qjk)2 (1)
Hence, individual iwill compare himself to an out-group member along all categories other than
the one that defines his in-group.2
Our distance measure assumes that the stronger the status of
the group, the bigger the weight given to differences along that particular category.
2.2 The Public Good Game
Let us consider a set of players, N ={1, ..., n}, each of whom is endowed with wealthW and must
allocate it between private consumptionyi and a public goodG. This public good is a function of
the sum of contributions by individual members,ci,G=G(Σici) andyi =W −ci.
2
It is natural to see that, with multiple categories, there will be many social groups to which a given individual can
belong. When testing the theory, we will work with one category only, to avoid the problem of conflicting identities.
The utility function of playeri, who is a member of groupg is given by:
Ui,g=U(yi, ci, cIg, cOg, S
h g,
X
j6=i
dhi,j(Sgh)) (2)
For ease of exposition, we shall say thatUi(x) is increasing (decreasing) in x ifUi(x′)≥(≤) Ui(x)
ifx′ ≥x. In this game, Playeritherefore faces the following maximization problem:
max
ci
Ui(yi, ci, cIg, cOg, Sg, di,j(Sg)) (3)
In a standard public good game, the utility of a given player is increasing in others’ contributions
and his endowment and decreasing in his own contribution (Mueller, 2003).
While our analysis retains the last two assumptions, by considering the possibility that social
identity plays a role in determining behavior, we depart from the standard analysis of public
good games. In particular, we focus on the distinction between in-group members and out-group
members and their impact on a player’s utility. It is reasonable to assume that a player’s utility
should increase with the contributions of in-group members (cIg) (see Brewer, 1979 and subsequent
social psychology literature on social identity). Closely related to this is the concept of in-group
status. This variable measures the relative importance of one’s in-group. As such, the higher the
status of a group is (Sg), the more utility one gains from membership of that group.
While standard theory would argue that contributions to the public good would raise one’s
utility via higher monetary reward, the impact of out-groups regarding the contribution to the
public good is unclear. Importantly, we must distinguish an individual’s attitude to contributing
towards a public good which is shared with outsiders from an individual’s attitude towardsreceiving
contributions from outsiders towards the same public good.
Given that out-groups are subsets of the population with which a given individual does
not identify, it is reasonable to assume that contributions which benefit such groups would cause
distance in category space) such groups are, the more disutility one gets from sharing a public
good. Hence, the player’s utility is decreasing in the distance between himself and the out-group
members (di,j(Sg)). Note that the higher the status of a sub-group, the more salient that dimension
of comparison will be. Given these properties of the game, and focusing our analysis on symmetric
Nash equilibria, we present our first result.3
Proposition Given preferences Ui,g = U(yi, ci, cIg, cOg, S
h g,
P
j6=idhi,j(Sgh)) for all i players, the
public good contribution game:
1. Has a Nash Equilibriumc∗i(yi, cIg, cOg, S
h g,
P
j6=idhi,j(Sgh)).
2. c∗i(yi, cIg, cOg, S
h′
g ,
P
j6=idhi,j′(Sgh′))≥c∗i(yi, cIg, cOg, S
h g,
P
j6=idi,j(Sgh)) forSgh′ ≥Sgh if and only
ifSh
g is monotonically increasing in Ig
Ig+Og.
Remark: Player iwill invest more if she belongs to the majority rather than the minority in the
group.
We defer the formal proofs to the appendix and we focus on the basic intuition behind the
result. The first part of the Proposition follows from the existence result of a linear public good
game (Mueller, 2003). The primary change to the linear public good game is the introduction of
players with social identity preferences, formalized by the status of the in-group and the distance
from out-group members. Given our assumptions about preferences – in particular, that individuals’
utility increases with in-group status, and decreases with distance from out-group members – we
have a game of increasing differences in the key variables and parameters. Therefore, using Topkis
(1998), we can show that the equilibrium of the game exists. Furthermore we show that equilibrium
contributions increase in the status of the in-group and decrease in the distance from out-group
members. Intuitively, this result is driven by opposing effects: the in-group status, which is basis
3
for favorable in-group bias, and the distance variable, which is the basis for unfavorable out-group
bias.
Consider the simple example of a population where all individuals are defined over two
categories (e.g gender and race). Suppose that everyone is the same, in the sense that everyone
has the same gender and race. In this case, in both categories, the in-group equals the population,
and therefore the status of that group by definition is zero. A social group is meaningless if there
is no other group with whom one compare.
Now suppose we replace one individual from this population with someone who is different
along the gender category; now, one can divide the gender category in two sub-groups (men and
women). Hence, the status of the majority group is strictly positive, and this will lead to a jump
in contributions. At the same time, the majority group will derive disutility from sharing a public
good with an outsider, which will lead to a drop in the contributions by the majority. This leads
to the question of what effect will dominate. We believe this question is fundamentally empirical
in nature. We conjecture that the status effect will dominate the distance, and this forms our first
hypothesis.
Hypothesis 1:
a) Average contributions in homogenous groups are no different than average contributions in
anonymous groups.
b) Increasing the number of out-group members from zero to one will lead to an increase in average
contributions.
As we further increase the number of out-group members, the relative size of the majority
group will fall. If the majority sub-group’s status is indeed decreasing in its size, then the average
majority has to share the public good (implying a larger Pj6=idhi,j), which also leads to a drop in
contributions.
Hypothesis 2: Contributions to the Public Good will decline with the degree of social
fragmen-tation in the population.
A further consequence of the status and distance effects is that for a given category, majorities
will always have a higher status than minorities and by definition a smaller aggregate distance to
out-group members. Therefore, the disutility from a given level of contribution will be higher for
minority members than majority members.
Hypothesis 3: Majorities will contribute more than minorities.
3
Experimental design and procedures
Before describing our experimental design, a methodological note is warranted. To tackle our
re-search question, unlike field studies which must draw on real forms of identity such as language
(Easterly and Levine, 1997; Alesina et al., 1999) or caste (Bannerjee et al., 2005), we rely upon
arti-ficially induced identities, following the minimal group paradigm of Tajfel et al. (1971). We induce
identity via participants’ choices of paintings – an arbitrary task which is completely unrelated to
the main focus of the experiment.
While an arbitrary identity has the drawback of artificiality, it also allows the experimenter to
isolate factors which are present when dealing with real identities. In order to study the relevance
of social identity on behavior, we must try to isolate the effect of individual preferences from the
effect of a previous history of interaction. This is often not possible in the field. Furthermore,
an individual may identify himself through his nationality, ethnicity or gender. Through the
com-bination of eliciting an artificial identity and strict anonymity in choices, the experimenter can
ensure that this is the only salient factor which influences choices. One can then study the effect of
identity while teasing out repeated interaction effects. While studying the effect of particular types
of identity such as gender or race is very important, we feel that working with a generic identity
fits the purpose of this study best.
We induced social identity by using a similar design to Chen and Li (2009). Each session
con-sisted of eighteen participants. In the beginning of each session, participants stated their preference
between five pairs of Klee and Kandinsky paintings. Based on their choices, they were allocated
to the Klee group or the Kandinsky group. This meant that we could not guarantee that half the
participants in a given session would go to one of the groups. However, the variation in group size
was quite small.4
Once Klee/Kandinsky groups were established, to reinforce their sense of identity, subjects
were given a team-building exercise. This exercise consisted of identifying the authorship of two
further paintings, one of which was painted by Klee and the other by Kandinsky. Subjects were
allowed to confer with fellow group members through a chat box for ten minutes. Subjects would
receive a payment for each painting they correctly identified.
Following the painting identification stage, subjects were randomly allocated to groups of
six participants. Subjects knew the composition of their own group, but they were not told of
the composition of the other groups in the session. The composition of each group was the main
treatment variable. We considered four different treatments: homogeneous groups with six elements
of the same type (6-0), and a further three treatments varying the degree of heterogeneity (5-1,
4
This also means we could not collect an equal amount of observations in all treatments. However, we ensured
we collected a minimum of six observations per treatment. Furthermore, the statistical analysis we employ does not
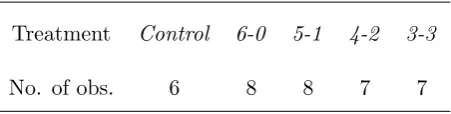
Treatment Control 6-0 5-1 4-2 3-3
[image:13.595.194.420.74.131.2]No. of obs. 6 8 8 7 7
Table 1: Experimental design
4-2, 3-3). In addition, we ran an additional control treatment where we did not induce identity
(Control). Table 1 outlines the different treatments and number of independent observations. All
groups played a standard Voluntary Contribution Game over twenty rounds with fixed matching.
Subjects had twenty tokens that they had to allocate between a private and a public account.
Payoffs were determined by the following equation, following Fehr and Gaechter (2000).
πi = 20−ci+ 0.4
X
j
cj (4)
At the end of each round, subjects were informed of the individual contributions by each
member of the group, as well as his identity (Klee or Kandinsky). To prevent the effect of reputation,
the order in which individual contributions were displayed was randomized from round to round.
At the end of the experiment, subjects were paid individually in cash. Sessions took place in the
FEELE laboratory at the University of Exeter in the Spring of 2009. The experimental software was
z-Tree (Fischbacher, 1997). A total of 234 undergraduate students participated in the experiment.
Average payments were£10.30 ($14.89). A copy of the instruction set is in the Appendix.
4
Results
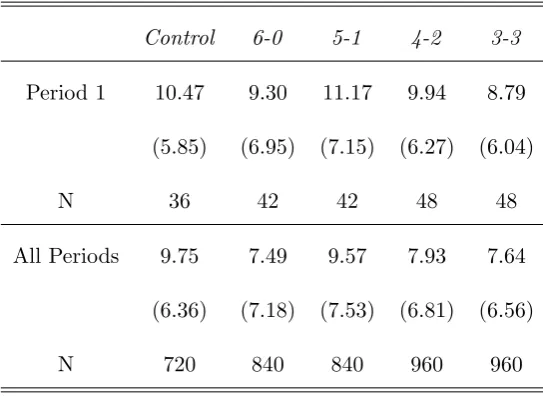
We begin our analysis by looking at the main question of the paper, the effect of group fragmentation
on contributions to the public good. Table 2 displays average contributions by treatment. We start
by looking at the contribution level in period 1, where there is no effect of repeated interaction.
We find a significant correlation between fragmentation and average contribution (Spearman’s ρ
Control 6-0 5-1 4-2 3-3
Period 1 10.47 9.30 11.17 9.94 8.79
(5.85) (6.95) (7.15) (6.27) (6.04)
N 36 42 42 48 48
All Periods 9.75 7.49 9.57 7.93 7.64
(6.36) (7.18) (7.53) (6.81) (6.56)
[image:14.595.169.441.72.270.2]N 720 840 840 960 960
Table 2: Average Contribution by Treatment
to 3-3 (p = 0.05, 1-sided J-T test).5
This confirms our hypothesis that higher degree of social
fragmentation lead to a decline in public good provision.
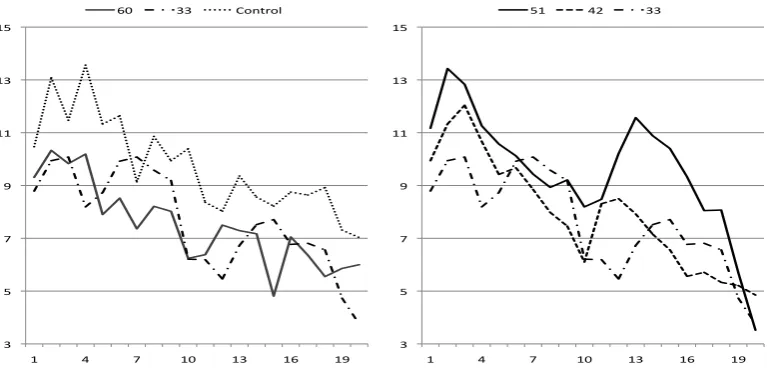
However, as figure 1 shows,6
we see a decline in average contributions over time in all
treat-ments.7
This results in lower average contributions in all treatments. As the right panel clearly
shows, there is hardly any difference in average contributions between the 5-1,4-2 and 3-3 in the
last three periods of the experiment. Therefore, when we take into account all ten periods, we still
find a positive correlation between contributions and majority size, but it is no longer significant
(Spearman’sρ = 0.17,p = 0.30). We still see a decline in average contributions when we go from
the5-1 treatment to3-3 treatment, but it is no longer significant (1-sided J-T test,p= 0.16).
5
For presentational ease we will use M-U to denote the non-parametric Mann-Whitney test of equality of means
between two random variables (Mann and Whitney, 1947) and J-T to denote the Jonkerhee-Thepstra test (Jonkerhee,
1954), which extends the M-U test tonvariables.
6
For ease of presentation, we divided figure 1 in two panels. The right panel looks at the evolution of contribution
for the5-1,4-2 and3-3, the treatments which test our main hypothesis. The left panel breaks down the evolution of
contributions over time for treatments3-3,6-0 andControl, of which the latter two are controls.
7
The downward trend in contributions is a common pattern in the experimental public goods literature. The spike
in contributions in the5-1 is the result of very high contributions by two groups in periods 12 and 13, which pulled
3 5 7 9 11 13 15
1 4 7 10 13 16 19 60 33 Control
3 5 7 9 11 13 15
[image:15.595.106.490.80.270.2]1 4 7 10 13 16 19 51 42 33
Figure 1: Average contribution over time.
Result 1: Social fragmentation leads to lower contributions to the public good. However, the
effect of social fragmentation diminishes over time.
Continuing our analysis of table 2, we also see that average contributions in the fully
ho-mogenous group (6-0) are not significantly higher than in the group with maximum fragmentation
(3-3), neither in the first period (M-U, p = 0.82), nor over the course of the whole experiment
(M-U, p = 0.73). This suggests that a sense of group identity matters only in the presence of
an out-group. To test for this, we compare behavior in the homogenous treatment to behavior in
a treatment in which there is no group identity. To this effect, we compare behavior in 6-0 to
Control. Although average contributions are slightly higher, they are not significantly so, neither
in the first period of the experiment (M-U, p = 0.62), nor over the course of the twenty periods
(M-U,p= 0.88).
Result 2: Homogenous groups have the same average contribution level than both groups without
identity and groups with maximum fragmentation.
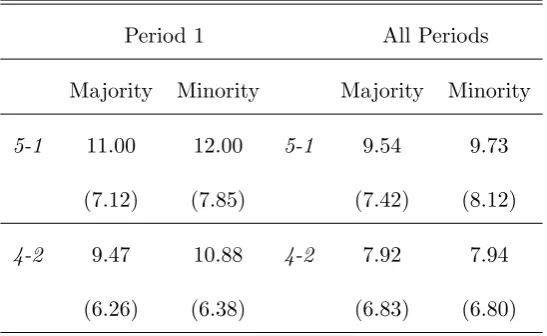
Period 1 All Periods
Majority Minority Majority Minority
5-1 11.00 12.00 5-1 9.54 9.73
(7.12) (7.85) (7.42) (8.12)
4-2 9.47 10.88 4-2 7.92 7.94
[image:16.595.170.444.73.241.2](6.26) (6.38) (6.83) (6.80)
Table 3: Average Contribution by Majority and Minority
average contribution levels of the majority group compares to average contribution levels by the
minority group. Table 3 shows average contributions by majority and minority sub-groups. There
is no significant difference in average contribution between majority and minority groups in both
5-1 (period 1: M-U, p = 0.85, all periods; M-U, p = 0.95) and 4-2 (period 1: M-U, p = 0.88; all
periods: M-U, p = 0.92). Figure 2 plots average contributions by majority and minority groups
in 5-1 and 4-2 over time. We see that although the minority in both treatments initially has a
higher (but insignificant) contribution level than the majority, both groups’ contributions decline
over time. Furthermore, we cannot distinguish a difference in behavior between the two groups in
either treatment5-1 or in treatment4-2.
Result 3: There is no significant difference in average contributions between majority and minority
groups.
However, looking at aggregate figures does not allow us to look at inter-group dynamics
over the course of the experiment. To better understand how subjects reacted to behavior of
in-group and out-in-group members, we conducted a regression analysis of contributions in period t on
the average contribution by in-group members in t−1 and the average contribution of out-group
2 4 6 8 10 12 14
1 4 7 10 13 16 19 Majority Minority
2 4 6 8 10 12 14
[image:17.595.105.489.88.278.2]1 4 7 10 13 16 19 Majority Minority
Figure 2: Average contribution over time 5-1 (left) and4-2 (right).
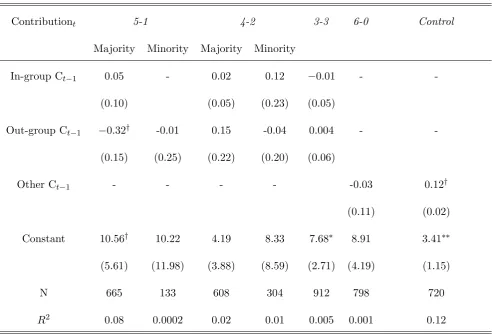
Contributiont 5-1 4-2 3-3 6-0 Control
Majority Minority Majority Minority
In-group Ct−1 0.05 - 0.02 0.12 −0.01 -
-(0.10) (0.05) (0.23) (0.05)
Out-group Ct−1 −0.32† -0.01 0.15 -0.04 0.004 -
-(0.15) (0.25) (0.22) (0.20) (0.06)
Other Ct−1 - - - - -0.03 0.12†
(0.11) (0.02)
Constant 10.56† 10.22 4.19 8.33 7.68∗ 8.91 3.41∗∗
(5.61) (11.98) (3.88) (8.59) (2.71) (4.19) (1.15)
N 665 133 608 304 912 798 720
R2 0.08 0.0002 0.02 0.01 0.005 0.001 0.12
Standard errors in parenthesis, clustered at session level. †,∗∗,∗ indicate significant at 1%, 5% and 10% level.
[image:17.595.72.565.329.663.2]two groups of different size group, we find a positive (but non-significant) coefficient on in-group
contributions. The coefficient on out-group contributions is negative, except for the majority group
in4-2. This is consistent with the notion of in-group bias. The results indicate a (weak) willingness
to match in-group contributions, while free-riding on out-group contributions. When there are two
equally-sized groups (3-3), we find the relationships reverse; however, the size of the coefficients is
very small and insignificant.
5
Discussion
Interpreting the data in light of our model, Findings 1 and 2 suggest two phenomena at work. In
a fully homogenous group, a sense of identity has no relevance, in that there is no out-group to
compare oneself with, and the status of the hegemonic group (Sg) is zero. As soon as we introduce
an out-group member, the status of the (now) majority group suddenly is positive and large, leading
to a jump in contributions. Meanwhile, since there is only one minority member, the negative effect
resulting from the social distance (di,j) between the majority in-group members and the sole
out-group member is small. As we increase the level of fragmentation, the size of the majority out-group
decreases, and therefore its status declines. Simultaneously, the social distance between members
of the majority group and members of the minority group increases. These two effects result in
smaller contribution levels.
However, as the experiment progresses, and as per the existing literature on public goods
(Layard, 1995) average contributions decline. We still see treatment differences consistent with
predictions, but they are no longer significant. Another interesting feature of the data is the fact
that we find no statistical significant differences in contributions to the public good. Although
initially minorities appear to make higher contributions, the difference disappears over time, as
Why is the impact of social identity not sustained over the course of the experiment? One
potential answer could lie in the size of the group of players contributing to the public good, six.
We find this implausible, as both the level of contributions and the pattern of contributions over
the course of the experiment, and in particular our control experiment is no different to that of
Fehr and Gaechter (2000), who report data with the same parameterization and four participants
per group.
Another potential cause could lie in the fact that the way in which we induced group identity
was not sufficiently strong. While this is possible, we believe that our design was actually a robust
way to elicit identity. Eckel and Grossman (2005) study the effect of different procedures on eliciting
group identity and the subsequent effect on behavior in a team production game similar to a public
good game. In one of their “stronger identity” treatments (ID4), subjects had to complete a task
once they had been randomly allocated to a team. Our design shares similar characteristics and it
also features the fact that individualschose the groups to which they were allocated, rather than
being randomly determined. This design was also employed by Chen and Li (2009), where they
study the effect of social identity on simple distribution games. The authors find a significant effect
of identity on behavior. Therefore, we do not believe that the way in which we induced group
identity is causing the dilution of the effect of identity over time.
Instead, we argue that free-riding erodes the value of belonging to a particular group over
time and leads to smaller differences between treatments towards the end of the experiment. Since
members of a particular group have no mechanism which they can use to punish or exclude
non-cooperative individuals, the only viable option is also to free-ride. Therefore, insofar as pure public
goods are concerned, the findings of the empirical literature on social fragmentation do not seem to
be replicated in the laboratory. Social diversity seems no worse than homogeneity, and sometimes
mechanisms and their effect on social fragmentation and deviations from the pure public good case.
References
[1] Akerlof, G.A., Kranton, R.E., 2000. Economics and identity. Quarterly Journal of Economics
115, pp. 715-53.
[2] Alesina, A., Baqir, R., Easterly, W., 1999. Public goods and ethnic divisions. Quarterly Journal
of Economics, 114, 1243-84.
[3] Alesina, A., La Ferrara, E., 2000. Participation in heterogeneous communities. Quarterly
Jour-nal of Economics 115, 847-904.
[4] Alesina, A., La Ferrara, E., 2005. Ethnic diversity and economic performance. Journal of
Economic Literature 43, 721-761.
[5] Bannerjee, A, Iyer, L., Somanathan, R., 2005. History, social divisions and public goods in
rural India. Journal of the Economic Economic Association 3, 639-647.
[6] Brewer, M. B., 1979. Ingroup bias in the minimal intergroup situation: A
cognitive-motivational analysis. Psychological Bulletin 86, 307-324.
[7] Charness, G., Rigotti, L., Rustichini, A. 2007. Individual behavior and group membership.
American Economic Review 97, 1340-1352.
[8] Chen, Y., Li, S. X. 2009. Group identity and social preferences. American Economic Review
99, 431-457.
[9] Currarini, S., Jackson, M.O., Pin, P., 2009. An economic model of friendship: homophily,
[10] Eckel, C.C., Grossman, P.J., 2005. Managing diversity by creating team identity. Journal of
Economic Behavior and Organization 58, 371-392.
[11] Easterley, W., Levine, R., 1997. Africas growth tragedy: policies and ethnic divisions.
Quar-terly Journal of Economics. 112, 1203-1250.
[12] Fehr, E., Gaechter, S., 2000. Cooperation and punishment in public goods experiments.
Amer-ican Economic Review 90, 980-994.
[13] Fischbacher, U. 1997. z-Tree: Zurich Toolbox for Ready-made Economic experiments.
Exper-imental Economics 10, 171-178.
[14] Kramer, R., Brewer, M., 1984. Effects of group identity on resource use in a simulated commons
dilemma. Journal of Personality and Social Psychology 46, 1044-1057.
[15] Luttmer, E.F.P., 2001. Group loyalty and the taste for redistribution. Journal of Political
Economy 109, 500-528.
[16] Mueller, D.C. 2003. Public Choice III. Cambridge, Cambridge University Press.
[17] Putnam, R. D., 2007. E Pluribus Unum: Diversity and Community in the Twenty-first Century
– The 2006 Johan Skytte Prize. Scandinavian Political Studies 30, 137-174.
[18] Sen, A. K., 2006. Identity and Violence: The Illusion of Destiny (Issues of Our Time), New
York, W. W. Norton.
[19] Shayo, M., 2009. A model of social identity with an application to political economy: nation,
class and redistribution. American Political Science Review 103, 147-174.
[20] Tajfel, H., Billig, R., Bundy, R., Flament, C., 1971. Social categorization in intergroup
[21] Tajfel, H., Turner, J.C., 1979. An integrative theory of intergroup conflict. In W.G. Austin and
S. Worchel (eds), The Social Psychology of Intergroup Relations. Monterey, CA: Brooks/Cole,
33-47.
[22] US Census Bureau 2009. An Older and More Diverse Nation by Midcentury, available
at http://www.census.gov/newsroom/releases/archives/population/cb08-123.html. Last
ac-cessed 05/062010
[23] US Census Bureau 2009. Census Bureau Estimates Nearly Half of Children Under Age 5 are
Mi-norities, available at:
http://www.census.gov/newsroom/releases/archives/population/cb09-75.html. Last accessed 05/062010
[24] Wit, A.P., Wilke, H.A.M., 1992. The effect of social categorization on cooperation in three
types of social dilemmas. Journal of Economic Psychology 13, 135-151.
Appendix 1: Participants’ Instructions
Instruction Set
Welcome to our experiment. Please remain silent during the course of the experiment. If you
have any questions, please raise your hand.
You will now take part in a decision-making experiment. The amount you will receive for
participating will depend on your decisions and the decisions of other participants.
There will be 2 parts to this experiment. Before each part of the experiment begins, you will
receive a set of instructions explaining the details of that particular part.
Once you complete all the decisions in a given part, we will move to the next part of the
experiment. You will only receive information about the outcome of your choices at the end of the
Your payoff in this experiment will be equal to the sum of payoffs in each of the individual
parts. The payoffs throughout the experiment will be denominated in Experimental Currency Units
(ECU); 1 ECU is worth 12 pence. Once the experiment ends, your payoff will be calculated and
you will receive your payment in cash.
Part 1
In this part we will show you five pairs of paintings by two artists. For each pair of paintings,
you must choose the one you prefer.
Once everyone makes their five choices, we will divide participants into two groups according
to which artist they preferred.
Once you have been allocated to one of the groups, we will show you a further two paintings.
Your task will be to identify which artist painted which painting.
You will be allowed to confer with your fellow group members in order to determine the
answer to the two questions. To this effect, you will have access to a chat programme, through
which you can offer help or get help from your fellow group members.
Messages you post in the chat box will only be visible to members of your own group. You
will not be able to see the messages posted by members of the other group and vice-versa.
You will be able to communicate with your fellow group members for 10 minutes before
submitting your answers. You are free to post how many messages you like.
There are only two restrictions on messages: you may not post messages which identify
yourself (e.g. age, gender, location etc.) and you may not use offensive language.
For each correct answer you will earn 10 ECU.
You will only be informed of your payoff in this part of the experiment at the very end of the
session.
Part 2 (only seen by subjects after the previous task was complete)
In this part of the experiment you will be matched with five other participants. You will be
interacting with the same five participants until the end of the experiment.
There will be 20 rounds in this part of the experiment. At the beginning of each round, each
participant will receive 20 ECUs. We will call this your endowment. Your task in each round is
to decide how to use your endowment. You must decide how many ECUs you want to contribute
to a project and how many you want to keep for yourself. The consequences of your decision are
explained in detail below.
Your payoff is given by the following formula:
Your Payoff = (20 ECU Your Contribution) + (0.4*Total Contribution)
This formula implies that your payoff in every round is based on two parts: 1) The ECUs
you kept for yourself: (20 ECU Your contribution). 2) The income from the project, which is 40%
of the total contribution from you and from the other five participants.
The payoff of each of the six participants is calculated in the same way. This means that the
income from the project is the same for everyone.
To fix ideas, lets consider a few numerical examples. Suppose that the total contribution to
the project is 60 ECU. In this case, each of the six participants receives an income from the project
of 0.4*60=24 ECU. If instead the total contribution to the project is 9 ECU, then each of the six
participants will receive an income of 0.4*9=3.6 ECU from the project.
Each ECU you keep to yourself raises your payoff by 1 ECU. Each ECU you contribute to
project to rise by 0.4*1=0.4 ECU. The income of the other five participants will also rise by 0.4
ECU, so that the total income of the six participants from the project will go up by 2.4 ECU. Your
contribution to the project therefore also raises the income of the other participants. Conversely,
contributions to the project by other participants also raise your income; for each ECU contributed
by another participant, you earn 0.4*1=0.4 ECU.
Remember that ECUs earned in one round do NOT carry over to subsequent rounds. You
will start every round with the same endowment of 20 ECUs.
Once all participants have made their decisions, you will be informed about your decision,
the decision of each participant, the total amount of ECUs contributed to the project and your
payoff.
You will also know whether each person with whom you are playing belongs to either the
Kandinsky or the Klee group, but not their exact identity. To this effect, the computer will scramble
the order in which the other participants are listed when individual contributions are shown at the
end of every round.
Once the 20th round is over, the experiment will be over. The computer will select two
rounds at random. Your payoff in those two rounds plus the payoff from part 1 will determine your
total earnings in the session.
Appendix 2: Proofs
Proof: A function f(xi, θi) has increasing differences if for some parameter θ1 ≥θ2 and variable
x1 ≥ x2, f(x1, θ1)− f(x2, θ1) ≥ f(x1, θ2)− f(x2, θ2), for all x and θ. Consider player i′s own
contribution ci and others’ contribution cg, for cg = cIg and cg = cOg. Here we can see that
Ui(ci, cg) has increasing differences in (ci, cg) for all ci and cg. Let ci1 ≥ ci2 and cg1 ≥ cg2 then
Specifically, given the linear monetary payoffs,yi−ci+ (0.4)Pjcj,and everything else being
the same, the inequality is satisfied. Note that the inequality will be true both for other in-group
contribution (cIg) and other out-group contribution (cOg), since player i will gain positive utility
from both in-group contribution and non-negative utility from out-group contribution.
For (ci, Sg),note that it is assumed from the behavioral assumptions regarding the role of
the social identity, that is, utility increases with status, Si. Therefore we can say, for Si′ ≥ Si
Ui(Si′, ci1)−Ui(Si, ci1)≥Ui(Si, ci2)−Ui(Si′, ci2) for ci1 ≥ci2.
This implies that Ui is increasing in (ci, Sg), as long as Og = 0 or6 Ig+IgOg ∈ [0,1). Finally
we know that as Si increases the distance dij decreases monotonically. So since Ui is increasing
in (ci, Sg), Ui is increasing in (ci,−dij). Using Topkis (1998), given increasing differences for all
the variables and parameters, with preferencesUi(yi, ci, cIg, cOg, Sg, dij(Sg)) there is an equilibrium
c∗i(yi, ci, cIg, cOg, Sg, dij(Sg)).Note that given the assumption of Ui is increasing in (ci, Sg),due to
symmetry rearranging we can write Ui(ci1, Si′)−Ui(ci2, Si′) ≥ Ui(ci1, Si)−Ui(ci2, Si), for Si′ ≥ Si