Munich Personal RePEc Archive
Does physical capacity explain the height
premium?
Böckerman, Petri and Johansson, Edvard and Kiiskinen,
Urpo and Heliövaara, Markku
19 January 2010
Online at
https://mpra.ub.uni-muenchen.de/20108/
T A M P E R E E C O N O M I C W O R K I N G P A P E R S
N E T S E R I E S
DOES PHYSICAL CAPACITY EXPLAIN THE HEIGHT PREMIUM?
Böckerman Petri, Johansson Edvard,
Kiiskinen Urpo, Heliövaara Markku
Working Paper 74
January 2010
http://tampub.uta.fi/econet/wp74-2010.pdf
DEPARTMENT OF ECONOMICS AND ACCOUNTING
FI-33014 UNIVERSITY OF TAMPERE, FINLAND
Does physical capacity explain the height premium?
Petri Böckerman*, Edvard Johansson**, Urpo Kiiskinen*** and Markku Heliövaara***
* Labour Institute for Economic Research and University of Tampere, [email protected]
** The Research Institute of the Finnish Economy, University of Jyväskylä, and Helsinki Centre for Economic Research (HECER), [email protected] *** National Institute for Health and Welfare, [email protected]
*** National Institute for Health and Welfare, [email protected]
Abstract
The paper examines the role of physical capacity in the determination of the height premium by using the “Health 2000 in Finland” data that contain both self-reported information on the physical strenuousness of work, and information on muscle mass from medical examinations. Our results show that the height premium does not vary according to the physical strenuousness of work. We also find that muscle mass is not related to wages. Furthermore, we observe that the shortest men do physically very demanding work and the tallest do sedentary work, even after controlling for the effects of age and education.
JEL classification: I10, J23, J31
1. Introduction
Non-economic attributes are widely rewarded (e.g. Komlos, 1990; Hamermesh and Biddle, 1994; Mocan and Tekin, 2010). Several empirical studies document the fact that height has a statistically and economically significant positive influence on labour market outcomes such as earnings (e.g. Judge and Cable, 2004; Heineck, 2005; Hübler, 2009).1 There are many potential explanations for this observation. Some authors argue that the pattern arises because height is associated with non-cognitive skills (e.g. Persico et al., 2004). Non-cognitive skills refer mainly to social skills. On the other hand, other authors maintain that cognitive skills are more important contributors to the height premium (e.g. Case and Paxson, 2008a, 2008b). In particular, Case and Paxson (2008a) show that 30-50% of the height premium can be attributed to cognitive ability that is measured in childhood and youth. The effect of height on labour market outcomes remains a puzzle because of this conflicting evidence.
In a recent contribution, Lundborg et al. (2009) argue that the positive effect of height on earnings can largely be explained by the fact that there is a positive association between height and physical capacity. Lundborg et al. (2009) demonstrate that physical capacity explains 80% of the observed height premium in Sweden. Lundborg et al. (2009) propose multiple explanations for this finding. They include physical capacity being a health marker, being perceived as attractive, and being a signal of demanded personality traits.
dependent on physical capacity in all developed countries. The effect of height on earnings through physical capacity would also be a rather surprising pattern in the sense that one of the best known stylized facts of labour market development is that the relative labour market position of low-skilled workers has declined sharply in industrialized countries during the past few decades (e.g. Autor et al., 2008). Most of those low-skilled workers hold jobs that are physically strenuous, at least to some degree. However, besides the explanations proposed by Lundborg et al. (2009), there is also evidence that individuals who are engaged in leisure sport activities receive higher wages (e.g. Ewing, 1998; Cornelissen and Pfeifer, 2007; Lechner, 2009). This premium is not related to specific, physically demanding job tasks, but it could, for instance, reflect the fact that individuals with better fitness can endure more effective working hours or have fewer sick absence days. Hence, the premium is not exclusive to certain occupations. Instead, it is rather general in character.
2. Data
This study is based on the Health 2000 population survey data set.2 (Aromaa and Koskinen, 2004, provide a description of the data set.) This data set has been constructed in order to give a comprehensive picture of the health and functional ability of the working-age and old-age Finnish population. The basic data set comes from a random sample of 10,000 individuals from the entire country, and the information was collected between September 2000 and June 2001 by means of personal interviews, telephone interviews, and professional health examinations. Supplementary information was obtained from various government registers.
Annual individual wage data originating from the Finnish tax authorities have been linked to the Health 2000 data set, using the personal identification number that every person residing in Finland has.5 Many of the earlier studies on height premium have used survey-based information on earnings that is prone to non-response and reporting bias.6 The stratified sampling framework is accounted for in our empirical analyses, as we use survey data methods and appropriate weights in estimations.
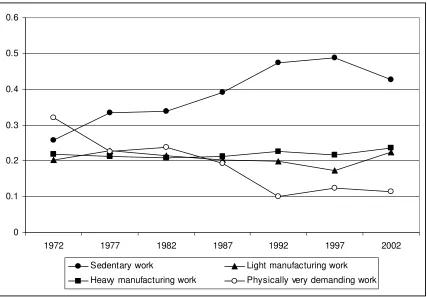
The data set contains self-reported information on the physical strenuousness of the respondents’ work in which they are currently employed. Four alternative answers with examples of typical occupations in each of them were given to the respondents. The first alternative was chosen if the person had sedentary work: a job involving little walking during a typical working day. (Examples of occupations belonging to this particular category include watchmaking and office work.) Sedentary work is used as a reference group in the estimations. The second alternative involved jobs that entailed quite a lot of walking, but no lifting or carrying of heavy objects. (The examples include supervising and light manufacturing work.) The third alternative was for jobs involving a lot of walking and lifting. (The examples include carpentry and heavy manufacturing work.) The fourth alternative included physically very demanding work involving lifting and carrying heavy objects. (The examples include logging and heavy farm work.)
persons. That being said, it is important to note that the question that we use is not in the general form “Is your current job physically strenuous?” with answers, for example, from 1 to 4. On the other hand, the question involves detailed examples of occupations that come under each of those four categories. These examples of occupations were mentioned to the respondents at the time of the interview. For example, sedentary work was described to the respondents as work that includes occupations such as watchmaking and office work. This should reduce the bias in our self-reported measure of the physical strenuousness of work.
instance, between countries or over time (King et al., 2004). In other words, it is possible that individuals’ views of what constitutes a physically strenuous job has changed over time, but it is less likely that individual opinions whether, for instance, office work constitutes sedentary work has changed over time. These points support the validity of our self-reported measure of the physical strenuousness of work. It is also useful to note that sedentary work is identified by using self-reported information in other studies (e.g. Mummery et al., 2005; Bernaards et al., 2006).
Fig. 1 here
3. Empirical strategy and results
To explore the occupational sorting in terms of height, we begin by running OLS regressions of the following form:
(1) Heighti =b0+b1D(Strenuousnessi)+b2Xi+ei
In equation (1) the variables of our interest are the three indicators for the physical strenuousness of work. D(.) denotes indicator variables. Xis a vector of individual-level control variables including age and education.
To examine the potential contribution of physical capacity and physical strenuousness of work to the height premium we estimate models of the form:
(2) logwagei =b0+b1Heighti+b2D(Strenuousnessi)
i i i
i D Strenuousness
Height e
b ´ + +
+ 3 ( ) b4X
The models are reported both without and with educational levels, because education is not always determined before the labour market entry (Lundborg et al., 2009; Neal and Johnson, 1996).9 We report all estimates separately for men and women, because of the social norm and occupational structure differences between men and women. Our expectation is that physical capacity should be a more important determinant of men’s wages. However, it is also interesting to study the effects on women’s wages, because Lundborg et al. (2009) do not consider women’s wages, owing to the fact that they use data from the military enlistment register.
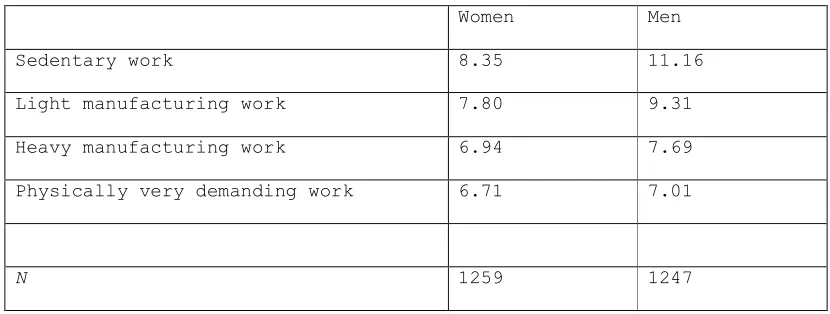
Table 1 documents descriptive statistics. The occupational structure differences are striking between women and men. The share of wage and salary earners in physically very demanding work is 3% and 12% for women and men, respectively. Regarding the control variables we observe that women are, on average, better educated than men, with 19% of women and 16% of men having an academic degree. Table 2 reveals that there is a negative association between the physical strenuousness of work and wages. Thus, wages are substantially higher at sedentary work compared with physically very demanding work.10
Tables 1-2 here
significant positive correlation between height and muscle mass. These patterns are similar for women (Panel A) and men (Panel B).
Table 3 here
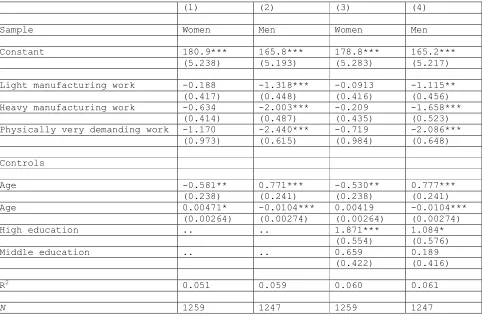
Table 4 reveals an interesting pattern according to which the shortest Finnish workers perceive to do physically very demanding work and the tallest perceive to do sedentary work. In particular, the regression results in Column 4 of Table 4 show that those men doing physically very strenuous work are, on average, roughly 2 cm shorter than those doing sedentary work, even after controlling for the effects of age and education. It is important to note that this pattern is not inconsistent with the findings by Lundborg et al. (2009), because they find some evidence that taller men do sort themselves into higher paying occupations. For women the picture is different (Table 4, Columns 1 and 3), i.e. the physical strenuousness of work is not related to height, after taking into account the effects of the control variables.
Table 4 here
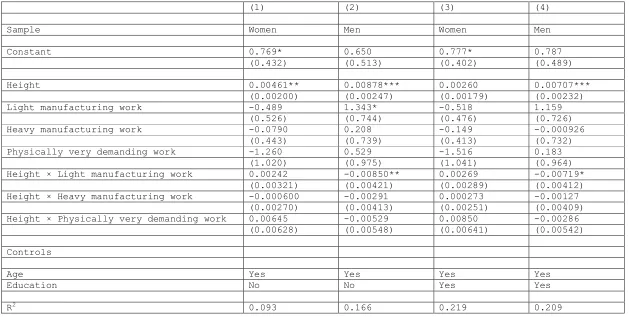
only statistically significant coefficients prevail for men in light manufacturing work. For women not even this effect prevails. All in all, there is no systematic evidence that the height premium is larger for those doing physically more strenuous work. It is important to note that the findings of Lundborg et al. (2009) do not necessarily predict that the height premium is largest in work that is physically strenuous. Instead, physical capacity may constitute a signal for good health. This implies that it should be rewarded to a greater extent in higher paid white-collar occupations. Our results point out that the height premium does not vary according to the physical strenuousness of work. To check the robustness, we have estimated the models in Table 5 by adding weight to the set of controls. The results remain the same. In addition, we have aggregated the four categories of the physical strenuousness of work to three alternatives by merging light and heavy manufacturing work. We have also used only one single indicator that captures sedentary work. Furthermore, we have estimated separate regressions for each level of the physical strenuousness of work. The conclusions do not change.
Table 5 here
Table 6 here
4. Conclusions
Height premium is widely reported. This paper contributes to the literature by studying the role of physical capacity and the physical strenuousness of work as a determinant of the height premium. Lundborg et al. (2009) argue that the positive effect of height on earnings can largely be explained by the fact that there is a positive association between height and physical capacity. We evaluate the role of physical capacity in the determination of the height premium by using the “Health 2000 in Finland” data that contain both self-reported information on the physical strenuousness of work, and information on muscle mass from medical examinations.
Acknowledgements
References
Aromaa, A., Koskinen, S. (Eds.), 2004. Health and Functional Capacity in Finland. Baseline Results of the Health 2000 Health Examination Survey. Publications of the National Public Health Institute, Helsinki, B12/2004.
Autor, D.H., Katz, L.F., Kearney, M.S., 2008. Trends in U.S. wage inequality: Revising the revisionists. Review of Economics and Statistics 90, 300-323.
Bernaards, C.M., Jans, M.P., van den Heuvel, S.G., Hendriksen, I.J., Houtman, I.L., Bongers, P.M., 2006. Can strenuous leisure time physical activity prevent psychological complaints in a working population? Occupational and Environmental Medicine 63, 10-16.
Burkhauser, R.V., Cawley, J., 2008. Beyond BMI: The value of more accurate measures of fatness and obesity in social science research. Journal of Health Economics 27, 519-529.
Burkhauser, R.V., Cawley, J., Schmeiser, M.A., 2009. The timing of the rise in U.S. obesity varies with measure of fatness. Economics and Human Biology 7, 307-318.
Case, A., Paxson, C., 2008a. Stature and status: Height, ability, and labor market outcomes. Journal of Political Economy 116, 499-532.
Case, A., Paxson, C., 2008b. Height, health, and cognitive function at older ages. American Economic Review 98, 463-467.
Cohen, A., 2009. The Tall Book. A Celebration of Life from on High. Bloomsbury, New York.
Cornelissen, T., Pfeifer, C., 2007. The impact of participation in sports on educational attainment: New evidence from Germany. IZA Discussion Paper No. 3160.
Deaton, A., Arora, R., 2009. Life at the top: The benefits of height. Economics and Human Biology 7, 133-136.
Ewing, B.T., 1998. Athletes and work. Economics Letters 59, 113-117.
Hamermesh, D., Biddle, J., 1994. Beauty and the labor market. American Economic Review 84, 1174-1194.
Hübler, O., 2009. The nonlinear link between height and wages in Germany, 1985-2004. Economics and Human Biology 7, 191-199.
Johansson, E., Böckerman, P., Kiiskinen, U., Heliövaara, M., 2009. Obesity and labour market success in Finland: The difference between having a high BMI and being fat. Economics and Human Biology 7, 36-45.
Judge, T.A., Cable, D.M., 2004. The effect of physical height on workplace success and income: Preliminary test of a theoretical model. Journal of Applied Psychology 89, 428
-441.
King, G., Murray, C., Salomon, J., Tandon, A., 2004. Enhancing the validity and cross-cultural comparability of measurement in survey research. The American Political Science Review 98, 191-207.
Komlos, J., 1990. Height and social status in eighteenth-century Germany. Journal of Interdisciplinary History 20, 607-621.
Lechner, M., 2009. Long-run labour market and health effects of individual sports activities. Journal of Health Economics 28, 839-854.
Mocan, N., Tekin, E., 2010. Ugly criminals. Review of Economics and Statistics, Forthcoming.
Mummery, W.K., Schofield, G.M., Steele, R., Eakin, E.G., Brown, W.J., 2005. Occupational sitting time and overweight and obesity in Australian workers. American Journal of Preventive Medicine 29, 91-97.
Neal, D., Johnson, W., 1996. The role of premarket factors in black-white wage differences. Journal of Political Economy 104, 869-895.
Persico, N., Postlewaite, A., Meyers, C., 2004. The effect of adolescent experience on labor market outcomes: The case of height. Journal of Political Economy 112, 1019-1053.
Scharfetter, H., Schlager, T., Stollberger, R., Felsberger, R., Hutten, H., Hinghofer-Szalkay, H., 2004. Assessing abdominal fatness with local bioimpedance analysis: Basics and experimental findings. International Journal of Obesity 25, 502-511.
Fig. 1. Self-reported information on the physical strenuousness of work for men, proportions, over the period 1972-2002.
0 0.1 0.2 0.3 0.4 0.5 0.6
1972 1977 1982 1987 1992 1997 2002
Sedentary work Light manufacturing work
Heavy manufacturing work Physically very demanding work
Note: The figure is drawn for men who are wage and salary earners and aged 30-64 covering the data from two
provinces in Eastern Finland.
Table 1
Descriptive statistics.
Women Men
Mean St. Dev. Mean St. Dev.
Hourly wages (€) 7.70 2.96 9.38 7.37
Logarithm of hourly wages 1.99 0.31 2.14 0.42
Height (cm) 164.37 6.22 177.89 6.61
Weight (kg) 69.60 13.26 84.48 13.89
Muscle mass (kg) 45.15 5.43 63.09 8.00
Sedentary work 0.43 0.49 0.41 0.49
Light manufacturing work 0.29 0.45 0.24 0.43 Heavy manufacturing work 0.24 0.43 0.22 0.42 Physically very demanding work 0.03 0.17 0.12 0.33
Age (years) 44.04 8.08 43.44 8.14
High education 0.19 0.39 0.16 0.36
Middle education 0.57 0.50 0.45 0.50
Low education 0.24 0.43 0.39 0.49
N 1259 1247
20
Table 2
The mean level of hourly wages (€) at the different levels of the physical strenuousness of work.
Women Men
Sedentary work 8.35 11.16
Light manufacturing work 7.80 9.31
Heavy manufacturing work 6.94 7.69
Physically very demanding work 6.71 7.01
Table 3
Correlations.
Logarithm of hourly
wages Height Weight
Muscle mass
Panel A: Women
Logarithm of hourly wages 1
Height 0.0947* 1
Weight 0.0119 0.2581* 1
Muscle mass 0.0482 0.6268* 0.8312* 1
Panel B: Men
Logarithm of hourly wages 1
Height 0.118* 1
Weight 0.0790 0.4407* 1
Muscle mass 0.0762 0.7037* 0.8701* 1
22
Table 4
The relationship between height and the physical strenuousness of work. Estimation method: OLS, dependent variable is height.
(1) (2) (3) (4)
Sample Women Men Women Men
Constant 180.9*** 165.8*** 178.8*** 165.2***
(5.238) (5.193) (5.283) (5.217)
Light manufacturing work -0.188 -1.318*** -0.0913 -1.115** (0.417) (0.448) (0.416) (0.456) Heavy manufacturing work -0.634 -2.003*** -0.209 -1.658***
(0.414) (0.487) (0.435) (0.523) Physically very demanding work -1.170 -2.440*** -0.719 -2.086***
(0.973) (0.615) (0.984) (0.648)
Controls
Age -0.581** 0.771*** -0.530** 0.777***
(0.238) (0.241) (0.238) (0.241)
Age 0.00471* -0.0104*** 0.00419 -0.0104***
(0.00264) (0.00274) (0.00264) (0.00274)
High education .. .. 1.871*** 1.084*
(0.554) (0.576)
Middle education .. .. 0.659 0.189
(0.422) (0.416)
R2 0.051 0.059 0.060 0.061
N 1259 1247 1259 1247
Note: The reference category is sedentary work.
Table 5
The relationship between height, the physical strenuousness of work and wages. Estimation method: OLS, dependent variable is logarithm of hourly wages.
(1) (2) (3) (4)
Sample Women Men Women Men
Constant 0.769* 0.650 0.777* 0.787
(0.432) (0.513) (0.402) (0.489)
Height 0.00461** 0.00878*** 0.00260 0.00707***
(0.00200) (0.00247) (0.00179) (0.00232)
Light manufacturing work -0.489 1.343* -0.518 1.159
(0.526) (0.744) (0.476) (0.726)
Heavy manufacturing work -0.0790 0.208 -0.149 -0.000926
(0.443) (0.739) (0.413) (0.732)
Physically very demanding work -1.260 0.529 -1.516 0.183
(1.020) (0.975) (1.041) (0.964)
Height × Light manufacturing work 0.00242 -0.00850** 0.00269 -0.00719* (0.00321) (0.00421) (0.00289) (0.00412) Height × Heavy manufacturing work -0.000600 -0.00291 0.000273 -0.00127
(0.00270) (0.00413) (0.00251) (0.00409) Height × Physically very demanding work 0.00645 -0.00529 0.00850 -0.00286
(0.00628) (0.00548) (0.00641) (0.00542)
Controls
Age Yes Yes Yes Yes
Education No No Yes Yes
24
N 1259 1247 1259 1247
Note: The reference category is sedentary work.
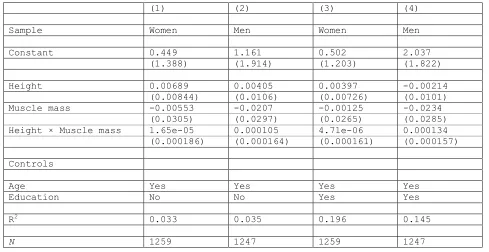
Table 6
The relationship between height, muscle mass and wages. Estimation method: OLS, dependent variable is logarithm of hourly wages.
(1) (2) (3) (4)
Sample Women Men Women Men
Constant 0.449 1.161 0.502 2.037
(1.388) (1.914) (1.203) (1.822)
Height 0.00689 0.00405 0.00397 -0.00214
(0.00844) (0.0106) (0.00726) (0.0101) Muscle mass -0.00553 -0.0207 -0.00125 -0.0234
(0.0305) (0.0297) (0.0265) (0.0285) Height × Muscle mass 1.65e-05 0.000105 4.71e-06 0.000134
(0.000186) (0.000164) (0.000161) (0.000157)
Controls
Age Yes Yes Yes Yes
Education No No Yes Yes
R2 0.033 0.035 0.196 0.145
N 1259 1247 1259 1247
26
1
Cohen (2009) has popularized this research. Deaton and Arora (2009) show that taller persons are also happier.
2
The data set is available from the National Public Health Institute in Finland (see http://www.terveys2000.fi/indexe.html).
3
The effective sample size before the restrictions is 7998. 3515 of these persons are wage and salary earners aged between 30 and 64.
4
The official retirement age in Finland is 64. However, the actual retirement age is approximately 60 years.
5
The data set originates from the Finnish tax administration (see http://www.vero.fi/).
6
Lundborg et al. (2009) use register data on wages.
7
The increase in the share of manufacturing work over the period 1997-2002 can be explained by the fact that the recovery from the great depression of the early 1990s in
Finland was largely based on the expansion of manufacturing exports.
8
Wada and Tekin (2007) estimate models for wages that include fat-free mass as an explanatory variable. They observe that fat-free mass is associated with an increase in the
wages of white men and white women.
9
It is important to note that we use data for individuals aged 30-64. The level of education is determined for most of the individuals in Finland before the age of 30.
10
11
Johansson et al. (2009) have earlier reported the existence of height premium by using the Health 2000 data set.
12
We have estimated the models also by using quantile regression methods. Estimating several quantiles makes it possible to explore the shape of the conditional distribution,
not just its mean. We have estimated the models for the 10th, 25th, 50th and 75 th quantiles. The point estimates suggest that the effect of height on wages for both women and
men is larger in the highest wage quantiles than at the lower tail of the distribution. However, owing to the relatively small sample size the differences are generally not
statistically significant. Lundborg et al. (2009) observe that the return to an additional centimetre in height is larger further away from the median earnings.
13
To explore the nonlinear effects, we divided muscle mass into four discrete categories that each have equal number of observations. Muscle mass does not have positive