Visualizing Narrative Structures and Learning Style Information in
Personalized e-Learning Systems
Fionán Peter Williams and Owen Conlan
Knowledge and Data Engineering Group, Trinity College, Dublin
[email protected], [email protected]
Abstract
This paper proposes a novel approach to the visualization of complex, but interrelated, sets of information to ease user cognition. Principally, it explores the potential of providing users of personalized e-Learning systems with a means of visualizing the complex space in which they learn, with the aim of supporting the development of meta- cognitive insight pertaining to their individual learning style. It also provides course authors with a novel means of understanding how learners used their courses over time, thereby enabling them to detect usage patterns and diagnose problems.
1.
Introduction
Much of the information logged and stored about a user, such as access logs and personal profiles, does not lend itself to easy scrutiny or interpretation by humans. By reflecting on the contents of these files users, particularly learners engaged in e-Learning courses, could gain valuable insights into their actions. The problem thus is to find techniques to represent this data in a way that allows users to quickly assimilate key relationships and acquire knowledge efficiently from it.
In e-Learning applications narrative can be described as the sequence of a learning experience composed from a pool of available learning objects or services. In personalized e-Learning systems the course is composed on a per user basis, either once before course commencement or dynamically during course execution. This can lead to the generation of a large volume of uncorrelated data about the usage of these systems, which usually means it is never accessed and is therefore rendered useless.
Text based file formats such as XML files, while human readable, are not conducive to the rapid assimilation of large sets of information such as server access logs where the access histories of many users
are interleaved in large files. Correlation of these access histories with the generated narrative structures and subsequent interpretation is a task which has many potential benefits for users, course authors, and those responsible for monitoring the effectiveness of on-line courses.
Through the use of visualization techniques users of adaptive e-Learning systems can be empowered by providing an ‘at a glance’ overview of the way they have interacted with the suggested course narrative. This facilitates the development of meta-cognition with regard to their individual learning style. Course authors can benefit from developing insight into the performance of the adaptive e-learning system through the correlation of many user models and access log histories with course narratives generated for individual users of the system. Course authors may find that visualization techniques also assist in the validation of the narrative structures that are matched with individual learners based on an assessment of their preferred learning style, prior knowledge, and learning goals.
In this paper a brief review of the state of the art relating to the visualization of temporally correlated data sets is presented, together with an overview of narrative structures and learner models as they are used in personalized e-Learning systems. The visual design of a prototype narrative analyzer, which displays the correlation between learner activity and the adaptive e-Learning course is then described. The prototype narrative analyzer is evaluated with the aid of a group of expert users, conclusions are drawn, and suggestions for further development and research in this area are discussed.
2.
State of the Art
2.1 Personalized e-Learning Systems
and 3DE (Design Development and Delivery Electronic Environment Educational Multimedia)[2].
Although APeLS can support any learning style model in theory, the current model in use is based on Honey & Mumford. A learning style model is generated from a learner’s responses to the standardized Honey & Mumford questionnaire [3]. 3DE generates a learner model based on the shortened form of the Honey & Mumford questionnaire. Also available in the 3DE environment is a 'learning to learn unit' which can be accessed by learners from any course that offers information about learning skills and techniques which may be suited to their learning style [4]. AHA! avoids the definition of learning style by questionnaire and aims to infer the learner's learning style by monitoring their browsing behavior [5]. All three of these systems generate logs and learner models that provide raw data suitable for visualization but currently do not make use of this potentially valuable resource.
2.2 Temporal Visualization Techniques
In the broad research area of information visualization, temporal visualizations of data have been among the more popular techniques used. Apart from countless commercial multimedia applications, a number of research projects have also used the time line as a key component of their visualization techniques.
One such system is LifeLines, a research project developed at the University of Maryland which is, in essence, “a general visualization environment for personal histories that can be applied to medical and court records, professional histories and other types of biographical data” [6]. LifeLines experiments suggest that comprehension and memory are improved by use of a visual metaphor compared to tabular representations of data.
Another research project that used a time line metaphor to represent information is ThemeRiver [7]. Its major design goal was “to provide a visualization of theme change over time” using the metaphor of a river to achieve this. Fundamentally, a collection of documents, the ThemeRiver consists of thematic streams (each representing a key term and differentiated by color) and external news events that are displayed along the time line. Changes in the width of a thematic stream correspond to the frequency the term occurs in the news.
The final project we will mention that uses the time line metaphor is TimeSpace [8], which is described as an activity based temporal visualization of personal information spaces. TimeSpace can be used alongside or in place of current systems to display users personal
files in a non-hierarchical manner. Within TimeSpace there are two main interactive visualizations, one that shows an overview of the users’ activities along a time line, and one that presents a detailed view of the files in each activity and their development. Observational studies on the use of the system revealed positive views on the temporal metaphor with many finding the visualizations provided “a context for their work... and an overview of all their work in progress”.
While each of these three projects target applications of temporal visualizations, they do not address the issues identified in the design of the prototype narrative analyzer presented in this paper. Principally these concern the correlation and display of events ordered both in logical sequence and in real time.
3. A Prototype Narrative Analyzer
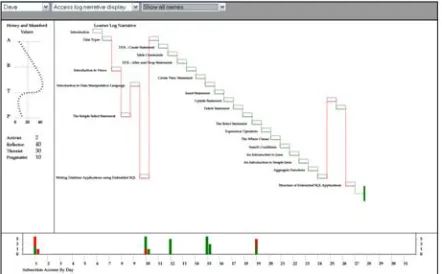
[image:2.612.319.540.406.543.2]The prototype narrative analyzer was developed as a browser based web application that aims to present the progress of individual learners relative to real-time and to the personalized course narrative generated by APeLS. The prototype analyzer was implemented using JavaScript and Scalable Vector Graphics (SVG). Data sources are the user model and narrative generated by APeLS and the Apache log of user accesses to the content server.
Figure 1. The prototype narrative analyzer.
The narrative display area is where the various permutations of the course and access log file based narrative structures are displayed. Narratives are drawn from the top left corner of the display area and extend by the width of one narrative subsection block to the right for each course narrative event or log file access narrative event. A suggested narrative is displayed as a continuous staircase of content blocks. When a learner’s logical access history is merged into this staircase display deviations from the suggested narrative showing the offset and direction of the jump relative to the nominal sequence of the narrative are shown. Jump direction may be interpreted as exploration or revision for forward or backward jumps
[image:3.612.319.540.121.164.2]respectively. Incomplete or completed narratives are also indicated. When combined with the learning style display this is the foundation on which course authors can monitor or validate important aspects of the performance of courses.
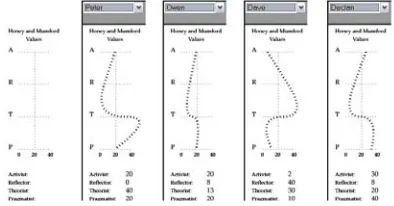
Figure 2. Four contrasting Learning Style models.
The Learning Style display area features a display of the learners' Honey & Mumford learning style classification in both numerical and graphical form and is designed to convey an 'at a glance' impression of the results given by the learner to the Honey & Mumford learning style questionnaire. Learners with dominant characteristics in any of the four Honey & Mumford learner types will have distinctive curve shapes biased towards the dominant characteristic. This feature allows for rapid assimilation of key learner characteristics which, when combined with the relevant narrative displays, aims to support learners in developing meta cognition by contrasting their self declared learning style with the reality of their interactions with the adaptive e-Learning system. Discrete values are also displayed to support more in-depth analysis of the Honey & Mumford learning style characteristics.
The Time Line display area shows the access log history based on the number of accesses by day. This display is scaled vertically based on the maximum number of accesses on any one day and horizontally
[image:3.612.83.280.248.351.2]based on the number of days included in the access log file being examined.
Figure 3. The Timeline display area.
The visual link between the time line and the narrative displays is deliberately broken. This separation reinforces the distinction between the logical time of the narrative display, whereby individual narrative subsection blocks are consistently sized relative to each other in a nominal left to right direction of time flow, and the absolute distribution of the access history events against time elapsed as shown in the time line display, as can be seen in figure 1.
4. Evaluation
The prototype narrative analyzer was designed and implemented for use in a series of evaluation interviews. The artifact can be accessed online at [10]. Four sample learner histories, models, and narratives derived from actual APeLS data models and logs were created for the purpose of evaluation that exhibited contrasting activity histories and Honey & Mumford classifications. A set of evaluation interviews were conducted with three e-Learning course designers based at Trinity College with the aim of collecting qualitative and anecdotal evidence. Each interviewee was first given an introduction to the narrative analyzer, its key functionality, and features. The introduction consisted of a short slide show highlighting the visual features of the prototype design and the data sources used to compile the visualization, followed by 'hands on' familiarization. Responses to individual questions were not the sole focus of the interviews. The structure of the series of questions was designed to prompt a wider ranging discussion that could evaluate the prototype not just with reference to the artifact presented, but also of the potential for the visualization techniques employed. All interviews were recorded and responses tabulated for comparison and analysis.
1.Encapsulate knowledge about learner behavior patterns and highlight key events in the correlated course narrative. 2. Illustrate the correlation between learning style models and real world behavior patterns. Answers to the first series of questions were determined by 'hands on' use of the prototype.
The second section of the interviews followed the form of a series of questions designed to explore the potential application of the narrative visualization techniques incorporated in the prototype in order to: 1.Provide individual learners with a feedback mechanism that would enable the development of meta-cognition with regard to their learning style. 2.Empower course designers with visualization tools intended not only for post hoc analysis of access logs, but as part of the suite of design time tools. Questions addressed topics such as, “Do you think that developing meta-cognition with regard to their individual learning style would help learners to approach learning differently or with greater insight?” and “As a course designer, would filtering the set of learners being analyzed based on learning style assist you to detect trends in learner behavior and thus to modify course elements or structure? “. Answers to the second series of questions were determined through discussion and reference to the prototype.
4.1 Evaluation outcomes – Section 1
Those interviewed shared the view that the application of visual data mining techniques to access logs could provide a new perspective on the way real world learners interact with the adaptive e-Learning environment. Questions formulated to investigate if narrative visualizations can form the basis for the development of higher-level insight into learner behavior included “What does the incomplete narrative of learner Peter suggest to you?” and “What does user Declan’s time line tell us about his learning style as contrasted with user Peter’s time line”. Responses to these kinds of questions were wide ranging, reflecting the subjective characteristics of the many possible answers to some of them. This subjectivity itself gave rise to the comment that the narrative analysis highlighted behavior that prompted questions that might not otherwise be asked. For instance an early termination of the narrative suggested that this type of event might prompt an email from the administrators, or that another level of correlation taking into account attendance records could be justified.
The question asking interviewees to identify access patterns that might indicate revision showed that more than one learner made use of backward jumps. It was clear that one learner had clearly revised while the other had simply been exploring the course. This was
evidenced by the timing of the narrative jumps relative to the course narrative. This question revealed how insight that delves deeper than the literal history of 'what happened when' could be developed by correlating the timeline with the patterns of access across multiple learners.
Interestingly, two of the three interviews conducted gave rise to attempts to categorize the Honey & Mumford curve display by relating them to shapes such as waves and noses. Also, the nature of forward and backward jumps was described as visually reminding one interviewee of stalagmites and stalactites. Questions answered by reference to individual learning styles uncovered the issue that individual subsections of the course narrative might be categorized according to the 'conceptual load' they carry i.e. how many new concepts are introduced in this subsection? This factor could have a direct correlation with the resulting access pattern if learning new concepts prompts revision or exploration. It was, however, pointed out as being very positive that the exposure of this issue was the result of using the narrative analyzer prototype as it stands.
4.2 Evaluation Outcomes – Section 2
The comment from one interviewee, “teachers like content not process”, prompted the assertion that one valuable spin-off deriving from the inclusion of a narrative analyzer in a course development tool kit could be to focus the attention of course designers not just on the content being prepared but on the process by which learners interact with it. All three interviews featured some discussion of the match between the learner model and the correlated course narrative. The degree to which the two match in live courses is not known. To determine a higher-level correlation like this would, it was suggested, involve the definition of meaningful statistics derived from a significant number of learner access histories by reference to their defined learning styles.
relating to the finer grained learning objects within subsections of the course narrative were discussed. Allied to this point, feedback relating to the amount of time learners addressed an individual learning object would add an extra dimension to the analysis.
All were positive about the uncluttered appearance of the narrative analysis display and were keen that it should not become overcomplicated, thus potentially negating the benefits. One interviewee asked, “If learners know their access pattern is going to be analyzed would that change the way they access?” No clear answer to this question can be determined at this stage of development. However, it was felt that in general individual learners would ignore the potential surveillance of their use of the e-Learning system, and that furthermore they might expect the system to be deriving information from learner's experiences. Another observation concerned the potential for some learners to become 'expert learners', focused on the process of learning rather than the course material. To balance this possibility one interviewee made the observation that “Insight is never wasted. We inform our future decisions based on insight into our past successes and failures”. The possibility for learners to develop meta- cognition with regard to their learning style could benefit course designers by enabling learners to provide more accurate or insightful feedback.
Also mentioned was the possible improvement in the accuracy of learning style definition due to the feedback provided by the narrative analysis. No negative comments were recorded other than the possible issue of learners being distracted, and the previously mentioned possibility of the creation of 'expert learners'. An initial comment from one interviewee that “course designers are very much in the dark about how learning styles are actually related to the real world usage of the system” points towards a rich seam of data mining opportunities for narrative analysis. Finally, it was observed that “Some learners might access it [the narrative analysis] simply because it is there and gain some insights almost by accident, but that is good too...”
5. Conclusion
The primary project goal was defined as being “to investigate the potential applications of the visualization of course narrative structures as generated by personalized e-Learning systems correlated with the actual usage histories of individual learners”. To realize this goal the state of the art in temporally correlated visualization was researched, a
novel approach to visualizing narrative structures was developed, and a prototype narrative analyzer was implemented and evaluated. The prototype narrative analyzer display advances the state of the art in visualization design with features including a novel display of the Honey & Mumford learning style classification, correlated access history and course narrative, and a decoupled time line. The positive responses to the prototype narrative analyzer showed the potential for further work in this area and a clear validation of the visualization design. For more detail please see [9]. Future work is focused on exploring the potential for extracting semantic meaning from underlying data sources and investigating methods for implementing semantically enhanced visualizations.
6. References
[1] AHA! (Adaptive Hypermedia Architecture), available online at http://aha.win.tue.nl/
[2] 3DE (Design Development and Delivery Electronic Environment Educational Multimedia), available online at http://www.3deproject.com/
[3] O. Conlan, V. Wade, C. Bruen, M. Gargan, “Multi Model, Metadata Driven Approach to Adaptive Hypermedia for Personalised e-Learning” Second International Conference on Adaptive Hypermedia and Adaptive Web-based Systems, Malaga, 2002.
[4] D. Del Corso, S. Ovcin, G. Morrone, “A Teacher Friendly environment to foster Reusability and Learner-Centered Customisation in the development of Interactive Educational Packages”, Frontiers in Education, 2003. [5] N. Stash, A. Cristea, P. De Bra, “Authoring of Learning Style in Adaptive Hypermedia Problems and Solutions”,
WWW'04 Education Track, ACM, New York, 2004.
[6] D. Heller, C. Plaisant, R. Mushlin, A. Snyder, J. Li, B. Shneiderman, “LifeLines: Using Visualization to Enhance Navigation and Analysis of Patient Records”, Proceedings of the American Medical Informatic Association Annual Fall Symposium, Orlando, 1998
[7] S. Havre, B. Hetzler, L. Nowell, “ThemeRiver: Visualizing Theme Changes over Time”, Proceedings of the IEEE Symposium on Information Vizualization, 2000
[8] A. Krishnan, S. Jones, “TimeSpace: activity-based temporal visualisation of personal information spaces”
Personal and Ubiquitous Computing, Volume 9, Issue 1, January 2005
[9] F. P. Williams, “Visualising Narrative Structures in Personalised e-Learning Systems”, M.Sc. dissertation, Trinity College, Dublin, 2006, available online at https://www.cs.tcd.ie/publications/techreports/reports.07/TC D-CS-2007-16.pdf