C A N C E R Copyright © 2020 The Authors, some rights reserved; exclusive licensee American Association for the Advancement of Science. No claim to original U.S. Government Works. Distributed under a Creative Commons Attribution NonCommercial License 4.0 (CC BY-NC).
Triangular correlation (TrC) between cancer
aggressiveness, cell uptake capability,
and cell deformability
Yifat Brill-Karniely1*†, Dvir Dror1†, Tal Duanis-Assaf2, Yoel Goldstein1, Ouri Schwob1, Talya Millo1, Natalie Orehov1, Tal Stern1, Mohammad Jaber3, Netanel Loyfer4,
Margarita Vosk-Artzi1, Hadar Benyamini5, Diane Bielenberg6, Tommy Kaplan4, Yosef Buganim3, Meital Reches2, Ofra Benny1*
The malignancy potential is correlated with the mechanical deformability of the cancer cells. However, mechanical tests for clinical applications are limited. We present here a Triangular Correlation (TrC) between cell deformability, phagocytic capacity, and cancer aggressiveness, suggesting that phagocytic measurements can be a mechanical surrogate marker of malignancy. The TrC was proved in human prostate cancer cells with different malignancy potential, and in human bladder cancer and melanoma cells that were sorted into sub-populations based solely on their phagocytic capacity. The more phagocytic subsub-populations showed elevated aggressiveness ex vivo and in vivo. The uptake potential was preserved, and differences in gene expression and in epigenetic signature were detected. In all cases, enhanced phagocytic and aggressiveness phenotypes were correlated with greater cell deformability and predicted by a computational model. Our multidisciplinary study provides the proof of concept that phagocytic measurements can be applied for cancer diagnostics and precision medicine.
INTRODUCTION
There is growing evidence correlating cancer aggressiveness and the mechanical deformability of tumor cells. Various processes of cancer development require mechanical adjustment of tumor cells to physical environments, such as the growth of high pressure tumors, the detach-ment of metastases-forming cells from the tumor, their efficient motion and passage through narrow confinements, and their establishment in a different location (1–5). During the epithelial-mesenchymal transition (EMT), epithelial cells lose their cell polarity and cell-cell adhesion and gain migratory and invasive properties to acquire a mesenchy-mal stem cell phenotype (6). The generation of force transmitted to the cell from the extracellular matrix (ECM) is associated with sig-nal transduction and can control the cancerous level of cells (7). To date, mechanical measurements of cells are mostly done using single-cell methods and, in many cases, require microscopy-based image analysis. Common examples include atomic force microscopy (AFM), microplate stretcher, micropipette aspiration, magnetic twisting cytometry, and microscopy image analysis (8–11). While such mea-surements are elegant and precise, their main disadvantage is being low throughput in most cases, reaching a range of 100 tested cells in most optimal cases. Adamoet al.(12) have produced data of about 3000 cells using a designated software with a microfluidic device.
For clinical applications, it is critically important to develop robust tests of cell deformability because of the large heterogeneity among cancer cells (13,14).
In addition to the link between cell mechanics and cancer potential, in normal cells, it is known that cell deformability is related to the ca-pacity of cells to uptake particles, mainly in engulfment-mediated in-ternalization including phagocytosis and endocytosis (15–17). Given that cancer aggressiveness is correlated with cell deformability and that cell deformability can control uptake capacity, an outstanding question is whether the mechanical properties of cells can tie cancer aggressiveness with particle uptake. Proving such an aggressiveness-uptake-deformability triangular correlation (TrC) can revolutionize the fields of cancer diagnostics and drug delivery design. Differential particle uptake capacity can be considered in rational design of selective drug delivery systems used in precision schemes. Such mechanical-based specificity can potentially reduce the challenging need of allocat-ing specific target molecules for selectivity (18–20).
Here, we found a clear link between cancer aggressiveness, cell uptake capability, and cell deformability. High-throughput uptake measurements with tens of thousands of cells were done using fluorescence-activated cell sorter (FACS), as well as microplate reader spectrometry followed by detailed microscopy to assess particle lo-calization. Uptake capacity of cancer cells was markedly higher in skin cancer cells as compared to noncancerous skin cells. Additional experiments with eight different cancer cell lines demonstrated a non-monotonic dependence on particle size, which can be explained by physical considerations. By comparing cells with varying malignancy originating from primary (prostate) or metastatic sites (21,22), we demonstrated that particle uptake was tightly correlated with cell in-vasiveness ex vivo and also with elevated cell deformability measured by AFM, where higher levels of force compliance indicated greater deformability. To determine whether heterogeneity in particle uptake has biological consequences, we generated, using FACS sorting, “phagocytic”and“nonphagocytic”subpopulations of cells (“positive” 1Institute for Drug Research, The School of Pharmacy, Faculty of Medicine, The Hebrew
University of Jerusalem, Jerusalem 9112001, Israel.2Institute of Chemistry, The Hebrew University of Jerusalem, Jerusalem 9190401, Israel.3Department of Developmental Biology and Cancer Research, Institute for Medical Research Israel-Canada, The Hebrew University–Hadassah Medical School, Jerusalem 91120, Israel.4School
of Computer Science and Engineering, The Hebrew University of Jerusalem, Jerusalem 9190401, Israel.5Info-CORE, Bioinformatics Unit of the I-CORE at the Hebrew University
and Hadassah Medical Center, Jerusalem 9112001, Israel.6Department of Surgery,
Harvard Medical School, Vascular Biology Program, Boston Children’s Hospital, Boston, MA 02115, USA.
*Corresponding author. Email: [email protected] (O.B.); [email protected] (Y.B.-K.)
†These authors contributed equally to this work.
on September 17, 2020
http://advances.sciencemag.org/
and“negative,”respectively) originating from the same human cell origin: either melanoma or bladder carcinoma cells. Unexpectedly, the phagocytic phenotype was enhanced over generations, suggesting involvement of genetic effectors. Moreover, positive cells were found to be more malignant and invasive than the negative ones in ex vivo and in vivo experiments. In mice, we found notable differences in the rate and size of tumor growth between the phagocytic and nonpha-gocytic cells, associated with elevated histological markers of tumor aggressiveness. Genetic up-regulation in transcription of EMT and cytoskeleton reorganization genes was found, with differences also in chromatin level. AFM experiments showed that the phagocytic cells were more deformable compared with the nonphagocytic cells. Further mechanistic insights were provided by a physical model using the specific cell parameters measured here and which quantitatively predicted the uptake patterns found in the experiments.
The TrC established here can lead to the development of a simple diagnostic scheme using uptake measurements as an additional param-eter for grading cancer. To date, cancer diagnostics has not accounted for mechanical properties of cells, although they have been proven to be biomarkers of the malignancy potential. Cell uptake assessments can provide a simple, robust, and accurate diagnostic method and add mechanical knowledge to the existing clinical tools. Moreover, finding specific cell uptake features may provide a mean to rationally design individual drug carriers with higher specificity.
RESULTS
Malignant cells uptake inert particles more readily in a size-dependent manner
We examined whether cancer cells have enhanced abilities of parti-cle uptake as compared to normal cells from the same tissue origin (Fig. 1). Skin cells from a primary cancerous cell line (melanoma, A375-P) were compared to transformed skin cells originated from normal cells (HaCaT, keratinocyte cell line). Both types of cells were incubated overnight with fluorescent polystyrently labelled parti-cles, ranging from tens of nanometers to several micrometers in size, and the normalized uptake (see eq. S1) was evaluated using flow cytometry, a microplate reader, and fluorescence microscopy, as shown respectively in Fig. 1, A to C. After incubation, we con-sistently found, using all three methods, that uptake was markedly higher in cancer cells compared with normal cells. In both cell types, vanishing uptake of small particles below 0.5mm was observed (ex-plained below).
To determine the relevant particle size for studying the TrC, eight different cell lines were tested from skin, prostate, bladder, and kidney cancers, which differed in their metastatic potential (see Materials and Methods). Experimental and theoretical results in Fig. 2 show a nonmonotonic dependence where the uptake increases with particle size, reaching a maximal value with 2.4-mm beads, and then declines. This was observed using FACS, the microplate reader (Fig. 2A), and confocal imaging (Fig. 2B), which also verified particle penetration into cells. The nonmonotonic dependence was predicted by a physical theory as illustrated in Fig. 2C. Engulfment and uptake of low-affinity particles by cells require a sufficiently large area of cell-particle adhe-sion to reduce the free energy, but minimal cell morphological changes as the latter increases the free energy. Hence, intermediate sized par-ticles are optimal here for cell entrance, having a wide enough contact area with the cells and requiring small cell deformation during their engulfment.
The physical theory proposed here is a combination of contact mechanics principles for three-dimensional (3D) cell deformations upon contact with a particle, as well as a 2D description of cell mem-brane morphology, providing the following change in free energy upon cell-particle contact:
DFðϑÞ ¼ 2pR2Dgð1cosϑÞ þ3ER3ð1cosϑÞ2:5þ 4pksinϑ⋅ϑ ð1Þ
ϑis the reaction coordinate describing particle wrapping by the cell membrane. The particle is modeled as a rigid sphere of radiusR. The first two terms describe the adhesion and 3D elastic cell defor-mation according to the Derjaguin-Muller-Toporov (DMT) model (23).Dg, the work of adhesion per unit area, andE, the effective Young’s modulus of the cell, are calculated here per cell type from our AFM results (table S1). The third term reflects the elastic mem-brane curvature with bending modulusk= 4.5kBT(24) in thermal energy units, wherekBis the Boltzmann constant andTis the tem-perature. The model derivation and assumptions can be found in Materials and Methods.
The functionDF(ϑ) has a minimum only when the particles are larger than a critical value
R>RcwhereRc≡
ffiffiffiffiffiffi
4k
Dg r
ð2Þ
For small beads below the critical radiusRc,DFis a monotonically increasing function (box in Fig. 2D), and it is not expected that the cells will uptake the particles, as indeed observed in our experimental results. For each specific cell type,Rcvalues were measured here using AFM and are presented in table S1. We found an excellent match with the experiments in predicting realistic values ofRc, below which uptake capacity was vanishing. From Eq. 1, we can derive the stable (equilibrium) wrapping angle,~ϑ; the higher~ϑis, the more likely it is to have full engulfment and uptake.~ϑis maximal for intermediate values ofR(Fig. 2E) in agreement with our experimental nonmonotonicity findings (Fig. 2, A and B), due to the energetic considerations mentioned above. From the dependence of~ϑonE, the stiffer the cell, the less bead uptake is probable, as indeed found in our experiments (see the next section). The model geometry is sketched in Fig. 2F.
TrC in parental versus metastatic cancer cells
We compared cells with varying malignancy that originated from either a primary site of prostate cancer (PC3M-P) or a highly metastatic subpopulation of these cells (PC3M-LN4) (21,22). A comparison of the three factors—particle uptake, mechanical deformability, and malignant potential between these cell types—is presented in Fig. 3. Particle uptake was found to be higher in PC3M-LN4 cells as measured by FACS (Fig. 3A) and confocal microscopy (Fig. 3B) and as predicted by our model (Fig. 3C). In the physical model, we used spe-cific measured cell parameters from table S1 and found that the free energy is lower and that~ϑis larger for the more metastatic cells, pre-dicting a higher uptake, as indeed observed by the FACS and the con-focal microscope. The highly phagocytic-like PC3M-LN4 cells were also found to be more invasive. Figure 3D shows an ex vivo 3D multi-cellular spheroid formation assay (25) in which the PC3M-LN4 cells were clearly more invasive in collagen as compared with PC3M-P
S C I E N C E A D V A N C E S |
R E S E A R C H A R T I C L E
on September 17, 2020
http://advances.sciencemag.org/
cells. This was reflected in higher values of spheroid compactness (shown in red) that were calculated from image analysis–based photos (see fig. S1A). Examples of these photos, corresponding to the lowest microscope images, are presented at the bottom of Fig. 3D. Figure 3E presents AFM results. The Young’s modulus of the PC3M-LN4 cells was smaller than that of PC3M-P cells, and their maximal adhesion force was larger. This indicates a higher mechanical deformability of PC3M-LN4 compared with PC3M-P cells; the PC3M-LN4 cells were more compliant to shape changes induced by indentation or retrac-tion of the AFM probe (see Materials and Methods). Figure 3F illus-trates that the overall results of Fig. 3 (A to E) demonstrate the TrC, where PC3M-LN4 cells were clearly more invasive, deformable, and phagocytic than the PC3M-P cells.
TrC in phagocytosis-based sorted cancer cells
We found an innate heterogeneity in uptake capacity among given cancer cell populations (Fig. 4A and movie S1). Hence, we sorted cancer cells from the same population by their phagocytic potential, aiming to determine whether such sorting can also subgroup cells according to their malignancy potential and their deformability. In our scheme (Fig. 4B), a FACS sorter was used for separating cells that did not take any particles (negative) from cells that had taken up any number of particles (positive). We used 2.4-mm beads, for which
separate peaks of the FACS diagram corresponded to a discrete ber of cell-inserted beads (fig. S2). This allowed us to control the num-ber of beads taken by cells in the FACS sorting procedure. We started with two types of primary cancer cells: bladder (253 J) and melanoma (A375-P). Six cycles of FACS sorting were done, yielding very efficient enrichment patterns (Fig. 4C), indicating that uptake potential is a pre-served characterization. The enrichment process resulted in four subpo-pulations: 253 J positive, 253 J negative, A375-P positive, and A375-P negative. Notably, the positive cells (both in 253 J and A375-P) showed a more invasive phenotype with higher compactness values as com-pared with the negative ones in a spheroid invasion test (Fig. 5A and fig. S1B). Proliferation rates, which can affect the extent of particle uptake (movies S2 and S3), were found to be identical in positive and negative subpopulations (fig. S3); therefore, they were not the cause for the differences in cell behavior. AFM measurements (Fig. 5B) con-firmed TrC, showing that both of the positive subtypes were more ad-hesive than their negative counterparts. The A375-P–positive cells were also more elastic than the negative ones. The AFM results were used as input parameters in the physical model (Fig. 5C). In both cell pairs, the model predicted a higher extent of engulfment by positive as compared with negative cells, implying higher particle uptake by the positive cells. A complementary view was achieved by studying how stiffening of cancer cells affected the uptake of 0.8-mm beads. Figure S4 shows that
Fig. 1. Cancer skin cells (A375-P) present an enhanced uptake compared with noncancer skin cells (HaCaT).(A) FACS analysis is presented as column plot of normalized average uptake values of 0.05-, 0.3-, 0.5-, 0.8-, and 2.4-mm fluorescently labeled polystyrene beads. Representative histograms for 2.4-mm beads are shown at the bottom. (B) Microplate reader fluorescence analysis. Excitation, 530/25 and emission, 590/20, with 0.3-, 0.8-, 2.4-, 6-, 10.4-, and 15.7-mm beads. The unitless results in the column plots of (A) and (B) are normalized by the intensity of particle fluorescence to represent the relative mass of cell internalized particles and are scaled to a maximal value of 1 (see eq. S1). (C) Fluorescent microscopy images of cells incubated with 0.3-, 0.8-, and 2.4-mm beads. Blue, DAPI; red, beads. Scale bars, 10mm (upper panels, 0.3mm) or 50mm (middle and lower panels, 0.8 and 2.4mm).
on September 17, 2020
http://advances.sciencemag.org/
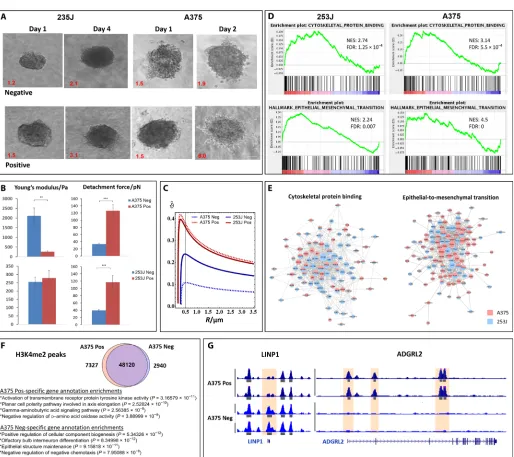
the uptake by stiffened cells was notably lower than the uptake by non-treated cells. To shed light on the phagocytic phenotype and to pinpoint on relevant genes that may mediate this effect, we performed RNA se-quencing of the four subpopulations. Gene set enrichment analysis (GSEA) was used on the hallmark gene set collection of the molecular signature database (mSigDB). In both cell lines, positive-enriched cells displayed up-regulation in the transcription of EMT and cytoskeleton-related gene sets (Fig. 5D). Top cytoskeleton-cytoskeleton-related up-regulated gene sets included GO_actin_cytoskeleton, GO_cytoskeletal_protein_ binding, GO_actin_filament_based_process, KEGG_regulation_of_ actin_cytoskeleton, and GO_structural_constituent_of_cytoskeleton. Figure 5E shows protein-protein interaction networks of the genes that contributed to the up-regulation. Next, we asked whether the dif-ferences in gene expression are reflected at the chromatin level as well. To that end, we performed chromatin immunoprecipitation sequenc ing (ChIP-seq) for the active histone mark, H3K4me2, on A375-P– positive and A375-P–negative cells. As expected, the vast majority of the peaks (i.e., 48,120 peaks) were shared between the positive and negative cells. However, we still observed 7327 unique peaks for the positive cells and 2940 peaks for the negative cells (Fig. 5F). The pres-ence of a group-specific peak was correlated with the expression levels of the affected genes (Fig. 5G, two lociLINP1andADGRL2are shown).
Using Genomic Regions Enrichment of Annotations Tool (GREAT), we associated the specific peaks to their relevant genes and ran Gene ontology (GO) annotation. Similarly to the transcriptome analysis, the positive-specific peaks were enriched in genes that participate in cell polarity pathway and tyrosine kinase activity and the negative cells for epithelial structure maintenance. Together, our data suggest that the positive cell phenotype was associated with EMT.
For a stronger level of validation of the differential malignancy in the uptake-based sorted cells, we performed an in vivo experiment. Three groups of nude mice were injected subcutaneously with cells originating from our sorting experiments: (i) original A375-P cells, (ii) positive A375-P cells, and (iii) negative A375-P cells. Tumor growth was monitored over 20 days in C57/BL mice. A notable (P= 0.033) difference in tumor volume was obtained after 9 days, where the neg-ative cells’tumors were 52 or 64% smaller in volume than the tumors formed in the positive or parental groups, respectively (Fig. 6A). Tu-mor images and weights are presented in Fig. 6B. It was expected that there would be a large divergence of the negative population and sim-ilarity between positive and parental cells, since the negative cells were formed by specifically isolating nonphagocytic cells from the rest of the population. As shown in Fig. 6C, histological examination of hematoxylin and eosin (H&E)–stained tissue sections revealed that
Fig. 2. Uptake of beads by cancer cells has a nonmonotonic dependence on the bead size.Cancer cell interaction with inert spherical fluorescent polystyrene beads increases with bead size, reaching a maximum around 2.4-mm bead diameter and then decreases. (A) Left: FACS analysis; average over normalized uptake values of eight cell lines: A375-p, A375-SM, PC3M-P, PC3M, LN4253J, 253 J-B5, SN12, and SN12-C. Right: Microplate fluorescent analysis (excitation, 530/25 and emission, 590/20), average over normalized uptake values of A375-P, A375-SM, PC3M-P, and PC3M-LN4. (B) Confocal fluorescent images (blue, DAPI; green, fluorescein isothiocyanate–phalloidin; red, polystyrene fluorescently labeled beads). Scale bars, 10mm. (C) Physical model predicted the nonmonotonic dependence due to the interplay between adhesion and cell deformability. (D) The free energy of the wrapping model has a minimum as a function of both the bead radius and the wrapping angle,ϑ(bottom); however, for small beads ofR<Rc, there is no stable adhesion [top; plots downward are forR= 0.05, 0.11, 0.14 (Rc, dashed), 0.18, and 0.23mm]. (E) The stable adhesion angle,ϑ~(rad) is shown
versus Young’s modulus andR. (F) Model geometry. Parameters used in plots of (D) and (E) are based on AFM calculations in PC3M-LN4 cells (see table S1).
S C I E N C E A D V A N C E S |
R E S E A R C H A R T I C L E
on September 17, 2020
http://advances.sciencemag.org/
positive cells induced dense and highly proliferative tumor tissues, while negative ones formed tissues with large areas of dead cells. To investigate the reason for the necrotic area, we performed immuno-histological analysis using Ki67 as a marker for proliferation and cleaved caspase-3 to label apoptotic cells (Fig. 6D, top). The results
suggest that the positive cell-originated cancers were more prolifer-ative and showed reduced apoptosis as compared to the negprolifer-ative ones. Moreover, three EMT-related markers—Snail, E-cadherin, and smooth muscle actin (SMA) (Fig. 6D, bottom)—were tested to assess their level in the tumor tissues. The results revealed that Snail had higher levels in the positive tissues, while E-cadherin was lower, indicating on elevated EMT in the positive tumors, and that SMA levels were shown to be similar. The histological findings are sum-marized in Fig. 6E.
DISCUSSION
Growing knowledge about the high complexity of tumor cell biology has made it clear that an integrative approach is required in cancer research, including cell mechanics aspects. In the TrC proven here, mechanical deformability was found to be the mechanistic link that correlates cell uptake features with cancer aggressiveness. Correla-tions between cell deformability and cancer potential were previously studied. Various physical experiments were performed comparing the flexibility of normal and cancer cells with increasing malignancy. In numerous types of cancers, it was found that cell elasticity could be used as a biomarker for malignancy and for the metastatic potential (3,8,26,27). Some studies found that a marked reduction of cell stiff-ness resulted in lower invasivestiff-ness potential, probably due to the dif-ficulty in sensing and applying force (3,28,29). While cancer cells in vitro show enhanced elasticity, 3D tumor tissues are very stiff as com-pared with normal ones. This duality highlights the notable ability of cancer cells to adjust mechanically to different conditions such as the force exerted by the ECM (8,30). It is well known that cell adhesive-ness plays a major role in cancer progression. Turnover of specific cell adhesion molecules is required for enhanced dynamics of both cell-cell and cell-ECM adhesions during tumor growth and the spread of metastases (31). While most previous data focused on the relation be-tween specific adhesions and malignancy, importantly, we found here that nonspecific adhesions were also correlated with cancer potential [supported by previous work (32)]. Namely, cell deformability, in terms of elasticity and nonspecific adhesiveness, is the mechanistic link be-tween cancer aggressiveness and cell uptake capacity.
To date, information is sparse regarding the role of cell mechanics in particle-loading by cancer cells. A recent work by Maet al.(33) showed that drug-resistant soft tumor-repopulating cells loaded cell-derived microparticles that contained drugs more efficiently than parental tu-mor cells that were stiffer and originally less resistant to drugs. Cancer cells often have enhanced abilities to internalize large micro-objects (34,35), a property commonly referred to as a phagocytic ability (6,28). Evidence of cancer cell cannibalism also implies on advanced capaci-ties of internalizing large objects (36). In a work by Chandrasoma, published in 1980 (34), the author examined cells from a primary tu-mor of a patient with endometrial adenoacanthoma as well as from skin metastasis of the same patient. In the primary tumor, two cell populations were recognized; only one of them phagocytosed poly-morphonuclear leucocytes. However, all metastasis cells phagocytosed polymorphs. It was suggested that the phagocytic abilities of primary tumor cells were related to their potential to form metastases. Since then, other reported studies outlined a phagocytic ability of cancer and metastases cells; however, direct comprehensive evidence of the aggressiveness-uptake link was not clear (6). Here, we found that cancer cells with higher metastatic potential had elevated capacities of particle uptake and that cell populations that were sorted on the
Fig. 3. TrC in primary versus metastatic cancer cells.(AtoC) Uptake compar-ison of 2.4-mm beads in primary versus metastatic cell lines of prostate cancer, PC3M-P and PC3M-LN4, respectively, showing elevated uptake by the metastatic cells: (A) FACS analysis, (B) confocal images (scale bars, 10mm), and (C) results of the theoretical model with specific parameters of PC3M-P and PC3M-LN4:DF(ϑ) curves forR= 2.37mm (top) as well as~ϑ(R) (bottom) demonstrate that the meta-static cells internalize more particles. (D) Spheroid invasion test shows enhanced invasiveness of the metastatic compared to the primary cells. Compactness values are shown in red. At the bottom shown are examples of image analysis made for calculating the compactness of the microscope snapshots above them. Scale bar, 100mm. (E) A comparison of the mechanical properties of the cells: Young’s modulus and the maximal adhesion force, using AFM, show that the metastatic cells are more elastic and more adhesive than the primary cells. A typical snapshot of a PC3M-LN4 cell from the AFM microscope is shown. Scale bar, 10mm. The results presented in (A) to (E) support the TrC as shown in the cartoon (F). The PC3M-LN4 cells have higher uptake capacity (A and B), and they are more invasive (D) and are more deformable (E) in comparison with the PC3M-P cells, as also supported by the physical model in (C).
on September 17, 2020
http://advances.sciencemag.org/
basis of increased phagocytic properties were more aggressive. This provided a direct proof that the phagocytozing cells were more ag-gressive and vice versa.
Marked differences between particle uptake by keratinocyte cell line and cancer skin cells were found here, supporting the TrC. More-over, we found that primary prostate cancer cells (PC3M-P) internal-ized particles fivefold less than a metastatic subpopulation of these cells (PC3M-LN4). The cells metastatic potential was validated using spheroid invasion tests showing higher invasiveness of the PC3M-LN4 cells, which were also found to be more elastic and adhesive in the AFM experiments. The AFM measurements were used as input parameters in our physical coarse-grained model, which qualitatively predicted uptake patterns of the primary and metastatic cell types using basic energetic arguments. The free energy terms of particle en-gulfment by cells include the interplay between the reduction of energy
caused by cell-particle adhesion and an increase in energy resulting from cell deformation upon particle wrapping. We found here that cells of higher malignant and metastatic potential were more elastic and adhesive. Thus, the energetic penalty of their deformation is smaller and the gain in adhesion energy is larger, resulting in higher uptake capacity.
The size of particles was found to affect markedly the extent of uptake. A nonmonotonic dependence of uptake on particle size was found, with a maximum uptake for 2.4-mm beads. Other size dependencies reported in the literature [e.g., (35)], could have resulted from varying values of the physical adhesiveness and elasticity of cells or from biological factors such as the membrane surface brush (37), specific biochemical path-ways such as clathrin- or caveolin-mediated internalization, and the formation of lipid rafts. Here, we tested beads of minimal cell affinity; thus, adhesion energy was insufficient to enable particle internalization
Fig. 4. Sorting cancer cells based on uptake capacity of 2.4-mm beads.(A) Uptake is heterogenic among a cell population. Fluorescence microscope images of either A375-P or 253 J cell types after incubation with beads show that while some cells internalized many particles, others did not internalize any. Scale bars, 50mm (upper images) and 100mm (lower images). (B) Scheme of FACS sorting procedure for separating cells based on uptake capacity. Each sorted cycle resulted in two subpopulations of phagocytic (positive) cells and nonphagocytic (negative) cells. (C). Enrichment uptake graph.“D”is the percent of positive cells generated from a previously positive population, minus the percent of positive cells generated from a previously negative population (see Materials and Methods).
S C I E N C E A D V A N C E S |
R E S E A R C H A R T I C L E
on September 17, 2020
http://advances.sciencemag.org/
in the case of small particles because of the small cell-particle contact area. Increased size of particles widens the contact area, and thus uptake becomes more favorable. However, a further increase in par-ticle size requires massive cell deformation upon engulfment, and the
uptake is reduced, resulting in a nonmonotonic dependence. More-over, our model predicted the experimental observation of a critical radius,Rc≡
ffiffiffiffi
4k
Dg q
, that is specific for cell and particle type, below which particles do not penetrate cells.
Fig. 5. TrC in cells that were sorted on the basis of their uptake capacity.The cells with higher phagocytic capacity (positive cells) were more invasive and more deformable than the negative cells (AtoC). (A) Spatial invasion assay with compactness values using spheroids of positive and negative A375-P and 253J cells showed that positive cells were more migratory and invasive than negative cells in collagen. (B) AFM results revealed that both of the positive subtypes were more adhesive than their negative counterparts. The A375-P positive cells were also more elastic than the negative ones. (C) The AFM results were used as parameters in the physical model. The stable wrapping angle was found to be larger in the positive cells compared with the negative cells (showing a higher effect in A375-P than in 253J, in agreement with the experimental results). The differences between positive and negative cells were further examined in bioinformatics assays (DandE). (D) GSEA plots showing up-regulation of cytoskeletal protein binding and EMT in A375-P and 253J cells. NES, normalized enrichment signal; FDR, false discovery rate. (E) Protein-protein interaction networks of genes are shown. Nodes represent proteins, and an edge connects proteins that interact [interactions taken from HIPPIE (2) and TSRING (3)], where the size of a node is proportional to the number of proteins that interact with it. Light blue, 253J; pink, A375; mixed light blue and pink, nodes that contributed to the enrichment signal in both cell lines. (F) Venn diagram of H3K4me3 ChIP-seq peaks in A375-positive and A375-negative cells. Overall, we have identified 58,387 peaks, of which 48,120 peaks (82%) are shared among the two conditions. Conversely, 7327 peaks (13%) are unique to A375-positive cells and 2940 peaks (5%) to A375 Neg. Analysis of gene annotation shows enrichment for EMT-related terms among genes associated with the A375 Pos peaks and maintenance of epithelial morphology–related terms among the A375 Neg–related genes. (G) Examples for A375 Pos and Neg differential peaks. An A375 Neg–specific H3K4me2 peak (left, highlighted box) is shown near the LINP1 promoter. Conversely, several A375 Pos–specific H3K4me2 ChIP-seq peaks were identified at the ADGRL2 gene (right, highlighted boxes). Both cases are in accordance with differential gene expression levels for those genes, as discussed above.
on September 17, 2020
http://advances.sciencemag.org/
A major challenge in cancer treatment results from internal heter-ogeneity and plasticity in terms of genetics, functionality, phenotypes, stem cell differentiation, microenvironment variability, and others (31,38,39). It should be recognized that mechanical heterogeneity is notable as well (13,14) and that, ideally, all of these factors should be included in the profile of patients for optimizing their clinical ther-apy with precision schemes. We found a large variability in uptake capacity of cancer cells from the same population (Fig. 4A), raising two questions. Is uptake variability correlated with the cancer poten-tial and with the mechanical properties of individual cells? And are these characteristics inherited from generation to generation and can therefore allocate potential targets for therapies? To address these questions, we sorted cells on the basis of uptake capacities using six en-richment cycles of FACS sorting. Differences between the sorted cells were notable and indicated conservation of the TrC. The fact that sort-ing of cells accordsort-ing to their particle uptake resulted in populations that
were clearly distinguished from each other in their cancer potential after mice injection and in artificial 3D tumors (spheroids) may have an enormous impact on future drug design and diagnostics. Histologically, we found that positive cell populations had more aggressive phenotypes, enhanced proliferation, and an increase in EMT protein, Snail, and re-duced E-cadherin expression, suggesting an EMT. Our gene expression analysis supported the mechanical link between uptake and cancer potential, suggesting the differential pattern of up-regulation in the transcription of EMT genes and of genes related to cytoskeleton reor-ganization. Differences between the sorted subpopulations persisted over generations with clear epigenetic differences. The differences in genes that were related to cell polarity pathway, tyrosine kinase activity, and epithelial structure maintenance, might explain the enrichment of the phagocytic phenotype with cell generations. Since EMT is associated with morphological cell changes, mobility, and cell polarity, it may be related to phagocytosis.
Fig. 6. TrC in uptake-based sorted cells was validated in a xenograft study.Parental, positive, and negative A375-P cells were injected subcutaneously to athymic nude mice. (A) Induced tumors were measured every other day from day 9 following the injection. The negative tumors were notably smaller in volume than the positive and the parental ones. (B) Extracted tumor tissues from the negative group were notably smaller compared with the positive and the parental tumors, as demonstrated visually and by weight measurements. Photo credit: O. Benny, HUJI. Square scale, 1 cm. H&E staining of the extracted tumors showed dense and highly proliferative tissues of the positive tumors (C) and, in contrast, large areas of necrosis in negative ones (D). Immunohistochemical staining for evaluating proliferation (anti-Ki67 in green), apoptosis [anti-cleaved caspase-3 (Cas 3) in red], and EMT (anti-SNAIL/SLUG in red versus anti–E-cadherin in green, as well as SMA in green). Positive tissues showed a higher level of proliferation (Ki67 staining), while negative tissues showed a higher level of apoptosis (cleaved caspase-3). SNAIL/SLUG versus E-cadherin show enhanced EMT in the positive tumors compared to the negative ones, while SMA values were similar. Scale bars, 100mm. (E) A qualitative summary of histological immunohistological analysis as determined visually from captured images. Grading is based on positive-stained areas in a given tissue.
S C I E N C E A D V A N C E S |
R E S E A R C H A R T I C L E
on September 17, 2020
http://advances.sciencemag.org/
The significance of combining cell mechanics in the rational de-sign of cancer therapies and in diagnostics is clear. However, robust, accurate, and simple mechanical tests for this aim are lacking. A con-sequence of the TrC is that uptake measurement can be used as a reliable high-throughput scheme of mechanical measurements in cancer. We anticipate that these findings will open up the possibility of practical simple procedures that use uptake tests as a routine in cancer diagnostics and in the rational design of selective therapies. Further development of our findings would involve focusing on clin-ical scenarios that can benefit from the TrC insights related to cell-particle interactions, including ex vivo diagnostics, or circulating cells. Of course, at the tissue level, additional effectors should be considered. Future research in this field can include investigations of different aspects of mechanical factors such as biochemical pathways and cyto-skeleton remodeling. In addition, the efficacy of drug-loaded carriers can be examined for enhancing specificity on the basis of mechani-cal arguments.
MATERIALS AND METHODS
All institutional and national guidelines for the care and use of labo-ratory animals were followed, and protocols were approved by The Hebrew University of Jerusalem Ein Kearem Medical School Institu-tional Animal Care and Use Committee.
Cell culture
Human keratinocyte cell line, HaCaT cells (Thermo Fisher Scientific), was maintained in Dulbecco’s modified Eagle’s medium (Thermo Fisher Scientific) supplemented with 10% (v/v) fetal bovine serum and 1% anti-biotics [streptomycin (10,000mg/ml) and penicillin (10,000 units/ml)] at 37°C with 5% CO2. A375-P (primary human melanoma cells), A375-SM (metastatic human melanoma cells), PC3M-P (primary prostate cancer cells), PC3M-LN4 (metastatic prostate cancer cells), 253 J (primary human bladder cancer cells), 253 J-B5 (metastatic hu-man bladder cancer cells), SN12 (huhu-man renal primary cancer cells), and SN12-C SN12 (human renal metastatic cancer cells) were ob-tained by the Bielenberg laboratory at the Boston Children’s Hospi-tal, USA and maintained as previously reported (22). Cells were serially passaged at 70 to 80% confluency, and then experiments were conducted with subconfluent cells. All cell lines were mycoplasma free (EZ-PCR Mycoplasma Test Kit Biological Industries, catalog number 2070020).
Materials and reagents
Unless otherwise stated, reagents were purchased form Sigma-Aldrich. Fluorescently labeled polystyrene spherical particles were purchased from Spherotech Inc. (USA). In most cases, purple fluorescence (exci-tation, 488 nm and emission, 545/60 nm) was used except for the 6-mm particles in Fig. 1B that were pink (excitation, 488 nm and emis-sion, 615/30 nm). Antibodies for immunostaining were anti-Ki67 (1:100, Abcam, no. ab15580) for proliferation, anti–cleaved caspase-3 (1:100; Cell Signaling, no. MAB835) for detecting apoptosis, and markers for EMT: anti-SNAIL/SLUG (1:100, no. ab180714), anti– E-cadherin (1:100, Abcam, no. ab15148), and anti-SMA (1:100, Abcam, no. ab5694). Cells were blocked with 3% rabbit serum.
Measurement of particle uptake by cells
To measure the extent of particle internalization into cells, three meth-ods were used: FACS analysis, spectrometry microplate reader
analy-sis, and microscopy imaging. Measurements of uptake after 24 hours incubation with fluorescently labeled polystyrene particles were per-formed. Control experiments were done with 5-min incubation, en-suring low particle-cell affinity that does not depend on particle size (fig. S5).
For FACS analysis, cells were seeded in six-well plates for 4 days after overnight starvation in low (0.5%, v/v) serum media. Fluores-cently labeled polystyrene particles were added and diluted either to final concentrations of 0.0007 to 0.003% (w/v) (Fig. 2A) or to fixed concentrations of 5% (v/v) otherwise, for O/N incubation in fresh full medium. Controls of cells without particles in the same condi-tions were done as well. The minimal number of cells in a sample was 10,000. Normalized uptake values were calculated using eq. S1. After the incubation with particles, the cells were washed with cold phosphate-buffered saline (PBS), detached using trypsin, washed again, and filtered through a 40- to 50-mm nylon mesh using a 50-ml conical tube to remove tissue debris mesh. Cells were then centrifuged and suspended in a FACS buffer containing 1% bovine serum albumin in PBS and 0.05% sodium azide. Analyses were performed using a Beckman Coulter CytoFLEX (USA) flow cytometer and analyzed using CytExpert software.
Further quantification of particle uptake by cells was done by fluo-rescence detection using a microplate reader (Synergy, HT, BioTek, USA). The tested cells were seeded in a final concentration of 20,000 cells per well in 96-well clear-bottom plates (Corning, Sigma-Aldrich) and cultured until cells reach 90% confluency. Polystyrene beads were added from 1% (w/v) stock to a final concentration of 5% (v/v). Nor-malized uptake values were calculated using eq. S1. Cells were incu-bated with beads for 24 hours, washed thoroughly with PBS, and read with the microplate reader in excitation: 530/25 and emission: 590/20. Cells without beads were used to obtain a baseline signal.
Cell imaging was used as a direct detection of particle uptake that we used, both with an inverted fluorescent microscope (model IX73, Olympus Corporation, Japan) and by confocal microscopy (Nikon’s A1 MP multiphoton confocal microscope equipped with a 639-nm diode). For fluorescence microscopy, cells were seeded in 24-well plates. After O/N starvation (serum-free medium), fluorescently labeled beads, in the size of 0.05 to 2.4mm, were added for an O/N incubation. The cells were then washed repeatedly, fixed using 4% paraformaldehyde (PFA), and counterstained with 4′,6-diamidino-2-phenylindole (DAPI). Wells were then observed and photographed using fluorescent microscopy (Olympus IX73).
To further validate the extent of particle uptake, and differentiate between internalization and cell adhesion, a confocal microscope with optical sectioning was used. Cells were seeded in ibidi eight-well micro-plates for 3 days, during which cells were starved overnight and later incubated O/N with fluorescent-labeled beads ranging from 0.05 to 2.4mm in fresh full medium. Cells were then washed thoroughly, fixated with 4% PFA, and stained with DAPI for nuclei staining with or without counterstaining of Alexa Fluor 488 phalloidin for actin staining. The wells were imaged and photographed using a ZEISS (Germany) confocal microscope.Z-stacks (~1mm per slice) were per-formed for ortho and 3D analysis using ZEISS Zen software.
Time-lapse imaging of fluorescently tagged-polystyrene particle uptake
Real-time imaging of particle uptake was performed using the con-focal microscope. Further details and movies are presented in the Supplementary Materials.
on September 17, 2020
http://advances.sciencemag.org/
Atomic force microscopy
To evaluate the elasticity modulus of the cells and their adhesion to the silicon tip, indentation measurements were performed using an atomic force microscope. All measurements were performed using NanoWi-zard 3 (JPK Instruments, Germany). Indentation measurements were performed in a contact mode using silicon oxide colloidal AFM probes 6.2mm in diameter (SQube, CP-PNPL-SiO-C, NanoAndMore GMBH, Germany). Each cell was probed at 50 points in two different locations not on cell nucleus with an area of 0.5mm2
each. A force of 1 nN was used at a speed of 5mm/s. The data were analyzed using JPK Instrument data analysis software. The Young’s modulus was determined using a DMT model, and the maximal adhesion force was calculated by the minimum point of the force curve. Cells that were more deformable had higher compliance to shape changes induced by indentation or re-traction of the AFM probe. Higher deformability therefore corre-sponded to lower values of Young’s modulus and higher values of the maximal adhesion force. Cells that have small values of Young’s modulus are highly elastic and can greatly deform and allow massive indentation of the probe. High values of the maximal adhesion force represent cells that showed large deformation keeping their membrane adhered to the retracting probe.
Cell invasion assay
To assess the migratory and invasiveness potential of cells, we mea-sured spatial cell invasion from multicellular cancer spheroids (3D culture) in an ECM. Briefly, cells were seeded in a multiwall 2% Agarose microwells array templated with a Master 3D Petri Dish 96-well arrays at 3000 cells per well (Microtissues Inc., USA) as previously described, 3000 cells per well (25). Following cell seeding, the microwells were in-cubated with fresh medium to allow spheroid formation for 48 hours. Forty-eight hours after spheroids incubation, the spheroids were har-vested and embedded in a solution of 0.25% methyl cellulose in suitable media. Spheroids were then mixed with collagen (rat tail collagen type I, Corning, USA) in neutral pH, seeded in a 24-well plate, and incu-bated for 30 min at 37°C. After gel stabilization, 300ml of fresh media was added to provide sufficient media supply. The gel containing the spheroids was gently detached from the well, and images of the spheroids were taken by an inverted fluorescent microscope (Olympus Corporation, Japan, model IX73) every few hours.
FACS sorting
Generation of two subcell populations originated from a single cell line, differing by their capacity to uptake 2.4-mm beads, was done by the FACS sorter. Each FACS sorting procedure separated cells that did not uptake any particles (negative, FL2Low) from the rest of the cells (positive, uptake of at least one bead, FLhigh). Therefore, after the first sorting, in each cycle, we obtained four different subsets of cells: positive-positive; positive-negative, positive, and negative-negative. Only the positive-positive and negative-negative were kept for further sorting. In each cycle, the sorting enrichment,D(presented in Fig. 4C), was defined asD≡JþþJþ, whereJþþwas the percent of positive cells obtained in a sorting procedure on the positive-positive population of the previous cycle andJþwas the percent of positive cells
obtained in a sorting procedure on the negative-negative population of the previous cycle. An exception to this definition is the first cycle where both of the percent values of positive cells were calculated rel-ative to the same origin population of cells, yieldingJþþJþ¼0. Each sorting included the flowing steps. Cells were cultured for five generations and incubated with 2.4-mm beads for 24 hours. Cells
were then washed thoroughly with PBS and detached with trypsin, centrifuged, counted, and diluted to 1.0 × 10⁷cells/ml in PBS. Using a BD FACSAria III cell sorter, cells were analyzed and sorted on the basis of the fluorescence intensity distribution (FL-2). The levels of fluorescence intensity indicated accurately on the number of inter-nalized particles, as shown in fig. S2, allowing for a highly sensitive uptake-based sorting.
Xenograft in vivo experiment
Following the fifth sorting cycle, A375 cells were first cultivated to dis-pose the sorting particles, harvested, and injected (5 × 10⁶cells in 100ml of PBS containing 5% Matrigel) subcutaneously to male athymic nude– Foxn1 HSD 5- to 6-week-old mice, under isoflurane anesthesia. Mice were inspected and weighed every other day. From day 7 of the injection, tumors were measureable and their volume calculated through the ellipsoid equation (square of the tumor width and multi-plied by 0.52). Twenty-two days after the injection, mice were euthanized by cervical dislocation under ketamine/xylazine sedation, and tumors were extracted, weighed, and photographed. Tumors were fixated in for-malin and embedded in paraffin for histological examinations.
Histology
Tumors extracted from the xenograft experiment were embedded in paraffin and sectioned to 8-mm samples. Samples were stained with an H&E dye for detecting tissue structure using a standard procedure. For immunofluorescence, sections were fixed and 0.1% Triton was used for tissue permeability. After blocking with 3% normal goat serum, sections were incubated with primary antibodies for apoptosis and proliferation (cleaved caspase-3 and Ki67, respectively), and three antibodies for EMT: anti-SMA, anti–E-cadherin, and anti-Snail/Slug. Alexa Fluor 488 or Alexa Fluor 647 (Abcam) was used for secondary antibody labeling, and fluorescent mounting media was used with DAPI (VECTASHIELD, Vector Laboratories, USA) for imaging using a fluorescent microscope (Olympus Corporation, Japan).
RNA extraction
For RNA extraction, the standard QIAzol protocol was used. Tissue samples were homogenized in a QIAzol Lysis Reagent. After addition of chloroform, the homogenate was separated into aqueous and or-ganic phases by centrifugation. RNA partitioned to the upper, aqueous phase, while DNA partitioned to the interphase and proteins to the lower, organic phase. RNA was precipitated from the aqueous phase by addition of isopropanol. The pellet was then washed with ethanol and redissolved in ribonuclease-free water.
RNA sequencing
Sequencing of positive and negative cell samples was performed in The Nancy and Stephen Grand Israel National Center for Persona-lized Medicine (G-INCPM)–Weizmann Institute of Science (Israel). Libraries were prepared using the INCPM-mRNA sequencing. Briefly, the polyA fraction (mRNA) was purified from 500 ng of total RNA following by fragmentation and the generation of double-stranded complementary DNA. Then, end repair, A base addition, adapter liga-tion, and polymerase chain reaction amplification steps were per-formed. Libraries were evaluated by Qubit (Thermo Fisher Scientific) and TapeStation (Agilent). Sequencing libraries were constructed with barcodes to allow multiplexing of 12 samples in one lane. Around 21 million single-end 60–base pair (bp) reads were sequenced per sample on an Illumina HiSeq 2500 V4 instrument.
S C I E N C E A D V A N C E S |
R E S E A R C H A R T I C L E
on September 17, 2020
http://advances.sciencemag.org/
Bioinformatics
Reads were trimmed using cutadapt (40) and mapped to the human genome GRCh38 using STAR (41) v2.4.2a (with End To End option and out Filter Mismatch NoverLmax set to 0.04). Counting proceeded over genes annotated in Ensembl release 88, using an HTSeq count (42) (intersection-strict mode). Differential expression analysis was performed using DESeq2 (43) with the betaPrior, cooksCutoff, and independent Filtering parameters set to false. RawPvalues were adjusted for multiple testing using the procedure of Benjamini and Hochberg (44). The pipeline was constructed using Snakemake (45).
Statistical analysis
All experiments were performed and repeated three or more times. A parametric test and a two-tailed Student’sttest were used for calculat-ing significant differences between two sets of results. An analysis of variance (ANOVA) test followed by a Tukey post hoc test were used for multiple comparisons. Error bars represent SEs. A small fraction of outliner points were discordant in the AFM data and were subtracted using aZtest with 95% confidence.Pvalues of 0.0001 to 0.001 and 0.001 to 0.01, respectively, are represented by marks of“***”and “***”in the graphs.
Gene set enrichment analysis
Whole differential expression data were subjected to gene set enrich-ment analysis using GSEA (46). GSEA uses all differential expression data (cutoff independent) to determine whether a priori defined sets of genes show statistically significant, concordant differences between two biological states. Gene sets with cytoskeleton-related functions were extracted from the MSigDB (v6.1, October 2017).
Network analysis
Protein-protein interactions data were extracted from HIPPIE (47) and STRING (48), and images were generated using Cytoscape (49).
Chromatin immunoprecipitation
ChIP assay was performed as follows (50). Cells were fixed with 0.8% formaldehyde for 10 min, and then formaldehyde was quenched with 125 mM glycine. The cells were lysed for 20 min on ice, and DNA was fragmented by adding Micrococcal Nuclease (MNase, Thermo Fisher Scientific, 88216) for 20 min at 37°C. The chromatin fragments were then added to Protein A/G beads (Invitrogen, 10004D/10002D) that were attached to H3K4me2 antibody (Millipore, 07-030). Samples were washed twice with radioimmunoprecipitation assay (RIPA) buffer, twice with RIPA high-salt buffer, twice with LiCl wash buffer, and twice with 10 mM tris-HCl (pH 8). DNA was eluted and extracted using AMPure XP beads (A63881, Beckman Coulter Genomics). ChIP li-braries were prepared according to the Illumina Genomic DNA protocol.
ChIP-seq analysis
ChIP-seq fragments were sequenced (in paired-end, read lengths of 42 bp), and then mapped to the human genome (hg19) using Burrows-Wheeler Aligner (BWA) (51) with default parameters. Binary Sequence Alignment/Map (BAM) files were then filtered for quality and proper mapping using SAMtools’s“-q 10 -F 1796”(52). We then calculated the ChIP-seq read coverage along the genome using deepTools bam-Coverage (53), with the flags“-bs 50 -e 500–normalize Using RPGC –effectiveGenomeSize 2451960000,”and presented the generated tracks using the University of California, Santa Cruz (UCSC) Genome Browser (54).
Peak calling and annotation enrichments
Peak calling was performed using MACS2 (55), with the parameters “–slocal=2000–llocal=50000–nomodel–extsize=1500 -q .0005 -g hs” on each replicate, and then a calculation of the two sets of peaks union was done. Peaks were then intersected using mergePeaks (HOMER, v4.10) (56), and differential peaks were assigned to nearby genes and analyzed for gene ontology enrichments using GREAT (57).
Theoretical model
The free energy change in the adhesive interaction between a rigid spherical particle and a cell is presented in Eq. 1. The mechanism of particle engulfment is provided in a coarse-grained manner (details of the cytoskeletal dynamics were beyond the scope of the present work). A single particle was considered, neglecting particle-particle interac-tions. An initial stable envelope of the bead particle by the cell mem-brane was hypothesized to be a necessary step for full engulfment and uptake, and therefore our model provides the upper limit of the extent of particle internalization. A cell was assumed to behave as a continuum 3D elastic material wrapped by an elastic 2D membrane. We used the DMT model for describing the free energy of the cohe-sion and the 3D cell deformation, consistent with our DMT-based cal-culations of parameters from the AFM measurements (23). The Helfrisch theory was used for describing membrane elasticity (58). The DMT model accounts for attractive interactions of adhesion and Van der Waals (VdW) that are not spatially limited to the cell-bead contact area. The interactions are assumed to be elastic, describ-ing the case of low penetration. The bead was assumed to be small compared with the cell, and the spontaneous curvature of the cell was taken as zero so that the initial cell geometry was modeled as half a space. The bead and cell surfaces were assumed to be smooth and tightly adhering along their contact surface. Smaller factors of the free energy, such as entropic terms and membrane-stretching tension, were neglected in our coarse-grained model as well as coupling be-tween the DMT and Helfrich terms. Despite the model’s simplicity, excellent quantitative agreement was found between the model pre-dictions and our experimental data. This indicates that the model components were well suited for describing the interactions of cells with the wide size range of particles studied here. The derivation leading to Eq. 1 is as follows. According to the DMT model, the forcecupon particle wrapping is given by
c¼4
3ER
0:5z1:52pRDg ð3Þ
providing the following energetic term
FDMT¼
∫
z0cðz`Þdz`¼ 8 15ER
0:5z2:52pRDgz ð4Þ
The effective Young’s modulus,E, in the case of a rigid bead is given byE¼ E1
1u2
1 whereE1andn1are, respectively, the elastic modulus and
Poisson ratio of the cell;zis the indentation depth.
Upon contact with a bead, the membrane geometry is approxi-mated as a spherical cap surrounded by a torus sector rim (red and yellow lines, respectively, in Fig. 2F). Then, the bending energy can be written analytically as
Fmem¼0:5k ac=R2þar=R r2
ð5Þ
on September 17, 2020
http://advances.sciencemag.org/
The cap area,ac, can be expressed in terms ofϑas 2pR2(1−cosϑ) with the bead radiusRbeing the radius of curvature.ar, the rim surface area, is
ar¼2pRr
∫
ϑ
0ððRþRrÞsinϑRrsinaÞda
¼2pRrðRþRrÞsinϑ⋅ϑþ2pR2rðcosϑ1Þ ð6Þ
whereRris the rim radius of curvature that is the radius of the torus tube. Scaling arguments imply thatRrºRfor the following simple reason. If we multiply the dimensions of the bead by a given factor, this is equivalent to scaling the whole-cell bead system by the same factor as long as we remain within the regime where the cell can be modeled as half a space. Thus, the rim radius of curvature should be multiplied by the same factor as well. A direct consequence is that the radius of rim curvature should be proportional to the bead size. In our simpli-fied derivation, we assume a constantRrequal to the bead radius
Rr≈R ð7Þ
Thus, summing the membrane terms we obtain
Fmem¼2pksinϑ⋅ϑ ð8Þ
From Eq. 7, we obtainz= 2R(1−cosϑ), and therefore, the DMT term can be written as a function ofϑ, yielding the total change in free energy as written in Eq. 1 of the main text
DFðϑÞ ¼ 2pR2Dgð1cosϑÞ þ3ER3ð1cosϑÞ2:5þ4pksinϑ⋅ϑ ð9Þ
Under small-angle approximationssin≈ϑand 1cosϑ≈ϑ22, we obtain
DFðϑÞ ¼ ðpR2Dgþ4pkÞϑ2þ
ffiffiffiffiffi
9 32
r
ER3ϑ5 ð10Þ
whereDF(ϑ) has a minimum (forϑ≠0) when
~ ϑ¼
ffiffiffiffiffiffiffiffiffiffiffiffiffiffiffiffiffiffiffiffiffiffiffiffiffiffiffiffiffiffiffiffiffiffiffi
0:75p
ER Dg 4k R2 3 s
ð11Þ
This provides the following condition for stable adhesion of the particles to the cell (Eq. 2 in the main text)
R>RcwhereRc≡
ffiffiffiffiffiffi
4k
Dg r
ð12Þ
This is a very important result. For small beads belowRc,DFis a monotonically increasing function, and therefore, it is not expected that particles would be wrapped and taken by cells, as indeed observed in our experimental results [Figs. 1, A and B, and 2, A and B]. Most intuitively,Rcincreases with the membrane bending modulus,k(as for small beads, 3D cell deformations are less relevant and the main energetic penalty comes from membrane deformation) and decreases with the adhesion gain (in terms ofDg).
SUPPLEMENTARY MATERIALS
Supplementary material for this article is available at http://advances.sciencemag.org/cgi/ content/full/6/3/eaax2861/DC1
Fig. S1. Quantification of cell invasiveness in spheroid tests.
Fig. S2. Separate peaks of the FACS diagram corresponded respectively to the number of 2.4-mm beads inside the cells, allowing for accurate FACS sorter cell separation. Fig. S3. Cycle time of cells was not affected by the FACS sorting procedure. Fig. S4. Cell stiffening resulted in a decrease in the uptake capacity of cancer cells. Fig. S5. Zero time control in FACS uptake experiments.
Table S1. Cells parameters calculated from AFM measurements, as well as the critical radius for particle uptake based on the physical model results.
Table S2. Normalization factors of internal bead fluorescence.
Movie S1. An example demonstrating the innate heterogeneity in cancer cell populations in terms of their uptake capacity.
Movie S2. Time evolution of 2.4-mm beads uptake by A375 cells. Movie S3. Time evolution of 2.4-mm beads uptake by 253J cells. Equation S1. Normalization of uptake data.
References (60,61)
View/request a protocol for this paper fromBio-protocol.
REFERENCES AND NOTES
1. J. Chen, W. Zhou, Q. Jia, J. Chen, S. Zhang, W. Yao, F. Wei, Y. Zhang, F. Yang, W. Huang, Y. Zhang, H. Zhang, Y. Zhang, B. Huang, Z. Zhang, H. Jia, N. Wang, Efficient extravasation of tumor-repopulating cells depends on cell deformability.Sci. Rep.6, 19304 (2016). 2. E. L. Baker, J. Lu, D. Yu, R. T. Bonnecaze, M. H. Zaman, Cancer cell stiffness: Integrated roles
of three-dimensional matrix stiffness and transforming potential.Biophys. J.99, 2048–2057 (2010).
3. D. Wirtz, K. Konstantopoulos, P. C. Searson, The physics of cancer: The role of physical interactions and mechanical forces in metastasis.Nat. Rev. Cancer11, 512–522 (2011). 4. P. Friedl, K. Wolf, Tumour-cell invasion and migration: Diversity and escape mechanisms.
Nat. Rev. Cancer3, 362–374 (2003).
5. D. T. Butcher, T. Alliston, V. M. Weaver, A tense situation: Forcing tumour progression.
Nat. Rev. Cancer9, 108–122 (2009).
6. T. N. Seyfried, L. C. Huysentruyt, On the origin of cancer metastasis.Crit. Rev. Oncog.18, 43–73 (2013).
7. S. Kumar, V. M. Weaver, Mechanics, malignancy, and metastasis: The force journey of a tumor cell.Cancer Metastasis Rev.28, 113–127 (2009).
8. S. Suresh, Biomechanics and biophysics of cancer cells.Acta Biomater.3, 413–438 (2007). 9. M. B. Alvarez-Elizondo, D. Weihs, Cell-Gel Mechanical Interactions as an Approach to Rapidly and Quantitatively Reveal Invasive Subpopulations of Metastatic Cancer Cells.
Tissue Eng. Part C Methods23, 180–187 (2017).
10. G. Du, A. Ravetto, Q. Fang, J. M. J. den Toonder, Cell types can be distinguished by measuring their viscoelastic recovery times using a micro-fluidic device.Biomed. Microdevices13, 29–40 (2011).
11. S. Hu, G. Liu, W. Chen, X. Li, W. Lu, R. H. W. Lam, J. Fu, Multiparametric biomechanical and biochemical phenotypic profiling of single cancer cells using an elasticity
microcytometer.Small12, 2300–2311 (2016).
12. A. Adamo, A. Sharei, L. Adamo, B. Lee, S. Mao, K. F. Jensen, Microfluidics-based assessment of cell deformability.Anal. Chem.84, 6438–6443 (2012).
13. T. Liu, O. A. Babaniyi, T. J. Hall, P. E. Barbone, A. A. Oberai, Noninvasive in-vivo quantification of mechanical heterogeneity of invasive breast carcinomas.PLOS ONE10, e0130258 (2015). 14. A. Malandrino, M. Mak, R. D. Kamm, E. Moeendarbary, Complex mechanics of the heterogeneous extracellular matrix in cancer.Extreme Mech. Lett.21, 25–34 (2018). 15. S. Zhang, H. Gao, G. Bao, Physical Principles of Nanoparticle Cellular Endocytosis.
ACS Nano9, 8655–8671 (2015).
16. V. P. Zhdanov, Physical aspects of the initial phase of endocytosis.Phys. Rev. E Stat. Nonlinear Soft Matter Phys.88, 064701 (2013).
17. D. M. Richards, R. G. Endres, The mechanism of phagocytosis: Two stages of engulfment.
Biophys. J.107, 1542–1553 (2014).
18. S. Muro, Challenges in design and characterization of ligand-targeted drug delivery systems.J. Control. Release164, 125–137 (2012).
19. V. P. Torchilin, Drug targeting.Eur. J. Pharm. Sci.11(Suppl 2), S81–S91 (2000). 20. J. L.-S. Au, B. Z. Yeung, M. G. Wientjes, Z. Lu, M. G. Wientjes, Delivery of cancer
therapeutics to extracellular and intracellular targets: Determinants, barriers, challenges and opportunities.Adv. Drug Deliv. Rev.97, 280–301 (2016).
21. C. P. N. Dinney, R. Fishbeck, R. K. Singh, B. Eve, S. Pathak, N. Brown, B. Xie, D. Fan, C. D. Bucana, I. J. Fidler, J. J. Killion, Isolation and characterization of metastatic variants from human transitional cell carcinoma passaged by orthotopic implantation in athymic nude mice.J. Urol.154, 1532–1538 (1995).
S C I E N C E A D V A N C E S |
R E S E A R C H A R T I C L E
on September 17, 2020
http://advances.sciencemag.org/