International Journal of Intelligent Information Systems
2015; 4(2-1): 25-38Published online February 6, 2015 (http://www.sciencepublishinggroup.com/j/ijiis) doi: 10.11648/j.ijiis.s.2015040201.15
ISSN: 2328-7675 (Print); ISSN: 2328-7683 (Online)
Evaluating reverse logistics networks with centralized
centers: An adaptive genetic algorithm approach based on
fuzzy logic controller
YoungSu Yun
Division of Management Administration, Chosun University, Gwangju, Korea
Email address:
To cite this article:
YoungSu Yun. Evaluating Reverse Logistics Networks with Centralized Centers: An Adaptive Genetic Algorithm Approach Based on Fuzzy Logic Controller. International Journal of Intelligent Information Systems. Special Issue: Logistics Optimization Using Evolutionary Computation Techniques. Vol. 4, No. 2-1, 2015, pp. 25-38. doi: 10.11648/j.ijiis.s.2015040201.15
Abstract:
This paper proposes an adaptive genetic algorithm (FLC-aGA) approach based on fuzzy logic controller (FLC) for evaluating the reverse logistics (RL) networks with centralized centers. For the FLC-aGA approach, an adaptive scheme using a fuzzy logic controller is applied to GA loop. Five components which are composed of customers, collection centers, recovery centers, redistribution centers, and secondary markets are used to design the RL networks. For the RL with centralized centers (RLCC), collection center, recovery center, redistribution center and secondary market will be opened alone. The RLCC will be formulated as a mixed integer programming (MIP) model and its objective function is to minimize the total cost of unit transportation costs, fixed costs, and variable costs under considering various constraints. The MIP model for the RLCC is solved by using the FLC-aGA approach. Three test problems with various sizes of collection centers, recovery centers, redistribution centers, and secondary markets are considered and they are compared the FLC-aGA approach with other competing approaches. Finally, the optimal solutions by the FLC-aGA and other competing approaches are demonstrated each other using some measures of performance.Keywords:
Adaptive Genetic Algorithm, Fuzzy Logic Controller (FLC), Reverse Logistics Network, Centralized Centers1. Introduction
In general, supply chain management (SCM) considers two ways of its flow. First flow is a forward logistics network and it considers various components such as row material supply firms, manufacturing firms, distribution centers, retailers and customers. On the other hand, second flow is called as a backward (or reverse) logistics network and it consists of customers, collection centers, recovery centers, redistribution centers, and secondary markets. Of the two flows, especially, reverse logistics (RL) network have recently focused on many researchers since increasing interests in exhaustion of resources and environmental regulation have caused the effective treatment of used products [1-5].
The European working group on reverse logistics defined the RL as “the propose of planning, implementing and controlling flows of raw materials, in process inventory, and finished goods, from the point of use back to point of recovery or point of proper disposal” [1]. In a broader sense, the RL
refers to the distribution activities involved in product return, source reduction, conservation, recycling, reuse, repair, disposal, refurbishment, and remanufacturing [6]. Various sides of the RL fields have been investigated by many researchers [7-12]. Of the sides, a few studies have addressed the problem of determining the optimal locations and numbers of the RL components such as collection centers, recovery centers, etc. [2, 5, 13].
26 YoungSu Yun: Evaluating Reverse Logistics Networks Algorithm Approach Based
of collection center, remanufacturing centers, redistribution center and secondary markets. Two types of RL network were taken into consideration. One is to consider the single RL network with collection center, remanufacturing centers, redistribution center and secondary markets alone and the other is to use the multiple RL networks which collection center, remanufacturing centers, redistribution center and secondary markets can be opened more than one. They compared the single RL network with the multiple RL network using various measures of performance. Finally, the single RL network outperformed the multiple RL network.
The above studies concerning the optimal location and selection problem of RL components can be classified into two ways; the RL with centralized center (RLCC) and the RL with decentralized center (RLDC). In the
products are sent to each central facility, where they are collected, processed, and finally shipped to secondary markets. On the other word, in the RLCC, collection center
centers, redistribution centers and secondary market
opened alone. In the RLDC, however, all used products are sent to at least more than one facility, that is, several
centers, recovery centers, redistribution center secondary markets can be opened. Between the RLCC and the RLDC, the performance of the former has been proved to be more effective than that of the latter [5].
Therefore, in this paper, we use the concept of the RLCC and its detailed components consist of collection center recovery centers, redistribution centers
markets. The RLCC will be formulated by a MIP model and its objective is to minimize the total cost
costs, fixed costs, and variable costs under considering various constraints. The MIP model will be solved by the proposed FLC-aGA approach with a fuzzy logic controller (FLC). Based on the above procedures, the objective of this paper is to develop an efficient MIP model and the FLC approach for the RLCC.
The focus of this paper is to design an adaptive genetic
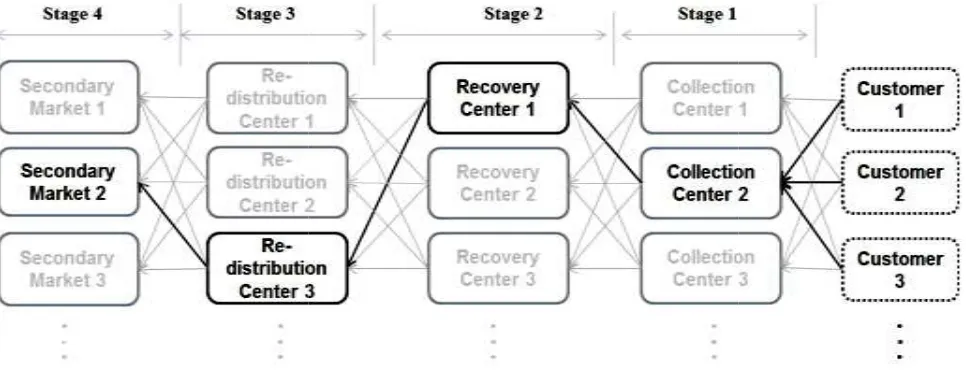
In Figure 1, the used products collected from customers are sent to a collection center, and after classifying them, the
Reverse Logistics Networks with Centralized Centers: An Adaptive Genetic Algorithm Approach Based on Fuzzy Logic Controller
of collection center, remanufacturing centers, redistribution ndary markets. Two types of RL network were taken into consideration. One is to consider the single RL network with collection center, remanufacturing centers, redistribution center and secondary markets alone and the ks which collection center, remanufacturing centers, redistribution center and secondary markets can be opened more than one. They compared the single RL network with the multiple RL network using various measures of performance. Finally, the single RL
work outperformed the multiple RL network.
optimal location and can be classified into two ways; the RL with centralized center (RLCC) and the RL with decentralized center (RLDC). In the RLCC, all used products are sent to each central facility, where they are collected, processed, and finally shipped to secondary markets.
collection centers, recovery and secondary markets will be all used products are sent to at least more than one facility, that is, several collection , redistribution centers and s can be opened. Between the RLCC and rformance of the former has been proved to
Therefore, in this paper, we use the concept of the RLCC collection centers, s and secondary s. The RLCC will be formulated by a MIP model and minimize the total cost of transportation under considering The MIP model will be solved by the proach with a fuzzy logic controller (FLC). Based on the above procedures, the objective of this paper is to develop an efficient MIP model and the FLC-aGA
The focus of this paper is to design an adaptive genetic
algorithm (FLC-aGA) approach based on fuzzy logic controller (FLC) for evaluating the reverse logistics (RL) networks with centralized centers.
follows: Section 2 introduces
reverse logistics networks with centralized centers ( mixed integer programming (MIP
RLCC problem in Section 3. For solving the RLCC problem, the FLC-aGA is proposed in Section 4. Three types of numerical experiments with
problems are considered and they are solved for by the FLC-aGA approach with
in Section 5. Finally, conclusion and some remarks are outlined in Section 6.
2. Reverse Logistics Network with
Centralized Center
Since the RLCC is more efficient than the RLDC
first define the correct status of the RLCC. Generally, the RLCC network consists of various components such as collection centers, recovery centers, etc. In the previous studies, Min et al. [2] considered only two components of initial collection centers and centralized return centers. and Aksen [13] used one component of collection centers. On the other hand, Yun et al. [5] considered various components of collection centers, recovery ce
and secondary markets.
Among the conventional studies mentioned above, we use the basic concept of the RLCC network introduced in Yun et al. [5], since they considered various components in the flow of the RL network, but Min et al.
used only a few components in it. Therefore, the former is more acceptable concept in the RLCC
latters. Figure 1 shows a conceptual model network used in this paper.
Figure 1. Conceptual model for the RLCC network
products collected from customers are collection center, and after classifying them, the
products available for reuse are sent to recovery center revives or repair
Adaptive Genetic
approach based on fuzzy logic controller (FLC) for evaluating the reverse logistics (RL) networks with centralized centers. The paper is organized as s the detailed scheme of the networks with centralized centers (RLCC). A MIP) model is formulated for the For solving the RLCC problem, in Section 4. Three types of numerical experiments with various sizes of the RLCC and they are solved for comparing with other competing approaches conclusion and some remarks are
Reverse Logistics Network with
Centralized Centers (RLCC)
Since the RLCC is more efficient than the RLDC [5], we first define the correct status of the RLCC. Generally, the consists of various components such as collection centers, recovery centers, etc. In the previous considered only two components of initial collection centers and centralized return centers. Aras used one component of collection centers. On considered various components of collection centers, recovery centers, redistribution centers
Among the conventional studies mentioned above, we use the basic concept of the RLCC network introduced in Yun et , since they considered various components in the flow et al. [2] and Aras and Aksen [13] used only a few components in it. Therefore, the former is more acceptable concept in the RLCC network model than the conceptual model for the RLCC
International Journal of Intelligent Information Systems 2015; 4(2-1): 25-38 27
treatments. The revived or repaired products are sent to a secondary market via a redistribution center and are then resold them to customers. The considerations under the RLCC network in Figure 1 are as follows:
The locations of collection centers should be determined for effectively sending the used products collected from customers. The locations of recovery centers, redistribution centers, and secondary markets should also be determined for revival (or repair), redistribution and resale of the used products.
The fixed costs required for the opening of the determined collection center, recovery center, redistribution center and secondary market, and their operation costs for treating unit product should be determined.
The unit transportation costs required for transporting the products at each stage (customers collection center recovery center redistribution center secondary market) should be determined.
3. Mathematical Formulation
Before designing a mathematical model for the RLCC problem, several assumptions considered are as follows:
This paper only considers the RL network for a single product.
The number of customers is already known and each of them sends only one used product to a collection center opened. Therefore, the capacity of all customers is identical with the number of customers.
The locations of customers, collection centers, recovery centers, redistribution centers, and secondary markets are displayed as site coordinates and their values of each location are known in advance.
The fixed costs required for the opening of collection center, recovery center, redistribution center and secondary market are different each other and are already known.
For the RLCC problem, the collection centers, recovery centers, redistribution centers and secondary markets will be opened alone respectively.
Unit handling cost at same stage is identical, since each center (or market) at same stage performs same function. Unit transportation costs at each stage are calculated by the site coordinates of the collection center, recovery center, redistribution center and secondary market opened at each stage. For instance, if the site coordinates of the jth recovery center and the kth redistribution center are (xj, yj) and (xk, yk) respectively, then the unit
transportation cost between the recovery center and the redistribution center is calculated by using the Euclidian distance as follows:
2 2
) ( )
( k j k j
jk x x y y
d = − + − (1)
Based on the assumptions mentioned above, we develop a
mathematical model effectively representing the RLCC problem. The objective of this paper is to design their optimal networks which can minimize the total cost composed of fixed costs, variable costs and transportation costs. The minimization of the total cost is considered as an objective function and various constraints. The indices, parameters and decision variables used in the objective function and various constraints are set as follows:
Indices:
i: index of customer; i∈I
j: index of collection center; j∈J
k
: index of recovery center; k∈Kl
: index of redistribution center; l∈Lm
: index of secondary market; m∈M Parameters:j
FC : fixed cost at collection center j
k
FM : fixed cost at recovery center
k
lFD : fixed cost at redistribution center
l
mFS : fixed cost at secondary market
m
VC : unit handling cost at collection center VM : unit handling cost at recovery center VD : unit handling cost at redistribution center VS : unit handling cost at secondary marketij
CC : unit transportation cost from customer i to collection center j
jk
CM : unit transportation cost from collection center j to recovery center
k
kl
MD : unit transportation cost from recovery center
k
to redistribution centerl
lm
DS : unit transportation cost from redistribution center
l
to secondary marketm
i
CU : capacity at customer
l
Decision variables:
j
c : collection capacity at collection center j
k
m : treatment capacity at recovery center
k
ld : treatment capacity at redistribution center
l
ms : treatment capacity at secondary market
m
=
otherwise
0,
open
is
center
collection
if
,
1
j
x
jC
=
otherwise
0,
open
is
center
recovery
if
,
1
k
x
kM
=
otherwise
0,
open
is
center
tion
redistribu
if
,
1
l
x
lD
=
otherwise
0,
open
is
market
secondary
if
,
1
m
x
mS28 YoungSu Yun: Evaluating Reverse Logistics Networks Algorithm Approach Based
above, we develop a mathematical model for effectively representing the RLCC as follows:
C C C
ij i j j j j j
i j j j
M M M
jk j k k k k k
j k k k
D D D
kl k l l l l l
k l l l
S S S
lm l m m m m m
l m m m
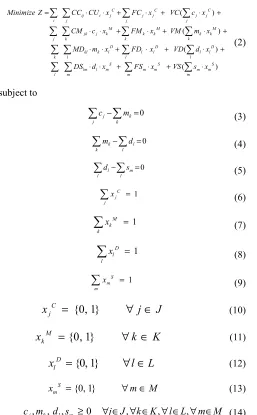
Minimize Z CC CU x FC x VC c x
CM c x FM x VM m x
MD m x FD x VD d x
DS d x FS x VS s x
= ⋅ ⋅ + ⋅ + ⋅ + ⋅ ⋅ + ⋅ + ⋅ + ⋅ ⋅ + ⋅ + ⋅ + ⋅ ⋅ + ⋅ + ⋅
∑ ∑
∑
∑
∑ ∑
∑
∑
∑ ∑
∑
∑
∑ ∑
∑
∑
subject to 0 j k j kc − m =
∑
∑
0
k l k l
m − d =
∑
∑
0
l m
l l
d − s =
∑
∑
1 C j j x =∑
1 M k k x =∑
1 D l l x =∑
1 S m m x =∑
{0, 1}
C jx
=
∀ ∈
j
J
{0, 1}
Mk
x
=
∀ ∈
k
K
{0, 1}
Dl
x
=
∀ ∈
l
L
{0, 1}
S m
x = ∀ ∈m M
, , , 0 , , ,
j k l m
c m d s ≥ ∀ ∈ ∀ ∈ ∀ ∈ ∀ ∈j J k K l L m M
The objective function (2) minimizes the sum of fixed costs, variable costs, and transportation costs resulting from each stage. Equation (3) ensures that the sum of the used products collected in whole collection centers is the same as that treated in whole recovery centers. As the same meaning, equations (4) and (5) ensure that the sums treated in whole re
and redistribution centers are the same as those in redistribution centers and secondary markets, respectively. Equations (6), (7), (8) and (9) show that
recovery centers, redistribution centers and secondary markets should be opened alone. Equations (10), (1
restrict the variables to integers 0 and 1. Equation (1 non-negativity.
The mathematical model formulated in this paper represented as a mixed integer programming (MIP) and FLC-aGA approach is proposed in next Section.
Reverse Logistics Networks with Centralized Centers: An Adaptive Genetic Algorithm Approach Based on Fuzzy Logic Controller
, we develop a mathematical model for effectively
( )
( )
( )
( )
C C C
ij i j j j j j
i j j j
M M M
jk j k k k k k
j k k k
D D D
kl k l l l l l
k l l l
S S S
lm l m m m m m
l m m m
Minimize Z CC CU x FC x VC c x
CM c x FM x VM m x
MD m x FD x VD d x
DS d x FS x VS s x
= ⋅ ⋅ + ⋅ + ⋅ + ⋅ ⋅ + ⋅ + ⋅ + ⋅ ⋅ + ⋅ + ⋅ + ⋅ ⋅ + ⋅ + ⋅
∑ ∑
∑
∑
∑ ∑
∑
∑
∑ ∑
∑
∑
∑ ∑
∑
∑
(2) (3) (4) (5) (6) (7) (8) (9)x
j
J
(10)x
k
K
(11)(12)
(13)
, , , 0 , , ,
c m d s ≥ ∀ ∈ ∀ ∈ ∀ ∈ ∀ ∈j J k K l L m M (14)
bjective function (2) minimizes the sum of fixed costs, variable costs, and transportation costs resulting from each
Equation (3) ensures that the sum of the used products collected in whole collection centers is the same as that treated centers. As the same meaning, equations (4) and (5) ensure that the sums treated in whole recovery centers and redistribution centers are the same as those in redistribution centers and secondary markets, respectively. Equations (6), (7), (8) and (9) show that collection centers, centers, redistribution centers and secondary markets ), (11), (12) and (13) restrict the variables to integers 0 and 1. Equation (14) means
ted in this paper is represented as a mixed integer programming (MIP) and the
proposed in next Section.
4. FLC-aGA Approach
Since the network design such as has been known as NP-complete
approaches are difficult to effectively find the optimal solution. Recently, a methodology using GA approach has been successfully adopted to effectively solve
design problems [2, 4-5]
conventional GA approaches have some weakness in the correct setting of genetic parameters such as crossover and mutation rates. Identifying the correct setting values of genetic parameters is not an easy task, because GA performance considerately relies on their setting values. Therefore, many studies have been performed to locate the correct setting values [16-20].
Most of the conventional studies
recommended the use of adaptive scheme which can automatically regulate GA parameters.
balance between exploitation and exploration in genetic search process highly affects locating the
has been generally known that, during its search process, the approach both with a moderate and various increasing and decreasing trends in its parameter values is more efficient than the approach with rapid increasing or decreasing tr
approach with a constant value.
correct setting of the genetic parameters can be saved, and the search ability of GA can be improved in finding global optimal solution [21].
In this Section, therefore, we de
algorithm approach based on fuzzy logic controller (FLC-aGA) approach. Firstly,
and GA operators will be suggested. Secondly, an adaptive scheme based on a FLC will be followed.
4.1. Representation and Initialization
The most important thing when designing
by GA is how to set a correct representation scheme, since whether collection centers, re
centers and secondary markets are open automatically determined during
Therefore, we design a new representation scheme as shown in Figure 2 to correctly represent the structure of
proposed in this paper.
Figure 2. An example of representation for
In Figure 2, the collection center 3 the collection centers 1 and 2 are As a same meaning, the recovery center 2, and the secondary market
respectively. Therefore, whether collection center, re center, redistribution center and secondary market are open or not is determined by randomly having 0 or 1
Adaptive Genetic
aGA Approach
design such as the RL network problem complete [14-15], conventional approaches are difficult to effectively find the optimal solution.
gy using GA approach has been successfully adopted to effectively solve the RL network 5]. Unfortunately, however, conventional GA approaches have some weakness in the correct setting of genetic parameters such as crossover and on rates. Identifying the correct setting values of genetic parameters is not an easy task, because GA performance considerately relies on their setting values. Therefore, many studies have been performed to locate the correct setting
studies mentioned above have the use of adaptive scheme which can automatically regulate GA parameters. Since keeping a balance between exploitation and exploration in genetic search process highly affects locating the optimal solution, it has been generally known that, during its search process, the both with a moderate and various increasing and decreasing trends in its parameter values is more efficient than with rapid increasing or decreasing trends or the with a constant value. Therefore, much time for the correct setting of the genetic parameters can be saved, and the search ability of GA can be improved in finding global optimal
therefore, we design an adaptive genetic algorithm approach based on fuzzy logic controller ly, representation, initialization and GA operators will be suggested. Secondly, an adaptive
a FLC will be followed.
alization
The most important thing when designing the RL network correct representation scheme, since whether collection centers, recovery centers, redistribution centers and secondary markets are opened or not should be determined during genetic search process. Therefore, we design a new representation scheme as shown 2 to correctly represent the structure of the RLCC
An example of representation for the RLCC
he collection center 3 is opened ( 3 =1 C
x ) and are not opened ( 1 = 2 =0
C C
x
x ).
International Journal of Intelligent Information Systems 201
the total cost should be minimized.
representation scheme, we can easily produce initial population. If population size is 5, then initial population can be generated as shown in Figure 3.
Figure 3. An example of initial population for the RLCC
4.2. Genetic Operators
4.2.1. Selection
The selection strategy is to choose the respective individuals from the current population. Therefore, the chosen individuals are considered as the population of the next generation. For selection, the elitist selection strategy in an enlarged sampling space [15] is used.
4.2.2. Crossover
For improving the solution quality during genetic search process, a crossover operator is needed for exchanging some genes between individuals. In this paper, we develop crossover operator for the RLCC. The detailed implementation procedure is as follows:
Step 1: two individuals are randomly selected in population. Step 2: two genes in the selected individuals are randomly selected.
Step 3: the values of the selected genes are exchanged with each other. If the value of the selected gene is exchanged with 1 (the third genes of V4* in Figure 4), then the gene with the
value 1 among the other genes should have the value 0 instead of 1 (the second genes of V4** in Figure 4). On the other hand,
if the value of the selected gene is exchanged with 0 (the third genes of V1* in Figure 4), then select randomly a gene among
the other genes and then the value of the selected gene is exchanged with 1 (the second genes of V1** in Figure 4).
These procedures of the crossover operators for the RLCC are summarized in Figure 4.
Figure 4. An example of crossover operator for the RLCC
International Journal of Intelligent Information Systems 2015; 4(2-1): 25-38
the total cost should be minimized. By using the representation scheme, we can easily produce initial is 5, then initial population can
for the RLCC
he selection strategy is to choose the respective individuals from the current population. Therefore, the chosen individuals are considered as the population of the next generation. For selection, the elitist selection strategy in an
For improving the solution quality during genetic search process, a crossover operator is needed for exchanging some we develop a new for the RLCC. The detailed
two individuals are randomly selected in population. two genes in the selected individuals are randomly
are exchanged with . If the value of the selected gene is exchanged with * in Figure 4), then the gene with the value 1 among the other genes should have the value 0 instead ** in Figure 4). On the other hand, of the selected gene is exchanged with 0 (the third * in Figure 4), then select randomly a gene among the other genes and then the value of the selected gene is
** in Figure 4). ssover operators for the RLCC
for the RLCC
4.2.3. Mutation
A new mutation operator for the RLCC developed as follows:
Step 1: an individual is randomly selected in population. Step 2: a gene in the selected individual
selected.
Step 3: If the value of the selected gene is 0, then the value is exchanged with 1(the fifth genes of
case, the gene with the value 1 among the other genes should have the value 0 instead of 1 (the forth genes of
5). On the other hand, if the value of the selected gene is 1, then the value is exchanged with 0. In this
the other genes is randomly selected and then the value of the selected gene is exchanged with 1.
These procedures of the mutation operators for the RLCC are summarized in Figure 5.
4.2.4. Repair Strategy for Infeasible Link
The physical link at each stage
individuals after crossover and mutation operators infeasible, if the values of the genes of the
changed (e.g., 0 1, or 1 strategy that the link at each
individuals with the changed values of
developed. In this paper, the following heuristic procedure is used for the repair strategy.
Figure 5. An example of mutation operator for the RLCC
Figure 6. Repair strategy for infeasible link in the RLCC
38 29
A new mutation operator for the RLCC problem is
randomly selected in population. he selected individual is randomly
Step 3: If the value of the selected gene is 0, then the value is exchanged with 1(the fifth genes of V5* in Figure 5). In this
case, the gene with the value 1 among the other genes should have the value 0 instead of 1 (the forth genes of V5** in Figure
5). On the other hand, if the value of the selected gene is 1, then the value is exchanged with 0. In this case, a gene among the other genes is randomly selected and then the value of the selected gene is exchanged with 1.
of the mutation operators for the RLCC
Repair Strategy for Infeasible Link
al link at each stage, representing the new individuals after crossover and mutation operators, may be if the values of the genes of the new individuals are 0). Therefore, a new repair stage can be feasible for the individuals with the changed values of the genes should be developed. In this paper, the following heuristic procedure is
An example of mutation operator for the RLCC
30 YoungSu Yun: Evaluating Reverse Logistics Networks with Centralized Centers: An Adaptive Genetic Algorithm Approach Based on Fuzzy Logic Controller
Step 1: Select one individual with the changed values of the gene among the individuals resulting from crossover and mutation operators
Step 2: The gene with value 1 at previous stage is linked to the gene newly having value 1 at current stage. The linked gene at current stage is also linked to the gene with value 1 at the next stage. If all individuals have feasible links, then stop, otherwise go to Step 1.
These procedures of the repair strategy are summarized in Figure 6. The feasible link of the individual (V5) is described
in the representation (a) of Figure 6. If the newly generated individual after crossover and mutation operators is the V5**of
Figure 6, then the link (a) is changed into infeasible one. Therefore, we have to generate a new feasible link using the V5**. The new generated feasible link (b) is just obtained by
connecting the genes with the value 1 at each stage.
4.2.5. Fitness test
Each individual of the population in the FLC-aGA approach should be evaluated by measuring its fitness. The fitness values of each individual are computed by using the objective functions in the equation (2) under satisfying all constraints from the equations (3) through (14) for the RLCC.
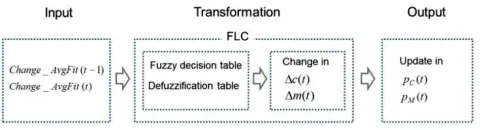
4.3. Adaptive scheme by a FLC
The adaptive scheme used in the FLC-aGA approach is to automatically regulate the rates of the crossover and mutation operators. Many conventional studies have developed various adaptive schemes for regulating the rate [16-19, 22-26]. Of them, several adaptive schemes using FLCs have been successfully adopted for improving the performance of GAs [16,18, 27]. Gen and Cheng [18] surveyed various adaptive schemes using several FLCs. Subbu et al. [27] developed a fuzzy logic-controlled genetic algorithm (FLC-GA) using a fuzzy knowledge base. The developed FLC-GA automatically regulates the rates of the crossover and mutation operators. Song et al. [16] suggested the two FLCs to automatically regulate the rates of the crossover and mutation operators. The suggested two FLCs are used as the input variables of the GA. For successfully applying FLCs to GAs, Subbu et al. [27] and Song et al. [16] proposed the production of well-formed fuzzy sets and rules. Therefore, the GAs which are controlled by these types of FLCs are more efficient in terms of the search speed and solution quality than the GAs without them [16, 18, 27].
Based on the conventional studies using FLCs, we also use an FLC to adaptively regulate the rates of the crossover and mutation operators in this paper. We use the basic concept of Song et al. [16] and improve it in some aspects. The main idea behind the concept is to use the crossover FLC and the mutation FLC. These two FLCs are implemented independently to automatically regulate the rates of the crossover and mutation operators during the genetic search process. The heuristic updating strategy for regulating the rates is to consider the changes of the average fitness values over two successive generations in the FLC-aGA populations.
That is, the rate of the crossover operator (PC) and that of the mutation operator ( PM ) should be increased, if better offspring through the changes are consistently yield. However, thePC and PMshould also be decreased, if poorer offspring are continuously produced. This scheme encourages well-performing operators to produce more individuals, while also reducing the chance for poorly performing operators to destroy the respective individuals during genetic search process.
For example, when a minimization problem is assumed, we can set the change of the average fitness value at generation t,
) ( _AvgFit t
Change , as follows:
_ _
_ _ _
_ 1 1
_ ( ) ( ( ) ( ))
( ) ( )
( )
_ _
par size off size par size off size par size
k k k par size
k
Change AvgFit t Fit t Fit t
Fit t Fit t
par size off size
α
α
+= +
=
= − ×
=
∑
−∑
× (15)where
k
is the generation index andα
is a scaling factor to normalize the average fitness value for applying defuzzification in the FLC. Theα
is varied according to the problem under consideration. The parameter,α
, was not used in the original study [16]. However, theα
is definitely required for normalizing the average fitness value since it is varied according to the problem under consideration. Both Change_AvgFit(t−1) and) ( _AvgFit t
Change are used to regulate pCand
p
M , as shown in Figure 7.Figure 7. Regulation of pCand
p
M using average fitness value.In the above,
β
is a given real number in the proximity of zero, andγ
and−
γ
are given maximum and minimum values of a fuzzy membership function, respectively. The implementation strategy for the crossover FLC is as follows.Input and output for the crossover FLC.
The inputs for the crossover FLC are
) 1 ( _AvgFit t−
Change and Change_AvgFit(t). The output is the change in the crossover rate,
∆
c
(
t
)
. Membership functions of Change_AvgFit(t−1) ,) ( _AvgFit t
International Journal of Intelligent Information Systems 201
The membership functions of the fuzzy input linguistic variables are shown in Fig respectively. Both Change_AvgFit
) ( _AvgFit t
Change are respectively normalized in the range, [-1.0, 1.0].
∆
c
(
t
)
is also normalized in the range of [-0.1, 0.1] with respect to the corresponding maximum values.Fuzzy decision table
The fuzzy decision table developed in study (Song et al. 1997) is used. Defuzzification table for control actions
The defuzzification table to simply represent the action for the crossover FLC should be required. defuzzification table developed in
study [16] is used.
Figure 8. Membership functions of Change AvgFit t
_ ( )
Change AvgFit t
Figure 9. Membership function of ∆
In the Figures 8 and 9, NR means Negative larger, NL Negative large, NM Negative medium, NS Negative small, ZE Zero, PS Positive small, PM Positive medium, PL Positive large, and PR Positive larger.
The inputs of the mutation FLC are the same as th
crossover FLC and the output is the change in the mutation rate,
∆
m t
( )
. The regulating strategy ofmutation FLCs in the FLC-aGA is summarized in Figure 1
Figure 10. Regulation strategy of the crossover and mutation
The detailed procedure for its application is as follows. Step 1: The input variables of the FLC for regulating the rates of the crossover and mutation operators are the changes in the average fitness value in two successive generations as follows:
International Journal of Intelligent Information Systems 2015; 4(2-1): 25-38
The membership functions of the fuzzy input and output linguistic variables are shown in Figures 8 and 9,
) 1 (t−
AvgFit and re respectively normalized in the normalized in the range the corresponding maximum
in the conventional
Defuzzification table for control actions
to simply represent the control should be required. The in the conventional
_ ( 1)
Change AvgFit t− ,
( )
c t
∆
Negative larger, NL Negative large, NM Negative medium, NS Negative small, ZE Zero, PS Positive small, PM Positive medium, PL Positive
the same as those of the the output is the change in the mutation the crossover and is summarized in Figure 10.
crossover and mutation FLCs
The detailed procedure for its application is as follows. Step 1: The input variables of the FLC for regulating the rates of the crossover and mutation operators are the changes o successive generations as
_ ( 1)
Change AvgFit t−
Step 2: After normalizing
) ( _AvgFit t
Change , assign these values to the indexes j corresponding to the control actions in the defuzzification table [16].
Step 3: Calculate
∆
c
(
t
)
and02
.
0
)
,
(
)
(
=
×
∆
c
t
Z
i
j
where the contents of
Z
(
i
,
j
)
of Change_AvgFit(t−1) andthe defuzzification table [16]. The values of 0.02 and 0.002 are given to regulate the increasing and decreasing ranges of the rates of the crossover and mutation
Step 4: Update the changes in the rates of the crossover and the mutation operators by using the following equations:
( ) ( 1) ( )
C C
p t = p t− + ∆c t
( ) ( 1) ( )
M M
p t = p t− + ∆m t
The adjusted rates should lie between 0.5 and 1.0 for
) (t
pC and between 0.0 and 0.1 for
4.4. Overall Procedure of the FLC
The detailed metaheuristic procedure approach is as follows.
Step 1: Representation
The representation method as shown in Figure 2 to effectively represent the RLCC
Step 2: Initialization
The initial population is co
obtained by the representation procedur this paper.
Step 3: Fitness test
Equation (2) is used for the fitness test. Step 4: Genetic operators
Selection: The elitist strategy in an enlarged sampling space [18].
Crossover: The crossover operator is used.
Mutation: The mutation operator is used.
Step 5: Adaptation by FLC
The adaptive scheme using the FLC shown in Section is used for automatically regulating the rates of crossover and mutation operators.
Step 6: Termination condition
If a pre-defined maximum number of generations is reached during the genetic search process
steps are terminated; otherwise, g
5. Numerical Experiments
Three types of the RLCC problem scales numerical experiments. Each problem
38 31
_ ( 1)
Change AvgFit t− , Change_AvgFit(t) (16)
Step 2: After normalizing Change_AvgFit(t−1) and assign these values to the indexes i and corresponding to the control actions in the defuzzification
and
∆
m
(
t
)
as follows:
∆
m
(
t
)
=
Z
(
i
,
j
)
×
0
.
002
(17) are the corresponding values andChange
_
AvgFit
(
t
)
in . The values of 0.02 and 0.002 are given to regulate the increasing and decreasing ranges of the rates of the crossover and mutation operators.anges in the rates of the crossover and the mutation operators by using the following equations:
( ) ( 1) ( )
p t = p t− + ∆c t ,
( ) ( 1) ( )
M M
p t = p t− + ∆m t (18)
The adjusted rates should lie between 0.5 and 1.0 for the and between 0.0 and 0.1 for thepM(t) .
of the FLC-aGA Approach
heuristic procedure for the FLC-aGA
method as shown in Figure 2 is used the RLCC.
The initial population is consisted of the individuals obtained by the representation procedure developed in
d for the fitness test.
Selection: The elitist strategy in an enlarged sampling
Crossover: The crossover operator shown in Section 4.2.2
operator shown in Section 4.2.3
he adaptive scheme using the FLC shown in Section 4.3 for automatically regulating the rates of crossover
: Termination condition
maximum number of generations is during the genetic search process, then all the steps are terminated; otherwise, go to Step 3.
Numerical Experiments
32 YoungSu Yun: Evaluating Reverse Logistics Networks Algorithm Approach Based
of collection centers, recovery centers, redistribution centers and secondary markets. Table 1 summarizes t
types. For each type, the fixed costs, unit handling costs and the site coordinate information at customers, collection
Type No. of Customer No. of collection center
1 30 5
2 30 10
3 30 15
Figure 11. Graphical representation using site coordinate Type 1
For various comparisons, two conventional approaches are used here and their performances are compared with the FLC-aGA approach. They are summarized in Table 2. The aGA approach shown in Table 2 has a heuristic for adaptive scheme (Mak et al. 2000).
Table 2. Approaches for comparison
Approach Description
GA aGA
Conventional GA without any adaptive scheme aGA with the adaptive scheme used in
All the approaches shown in Table 2 were
Visual Basic version 6.0 and ran on the environment of compatible PC Pentium 4 processor, CPU 3
and Window-XP. The parameter settings for the two conventional approaches (GA and aGA) and the FLC approach are as follows: total generation number is
population size is 20, crossover rate is 0.5, and mutation rate is 0.05. The crossover and mutation rates in the GA approach are fixed, but the rates in the aGA and the FLC
are automatically regulated, during genetic search process. Altogether 20 independent runs are made to eliminate the randomness of each approach. All the approaches are compared with each other using some measures of performance shown in Table 3.
In Table 3, the CPU time is averaged over 20
runs. The optimal solution and the optimal setting mean the best result when each approach reaches to a
maximum number of generations.
Reverse Logistics Networks with Centralized Centers: An Adaptive Genetic Algorithm Approach Based on Fuzzy Logic Controller
centers, redistribution centers Table 1 summarizes the sizes of these unit handling costs and the site coordinate information at customers, collection
centers, recovery centers, redistribution centers and secondary markets are listed in Appendixes 1
representation using site coordinate information for Type 1 is displayed Figure 11.
Table 1. Three types of the RLCC
No. of collection center No. of recovery center No. of redistribution center
2 3
4 7
6 9
Graphical representation using site coordinate information for
For various comparisons, two conventional approaches are used here and their performances are compared with the aGA approach. They are summarized in Table 2. The aGA approach shown in Table 2 has a heuristic for adaptive
Approaches for comparison
Conventional GA without any adaptive scheme aGA with the adaptive scheme used in Mak et al. [19]
ere programmed in the environment of IBM .2GHz, 2GB RAM settings for the two conventional approaches (GA and aGA) and the FLC-aGA as follows: total generation number is 10,000, population size is 20, crossover rate is 0.5, and mutation rate is The crossover and mutation rates in the GA approach are fixed, but the rates in the aGA and the FLC-aGA approaches are automatically regulated, during genetic search process. are made to eliminate the . All the approaches are compared with each other using some measures of
, the CPU time is averaged over 20 independent ptimal solution and the optimal setting mean the best result when each approach reaches to a pre-defined
Table 3. Measures
Measure Description
CPU time Average CPU time (in Sec.)
Optimal Solution
The value of minimizing the sum of fixed cost, variable cost, and transportation cost resulting from each stage.
Optimal setting
Fixed cost, variable cost, transportation cost, opening/closing decision at collection centers, recovery centers, redistribution centers, secondary markets in the optimal solution
Table 4. Performance results
CPU Time Optimal solution
Optimal Col. Center Fixed Cost
Setting Var. Cost
Transp. Cost Rec. Center Fixed Cost
Var. Cost Transp. Cost Red. Center Fixed Cost
Var. Cost Transp. Cost Sec. Market Fixed Cost
Var. Cost Transp. Cost
Col. Center 1 Opening/Closi ng
Col. Center 2 ”
Col. Center 3 ”
Col. Center 4 ”
Col. Center 5 ”
Rec. Center 1 ”
Rec. Center 2 ”
Red. Center 1 ”
Red. Center 2 ”
Red. Center 3 ”
Sec. Market 1 ”
Sec. Market 2 ”
Sec. Market 3 ”
Table 4 shows various performance results of each approach for Type 1. Especially, for more detailed comparison, various costs and opening/closing decisions at each collection center, recovery center, redistribution center, and secondary market are shown in terms of the optimal setting.
In terms of the CPU time of Table 4, the GA approach is the slowest, but the aGA and the FLC
almost the same result and the quickest, which means that the aGA and the FLC-aGA approaches appropriately con
search processes rather than the GA approach since the Adaptive Genetic
istribution centers and secondary markets are listed in Appendixes 1 through 6. The graphical representation using site coordinate information for Type 1 is
No. of redistribution center No. of secondary market 3
5 7
easures of performance
Average CPU time (in Sec.)
of minimizing the sum of fixed cost, variable cost, and transportation cost resulting from
Fixed cost, variable cost, transportation cost, pening/closing decision at collection centers, centers, redistribution centers, secondary markets in the optimal solution
erformance results for Type 1
GA aGA FLC-aGA
0.47 0.38 0.39
3272.5 3020.4 3020.4
25.5 25.5 25.5
75.0 75.0 75.0
1227.8 1227.8 1227.8
32.5 32.5 32.5
135.0 135.0 135.0
210.0 210.0 210.0
23.2 20.1 20.1
96.0 96.0 96.0
1080.0 834.0 834.0
25.5 25.5 25.5
48.0 48.0 48.0
294.0 291.0 291.0
Opening/Closi
Closing Closing Closing
Closing Closing Closing Opening Opening Opening Closing Closing Closing Closing Closing Closing Closing Closing Closing Opening Opening Opening Closing Closing Closing Opening Closing Closing Closing Opening Opening Closing Closing Closing Closing Closing Closing Opening Opening Opening
Table 4 shows various performance results of each approach for Type 1. Especially, for more detailed comparison, various costs and opening/closing decisions at each collection
center, redistribution center, and secondary n terms of the optimal setting.
International Journal of Intelligent Information Systems 201
formers have adaptive schemes to automatically regulate a balance between exploitation and exploration during genetic search process. The appropriate control of the search process in the aGA and the FLC-aGA approaches has influence on their performances, that is, the performances of the aGA and the FLC-aGA approaches are more efficient in terms of the optimal solution than that of the GA approach. In terms of the optimal setting, except for the fixed cost and the transportation cost at the redistribution center and the transportation cost at the secondary market, all of the costs in the GA, the aGA and the FLC-aGA approaches have the same values, since the redistribution center 2 in the GA approach is opened, whereas, the redistribution center 3 in the aGA and the FLC approaches are opened.
Figure 12. Graphical representation according to opening/closing decision of the GA approach for Type 1
Figure 13. Graphical representation according to opening/closing decision of the aGA and the FLC-aGA approaches for Type 1
Figures 12 and 13 show the graphical representation according to the opening and closing decisions
collection center, recovery center, redistribution center, and secondary market, when each approach reach to the optimal solution.
In Figures 12 and 13, the opening decisions of collection centers, recovery centers, redistribution centers and secondary markets are represented as a link among them.
In Figs 12 and 13, the used products collected from all the customers are sent to the collection center 3, the recovery
International Journal of Intelligent Information Systems 2015; 4(2-1): 25-38
formers have adaptive schemes to automatically regulate a balance between exploitation and exploration during genetic search process. The appropriate control of the search process aGA approaches has influence on their performances, that is, the performances of the aGA and aGA approaches are more efficient in terms of the optimal solution than that of the GA approach. In terms of the he fixed cost and the transportation cost at the redistribution center and the transportation cost at the secondary market, all of the costs in the GA, the aGA and aGA approaches have the same values, since the roach is opened, whereas, the redistribution center 3 in the aGA and the FLC-aGA
opening/closing decisions
opening/closing decisions
13 show the graphical representation opening and closing decisions of each center, redistribution center, and reach to the optimal
opening decisions of collection nters, redistribution centers and secondary
ink among them.
In Figs 12 and 13, the used products collected from all the customers are sent to the collection center 3, the recovery
center 2 and the secondary market 3 for classifying, repairing and selling them, respectively, which process is happene under the same situation regardless of the GA, the aGA and the FLC-aGA approaches. However, in the opening and closing decision of redistribution centers, the GA approach opens the redistribution center 2, while, the aGA and the FLC-aGA approaches open the redistribution center 3, thus, the former and the latter show different graphical representation. These different site coordinates highly affect the fixed cost and transportation cost. Finally, the optimal solutions of the GA and the two adaptive GAs (a
FLC-aGA) approaches have different results.
Table 5. Performance results
CPU Time Optimal solution
Optimal Col. Center Fixed Cost
Setting Var. Cost
Transp. Cost Rec. Center Fixed Cost
Var. Cost Transp. Cost Red. Center Fixed Cost
Var. Cost Transp. Cost Sec. Market Fixed Cost
Var. Cost Transp. Cost
Col. Center 1 Opening/Closin g
Col. Center 2 ”
Col. Center 3 ”
Col. Center 4 ”
Col. Center 5 Col. Center 6 Col. Center 7 Col. Center 8 Col. Center 9 Col. Center 10
” ” ” ” ” ”
Rec. Center 1 ”
Rec. Center 2 Rec. Center 3 Rec. Center 4
” ” ”
Red. Center 1 ”
Red. Center 2 ”
Red. Center 3 Red. Center 4 Red. Center 5 Red. Center 6 Red. Center 7
” ” ” ” ”
Sec. Market 1 ”
Sec. Market 2 ”
Sec. Market 3 Sec. Market 4 Sec. Market 5
” ” ”
Table 5 shows the performance results for Type 2. In terms of the CPU time, the aGA and the FLC
slightly quicker than the GA approach. In terms of the optimal setting, the GA and the aGA approaches open the collection
38 33
center 2 and the secondary market 3 for classifying, repairing and selling them, respectively, which process is happened under the same situation regardless of the GA, the aGA and aGA approaches. However, in the opening and closing decision of redistribution centers, the GA approach opens the redistribution center 2, while, the aGA and the he redistribution center 3, thus, the former and the latter show different graphical representation. These different site coordinates highly affect the fixed cost and transportation cost. Finally, the optimal solutions of the GA and the two adaptive GAs (aGA and
aGA) approaches have different results.
erformance results for Type 2
GA aGA FLC-aGA
0.98 0.70 0.72
5614.3 5498.4 4927.2
12.8 12.5 10.2
105.0 105.0 105.0
1482.0 913.4 974.5
36.5 36.5 36.5
324.0 324.0 324.0
825.0 1278.0 648.0
10.5 10.5 10.5
192.0 192.0 192.0
795.0 795.0 795.0
10.5 10.5 10.5
75.0 75.0 75.0
1746.0 1746.0 1746.0
Opening/Closin
Closing Closing Opening
Closing Opening Closing Closing Closing Closing Closing Closing Closing Closing Closing Opening Closing Closing Closing Closing Closing Closing Closing Closing Closing Closing Closing Closing Closing Closing Closing Closing Closing Closing Closing Opening Closing Closing Opening Closing Closing Opening Closing Closing Closing Closing Closing Closing Closing Closing Closing Closing Opening Closing Closing Closing Closing Opening Closing Closing Closing Closing Opening Closing Closing Closing Closing Closing Closing Closing Closing Opening Closing Closing Opening Closing Closing Opening Closing
34 YoungSu Yun: Evaluating Reverse Logistics Networks with Centralized Centers: An Adaptive Genetic Algorithm Approach Based on Fuzzy Logic Controller
centers 7 and 2, respectively, whereas, the FLC-aGA approach opens the collection center 1. Each collection center opened has different fixed costs and different site coordinates. Therefore, the fixed costs at each approach are different each other, and the transportation costs between all the customers and each collection center opened are also different. The difference of the transportation costs between each collection center opened and each recovery center opened is interpreted by the difference among the site coordinates at each collection center opened. These differences on the fixed cost, transportation cost, and site coordinates at each approach have greatly influence on the optimal solution, that is, the performance of the FLC-aGA approach is superior to those of the GA and the aGA approaches.
For Type 3, the performance results of each approach are shown in Table 6. Similar to the result analysis of Table 5, the aGA and the FLC-aGA approaches are slightly quicker than the GA approach in terms of the CPU time. The optimal solutions of each approach are greatly influenced by the fixed costs, variable costs, and transportation costs resulting from the collection centers, recovery centers, redistribution centers and secondary markets opened. By the influence, the performance of the FLC-aGA approach has the best result in terms of the optimal solution.
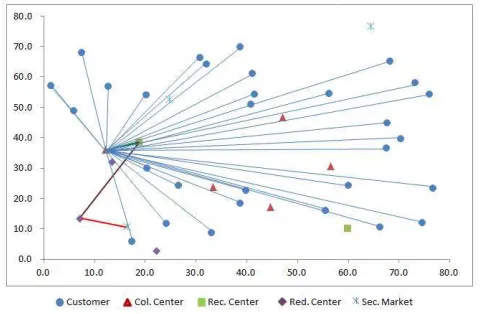
Figure 14. Graphical representation according to opening/closing decisions of the GA approach for Type 3
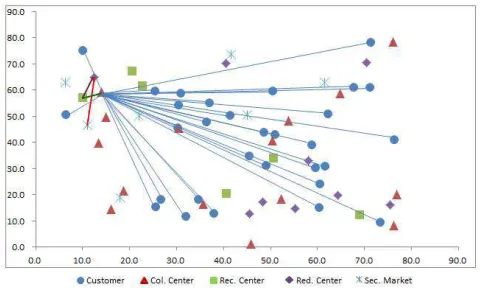
Figure 15. Graphical representation according to opening/closing decisions of the aGA approaches for Type 3
Figure 16. Graphical representation according to opening/closing decisions of the FLC-aGA approaches for Type 3
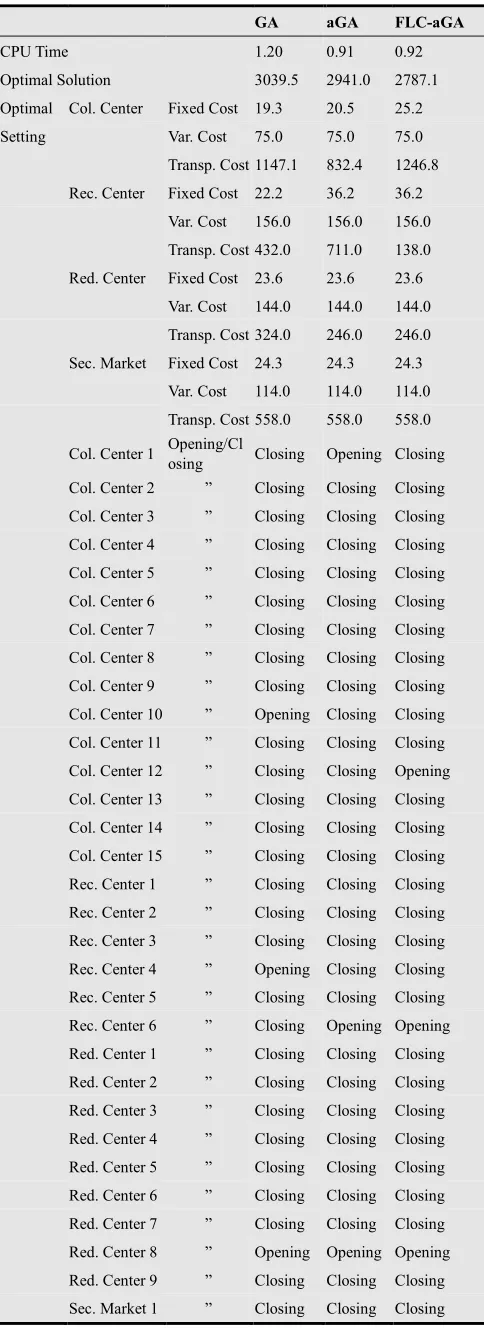
Figures 14, 15 and 16 show the graphical representation according to opening and closing decisions of each collection center, recovery center, redistribution center, and secondary market, when each approach reach to the optimal solution. In the Figures, the GA, the aGA and the FLC-aGA approaches open the collection centers 10, 1 and 12, respectively. Therefore, the former and the latter have different site coordinates and show different graphical representation in Figures 14, 15 and 16, which has greatly influence on the fixed cost and transportation cost at the collection centers and recovery centers opened. By the influence, the optimal solutions of each approach have different results as shown in Table 6.
Figure 17 shows the convergence process of each approach for Type 3, until each approach reaches a pre-defined maximum number of generations (in our case, 10,000). Each approach show fast convergence processes during the initial generations. However, after these generations, the GA and the aGA approaches does not show any convergence behaviors, whereas, the FLC-aGA approach shows a convergence behavior after about the generations of 2,200. By the difference of these convergence behaviors, we can confirm that the performance of the FLC-aGA approach is significantly superior to those of the GA and the aGA approaches as shown in Table 6.
International Journal of Intelligent Information Systems 2015; 4(2-1): 25-38 35
Table 6. Performance results for Type 3
GA aGA FLC-aGA
CPU Time 1.20 0.91 0.92
Optimal Solution 3039.5 2941.0 2787.1
Optimal Col. Center Fixed Cost 19.3 20.5 25.2
Setting Var. Cost 75.0 75.0 75.0
Transp. Cost 1147.1 832.4 1246.8
Rec. Center Fixed Cost 22.2 36.2 36.2
Var. Cost 156.0 156.0 156.0
Transp. Cost 432.0 711.0 138.0
Red. Center Fixed Cost 23.6 23.6 23.6
Var. Cost 144.0 144.0 144.0
Transp. Cost 324.0 246.0 246.0
Sec. Market Fixed Cost 24.3 24.3 24.3
Var. Cost 114.0 114.0 114.0
Transp. Cost 558.0 558.0 558.0
Col. Center 1 Opening/Cl
osing Closing Opening Closing
Col. Center 2 ” Closing Closing Closing
Col. Center 3 ” Closing Closing Closing
Col. Center 4 ” Closing Closing Closing
Col. Center 5 ” Closing Closing Closing
Col. Center 6 ” Closing Closing Closing
Col. Center 7 ” Closing Closing Closing
Col. Center 8 ” Closing Closing Closing
Col. Center 9 ” Closing Closing Closing
Col. Center 10 ” Opening Closing Closing
Col. Center 11 ” Closing Closing Closing
Col. Center 12 ” Closing Closing Opening
Col. Center 13 ” Closing Closing Closing
Col. Center 14 ” Closing Closing Closing
Col. Center 15 ” Closing Closing Closing
Rec. Center 1 ” Closing Closing Closing
Rec. Center 2 ” Closing Closing Closing
Rec. Center 3 ” Closing Closing Closing
Rec. Center 4 ” Opening Closing Closing
Rec. Center 5 ” Closing Closing Closing
Rec. Center 6 ” Closing Opening Opening
Red. Center 1 ” Closing Closing Closing
Red. Center 2 ” Closing Closing Closing
Red. Center 3 ” Closing Closing Closing
Red. Center 4 ” Closing Closing Closing
Red. Center 5 ” Closing Closing Closing
Red. Center 6 ” Closing Closing Closing
Red. Center 7 ” Closing Closing Closing
Red. Center 8 ” Opening Opening Opening
Red. Center 9 ” Closing Closing Closing
Sec. Market 1 ” Closing Closing Closing
GA aGA FLC-aGA
Sec. Market 2 ” Closing Closing Closing
Sec. Market 3 ” Closing Closing Closing
Sec. Market 4 ” Closing Closing Closing
Sec. Market 5 ” Closing Closing Closing
Sec. Market 6 ” Opening Opening Opening
Sec. Market 7 ” Closing Closing Closing
According to the above mentioned various analysis results using Types 1, 2 and 3, we can conclude the following:
The aGA and the FLC-aGA approaches with adaptive schemes are more efficient in terms of the CPU times and the optimal solutions than the GA approach without any adaptive scheme, since the formers are well regulate the genetic search process to reach their optimal solutions rather than the latter does.
Of the aGA and the FLC-aGA, the adaptive scheme using the FLC in the FLC-aGA approach outperforms that using the heuristic in the aGA approach.
The FLC-aGA approach more effectively represents various types of the RLCC than the GA and the aGA approaches.
6. Conclusion
This paper has proposed a FLC-aGA approach to effectively solve various types of the RLCC problems. For the FLC-aGA approach, a new representation, crossover operator, mutation operator and repair strategy have been employed, and a FLC has been used for an adaptive scheme. The used FLC can automatically regulate the rates of crossover and mutation operators during genetic search process.
For designing the RLCC network model, four stage networks have been considered and they are composed of customers, collection centers, recovery centers, redistribution centers, and secondary markets. Various constraints including unit transportation costs, fixed costs, and variable costs have been considered at each stage. Since the objective of designing the RLCC network model is to minimize the total cost resulting from each stage, we have suggested a mathematical model using mixed integer programming.
In numerical experiment, three types of the RLCC problem with various sizes of collection centers, recovery centers, redistribution centers, and secondary markets have been suggested and they have been solved using the GA approach without any adaptive scheme, the aGA with an adaptive scheme using the conventional heuristic, and the proposed FLC-aGA approach with an adaptive scheme using the FLC. Some measures of performance have been used for comparing the efficiency among each approach. Finally, the FLC-aGA approach has been proved to be more efficient than other competing approaches (GA and aGA).