SHIV SHAKTI
International Journal of in Multidisciplinary and
Academic Research (SSIJMAR)
Vol. 4, No. 3, June 2015 (ISSN 2278 – 5973)
RED Routing Algorithm in Active Queue Management
for Transmission Congesstion Protocol
Manu Yadav* Dr. Pushpender Sarao** *M.Tech Student **Professor
Dept.of Computer Sci. & Engineering Dept.of Computer Sci. & Engineering Somany Institute of Tech. & Mgt.,Rewari Somany Institute of Tech. & Mgt.,Rewari
Haryana ,India Haryana,India
[email protected] [email protected]
Impact Factor = 3.133 (Scientific Journal Impact Factor Value for 2012 by Inno Space Scientific Journal Impact Factor)
Global Impact Factor (2013)= 0.326 (By GIF)
Indexing:
Abstract-
Computer networks is also defined as network, which consists of one or more computers or any other devices like routers, switches, hub etc. They are linked together and interact to each other and shares data. The devices on the network are referred to as nodes. These nodes communicate with each other by using medium such as twisted pair cable, Ethernet cable, Optical fiber cables and radio waves .They are arranged according to various topologies such as bus, ring, tree etc.
Computer networks have gone through a sudden growth over the past few years and with that growth have come severe congestion problems. Internet congestion occurs as the demand increases than available resources. The congestion creates many problems like data loss, long delay, waste of resources and others. It has a huge influence to both wired network and wireless network and causes the problem of packet loss, packet delay and lock out.
To control congestion there are many techniques, such as exponential back off, congestion control in TCP, priority schemes and queue management.
Queue management is a way to control the queue size of the bottlenecks. It contains passive queue management, which drops packet when the queue is full and active queue management which drops the packets before buffer getting full. Drop Tail and random Early Detection (RED) are algorithms that represent the two ways respectively. RED is more complicated but can avoid congestion and lockout.
Introduction to RED :
fairly evenly spaced intervals, in order to avoid biases and global synchronization, and to mark packets sufficiently constantly to control the average queue size .
In this algorithm, the RED gateway computes the average queue size by using a low pass filter with an exponential weighted moving average. The average queue size is compared to two thresholds one is a minimum and the other is
maximum threshold. When the average queue size is smaller than the minimum threshold, no packets are marked. When the average queue size is greater than the maximum threshold, every arriving packet is marked. If all marked packets are dropped or if all source nodes are coordinated, this ensures that the average queue size does not quietly exceed the maximum threshold.
When the average queue size is in between the minimum and maximum thresholds, each arriving packet is marked with a probability 𝒑𝒂, where 𝒑𝒂 is a function of the average queue size 𝒂𝒗𝒈. Every time a packet is marked, the probability that a packet is marked from a particular connection is roughly proportional to that connection’s share of the bandwidth at the gateway.
The second algorithm is for computing the drop or marking probability, which determines how frequently the gateway
drops or marks arrival packets. This algorithm can avoid global synchronization by dropping or marking packets at fairly evenly spaced intervals. Furthermore, by dropping or marking packets, this algorithm can maintain a reasonable bound of the average delay, if the average queue length is under control. The RED router is used for controlling the average queue size at the gateway in response to a dynamically changing load. In the network, as the number of connections increases, the frequency with which the gateway drops packets also increases. The higher throughput for the connections with shorter RTT is due to the bias of TCP’s window increase algorithm in favour of connections with shorter round-trip times Because RED gateways can control the average queue size while considering transient congestion, RED gateways are suitable to provide high throughput and low average delay in high-speed networks with TCP connections that have large windows. The RED gateway can consider the short burst in the queue needed by TCP‟s slow-start phase. Consequently, RED gateways control the average queue size while still allowing TCP connections to smoothly open their windows.
Implementation:
Avg←0 Count ←1
For each packet arrival
Calculate the average queue size 𝑎𝑣𝑔
If 𝑚𝑖𝑛𝑡 ≤ 𝑎𝑣𝑔 <
𝑚𝑎𝑥𝑡
Calculate the probability 𝑝𝑎
with probability 𝑝𝑎:
mark the arriving packet else if 𝑚𝑎𝑥𝑡 ≥ 𝑎𝑣𝑔
mark the arriving packet
RED Final Drop Probability:
𝑝𝑏 = 𝑚𝑎𝑥
𝑝 𝑎𝑣𝑔 −𝑚𝑖𝑛 𝑡
𝑚𝑎𝑥 𝑡 −𝑚𝑖𝑛 𝑡
(1) Where,
𝑝𝑎 = 𝑝𝑏 (1/(1 − 𝑐𝑜𝑢𝑛𝑡 ∗ 𝑝𝑏) (2)
Note: this calculation assumes queue size is measured in packets and If queue size is in bytes, we need to add [3] between [1] and [2].
𝑝𝑏 = 𝑝𝑏∗ 𝑝𝑎𝑐𝑘𝑒𝑡 𝑠𝑖𝑧𝑒
𝑀𝑎𝑥 𝑝𝑎𝑐𝑘𝑒𝑡 𝑠𝑖𝑧𝑒
Average Queue length:
The RED gateway calculates the average queue size, using a low-pass filter with an
exponential weighted moving average (EWMA)
Each time that a packet is marked, the probability that a packet is marked from a particular connection is roughly proportional to that connection’s share of the bandwidth at the gateway. This EWMA is designed such that short-term increases in queue size from bursty traffic or transient congestion do not significantly increase average queue size. Then at every packet arrival, the RED gateway updates the average queue size as
𝒒𝒌+𝟏 = (1 - 𝒘𝒒).𝒒𝒌 + 𝒘𝒒.𝒒𝒌+1
Where
𝒘𝒒= Weight factor
𝒒𝒌= Average queue size
𝒒𝒌+𝟏 = New instantaneous queue size During the period when the RED gateway queue is empty, the average queue size is updated as,
𝒒𝒌+𝟏 = (𝟏 − 𝒘𝒒)𝒎− 𝒒
𝒌
Where,
𝑚= idle time
If the average queue size is between 𝑞𝑚𝑖𝑛
and 𝑞𝑚𝑎𝑥, the packet is dropped with a drop probability 𝑝𝑏that is a function of the average queue size.
𝑝𝑏 (𝑘 + 1) = 0 𝑖𝑓 𝒒𝒌+𝟏 ≤ 𝑞𝑚𝑖𝑛
1 𝑖𝑓 𝑞𝑘+1 ≥ 𝑞𝑚𝑎𝑥
𝑝𝑏 𝑘 + 1 = 𝑞𝑘+1 − 𝑞𝑚𝑖𝑛
𝑞𝑚𝑎𝑥 − 𝑞𝑚𝑖𝑛
. 𝑝𝑚𝑎𝑥
Where
𝑝𝑚𝑎𝑥 = Maximum packet drop probability
Fig 3.2: RED drop probability as a function of average queue size
The final drop probability 𝑝𝑎is given by,
𝑝𝑎 = 𝑝𝑏 1 − 𝑐𝑜𝑢𝑛𝑡. 𝑝𝑏
𝑐𝑜𝑢𝑛𝑡 is the collective number of the packets that are not marked or dropped since the last marked or dropped packet. It is increased by one if the arriving packet is not marked or dropped. Therefore, as 𝑐𝑜𝑢𝑛𝑡 increases, the drop probability increases. However, if the arriving packet is marked or dropped, count is reset to 0.
Simulation Scenarios:
In this thesis, we took three different scenarios’ to simulate RED & RRED.
Table 4.2Experimental Scenarios for
Simulation
Scenarios.no Ta (s) Tb (ms) Rb (Mbps)
Scenario 1 [0.2 – 2] 200 0.25
Scenario 2 1 [100 – 600] 0.25
Scenario 3 1 200 [0.1 – 0.5]
For the three parameters Ta, Tb, Rb of the LdoS attack, we choose 𝑇𝑎=1s reported that LdoS attacks with 𝑇𝑎 ≈ 1𝑠 are most effective. 𝑇𝑏 is set to 200ms and 𝑅𝑏 is set as 0.15Mbps so that the aggregate 𝑅𝑏 of 20 attackers is equal to the bottleneck bandwidth of the network (5Mbps. For each scenario, we fix two parameters and vary the other value. As we see in scenario 1, we vary Ta from 0.2 to 2 while fixing
Tb and Rb. As we see in scenario 1, we vary Ta from 0.2 to 2 while fixing Tb and
Rb. Same procedure we did in case 2 and case 3 by varying Tb and Rb respectively. Varying these parameters aims to examine the robustness of RRED.
Result & Analysis:
1
Scenario 1:-
Varying Ta (s) when Tb(ms) and Rb (Mbps) are constant
.
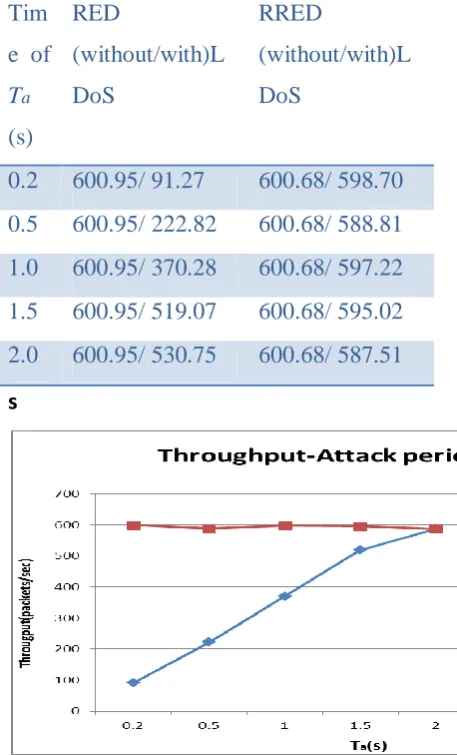
Table 4.3:- Average throughput rate (packets/s) of
normal TCP traffic through the bottleneck link
when there is LDoS attack with respect to varying
attack period.
Tim
e of
Ta
(s)
RED
(without/with)L
DoS
RRED
(without/with)L
DoS
0.2 600.95/ 91.27 600.68/ 598.70
0.5 600.95/ 222.82 600.68/ 588.81
1.0 600.95/ 370.28 600.68/ 597.22
1.5 600.95/ 519.07 600.68/ 595.02
2.0 600.95/ 530.75 600.68/ 587.51
s
Figure 4.2: Throughput-Varying Attack period Ta(ms) In presence of LDoS attacks.
As we can see from the fig. 4.1 In case of attack period increases in the of normal TCP traffic through the bottleneck link when there is LDoS attack, as the
attack peroid increases the throughput varies
Scenario 2:-
Varying Tb (ms) when Ta(s) and Rb (Mbps) are constant.
Table 4.4:- Average throughput rate (packets/s) of
normal TCP traffic through the bottleneck link
when there is LDoS attack with respect to varying
attack burst width.
attack with respect to varying attack burst width.
Tim
e of
Tb
(ms
)
RED
(without/with)L
DoS
RRED
(without/with)L
DoS
100 600.95/ 536 600.68/ 499
200 600.95/ 597 600.68/ 513
300 600.95/ 424 600.68/ 499
400 600.95/ 394 600.68/ 499
500 600.95/ 324 600.68/ 499
600 600.95/ 293 600.68/ 499
As we can see from the fig. 4.2 In case of burst width increases in the of normal TCP traffic through the bottleneck link when there is LDoS attack, as the burst width increases the throughput varies.
Scenario 3:-
Varying Rb (Mbps) whenTb (ms) and Ta (s) are constant
.
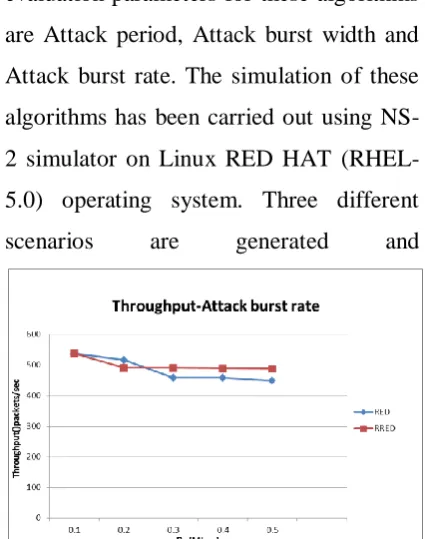
Table 4.5:- Average throughput rate (packets/s) of
normal TCP traffic through the bottleneck link
when there is LDoS attack with respect to varying
attack burst rate(Mbps)
Time
of
Rb(Mb
ps)
RED
(without/with)
LDoS
RRED
(without/with)
LDoS
0.1 600.95/ 537.00 600.68/ 538.00
0.2 600.95/ 516.00 600.68/ 491.00
0.3 600.95/ 498.00 600.68/ 491.00
0.4 600.95/ 458.00 600.68/ 489.00
0.5 600.95/ 448.00 600.68/ 488.00
Fig. 4.4: Throughput-Varying Attack burst rate
Rb(Mbps) in presence LDoS attacks
As we can see from the fig. 4.3 In case of attack burst rate increases in the of normal TCP traffic through the bottleneck link when there is LDoS attack, as the attack burst rate increases the throughput varies.
Conclusion:
RED Active Queue management protocols are studied. The performance evaluation parameters for these algorithms are Attack period, Attack burst width and Attack burst rate. The simulation of these algorithms has been carried out using NS-2 simulator on Linux RED HAT (RHEL-5.0) operating system. Three different scenarios are generated and
In Scenario 1: By fixing the value of Tb
and Rb Varying Attack Period Ta in absence of LDoS attacks it is observed that the throughput i.e. packets per sec are equal in case of RED & RRED. But varying the attack period Ta in presence of LDoS attacks it is observed that the packet loss is less in the case of RRED. In case of RED simulation the packet loss is high and performance is poor as compare to other one.
In Scenario 2: by Fixing the value of Ta
and Rb and Varying Attack Burst Width
Tb in absence of LDoS attacks it is observed that the throughput i.e. packets per sec are equal in case of RED & RRED. But varying the Attack Burst Width Tb in presence of LDoS attacks it is observed that the packet loss is less in the case of RRED. In case of RED simulation the packet loss is high and performance is less than RRED
In Scenario 3: By fixing the value of Ta
and Tb and varying the value of Attack Burst Rate Rb in absence of LDoS attacks it is observed that the throughput i.e. packets per sec are equal in case of RED & RRED. But varying the Attack Burst Rate
Rb in presence of LDoS attacks it is observed that the packet loss is less in the case of RRED. In case of RED simulation
the packet loss is high and performance is poor.
So, conclusion of this simulation after all these scenario’s is that the RRED algorithm is
(i) Highly robust
(ii) RRED can improve the performance of normal TCP traffic through bottleneck link under LDoS attacks and (iii) Obviously it performs
better than RED.
Future Work:
Future study includes evaluation of the framework .Although much research effort has been focused on understanding and utilizing RRED algorithm to leverage the current network, some interesting research topics are yet to be investigated in more detail in future. For example, we have seen the throughput of RRED in presence of LDoS which is better than RED. We can improve the RRED algorithm in future so that it increases the throughput.
Reference:
• S Floyd, M Handley, J Padhye, J Widmer, Equation-based congestion control for unicast applications. Proceedings of ACM SIGCOMM Conference, September 2000, 43–56
• S Floyd, V Jacobson, Random early detection gateways for congestion avoidance. IEEE/ACM Transactions on Networking 1(4), 397–413 (1993). Publisher Full Text OpenURL
• V Lal, JA Summers, ML Masanovic, LA Coldren, DJ Blumenthal, Novel compact inPbased monolithic widely-tunable differential, Mach-Zehnder interferometer wavelength converter for 40Gbps operation. Indium Phosphide and Related Materials (, Scotland, 2005)
• ML Masanovic, V Lal, JS Barton, EJ Skogen, Summonolithically-integreated all-optical wavelength converters. Journal of Ligthwave Technology 23(3) (2005)
• H Park, EF Burmeister, S Bjorline, JE Bowers, 40-Gb/s optical buffer design and simulation. Proceedings of the 4th International Conference on Numerical Simulation of Optoelectronic Devices (NUSOD '04), August 2004, 19–20
• Fisher, US natinal science foundation and the future Internet design. ACM SIGCOMM Computer Communication Review 37(3), 85–87 (2007). Publisher Full Text OpenURL
• G Appenzeller, I Keslassy, N McKeowen, Sizing router buffers. Proceedings of the SIGCOM, 2004, , New York, NY, USA (ACM Press), pp. 281–292
• S Ryu, C Rump, C Qiao, Advances in active queue management (AQM) based TCP congestion control. Telecommunication Systems 25(3-4), 317–351 (2004)