_____________________________________________________________________________________________________ *Corresponding author: Email: [email protected];
7(4): 1-13, 2019; Article no.JERR.52216
Progressive Collapse Potential of Ordinary Moment
Resisting R/C Frames
Ahmed N. Khater
1*, Fouad B. A. Beshara
1, Ahmed A. Mahmoud
1,2and Osama O. El-Mahdy
11Department of Civil Engineering, Faculty of Engineering, Benha University,
Shoubra, Egypt.
2
Higher Institute of Engineering, 15 May, Egypt.
Authors’ contributions
This work was carried out in collaboration among all authors. All authors made equal contributions in conceptualization, formal analysis, validation, visualization, reviewing and editing. All authors supervised the manuscript. All authors carried out the model calibration and applications and wrote the original draft. All authors read and approved the final manuscript.
Article Information
DOI: 10.9734/JERR/2019/v7i416975 Editor(s): (1) Dr. Pijush Samui, Associate Professor, Department of Civil Engineering, NIT Patna, India and Adjunct Professor, Ton Duc Thang University, Ho Chi Minh City, Vietnam. Reviewers: (1) J. Dario Aristizabal-Ochoa, Universidad Nacional de Colombia, Colombia. (2) Nitin Mishra, Graphic Era University, India. Complete Peer review History:http://www.sdiarticle4.com/review-history/52216
Received 08 August 2019 Accepted 15 October 2019 Published 22 October 2019
ABSTRACT
A nonlinear numerical procedure in joint with suitable constitutive concrete and steel models is proposed to simulate the structural behavior and progressive collapse potential of ordinary moment-resisting frames exposed to a middle column removal scenario. Previous experimental results are used to verify the proposed non-linear finite element modelling using ANSYS program. The geometrical discretization of the ANSYS in accordance with concrete and reinforcing steel bars constitutive models have been employed in the suggested approach. The proposed numerical model succeeded in simulating the pre-peak and post-peak behavior in addition to the catenary action stage until reaching the failure of ordinary frames specimens. Numerical predictions are given for the cracking patterns, load-deflection curves, and steel strain-deflection relations.
Keywords: Reinforced concrete; ordinary moment frames; progressive collapse; finite element; nonlinear analysis.
1. INTRODUCTION
In the last two decades, there has been a considerable interest from researchers and governments in determining the ability of concrete buildings to resist progressive collapse. There is more than one technique to reduce the potential of the progressive collapse in buildings [1,2]. The first of these techniques is called event control by preventing the causes of external collapse through barriers surrounding the buildings. The direct design method is the second technique, which is based on the structural analysis of the buildings, taking into account the ability of the structure to face any abnormal hazards at the design stage. The third technique iscalled the indirect method, which is not based on the computational analysis of the structures to deal with abnormal loads, but rather, guarantees a minimum quantity of links between typical structural elements. Resistive and reasonable design to resist successive collapses of buildings, must include a combination of direct and indirect design methods in order to strengthen the different building elements, and consequently to utilize the benefits from each technique [2]. The previous hypotheses have been translated into reservations through various design codes. These reservations should ensure a high degree of resistance, ductility, and flexibility that contribute in forming of structural robustness and integrity. The ACI-318-14 [3] adopted this theory by specifying certain requirements, recommendations and details for the bottom and the top reinforcing bars in order to reduce the successive collapse of the buildings.
Design codes adopt three types of reinforced concrete (R/C) frames: a) Ordinary Moment Resisting Frames (OMRF) which is assembly of beams and columns with limited requirements for ensuring a certain level of ductility in non/low-seismic regions; b) Intermediate Moment Resisting Frames (IMRF) that contain particular reinforcing steel detailing in order to achieve the desired level of ductility in low/mid-seismic regions; and c) Special Moment Resisting Frames (SMRF) that contain particular reinforcing steel detailing in order to achieve the desired level of ductility in mid/high-seismic regions. Full requirements for these types of
frames are listed and detailed in design codes e.g. [3,4]. OMRF is the most common frames that are used in concrete buildings, and is designed under the effect of gravity loads only without any seismic action. Therefore, the focus of the present study is concerned with OMRF in order to maintain a complete vision for the behavior of framed assemblages in resisting the progressive collapse. The finite element modelling in this paper is a part of a comprehensive research [5] on the experimental behavior and computational modelling for the progressive collapse of R/C substructures due to the center column removal scenario. The present paper is concerned with the development of a numerical model for R/C framed substructures under progressive collapse. All the analyses were done using ANSYS finite element program [6], and the results are compared with the experimental ones.
2. GEOMETRICAL MODELLING FOR THE TESTED SPECIMENS
2.1 Properties of Materials and
Specimens Configurations
Khater et al.; JERR, 7(4): 1-13, 2019; Article no.JERR.52216
Fig. 1. Ordinary frame specimen S1 reinforcement details [5]
Table 1. Details of ordinary frames specimens
Speci
m
en Beam
Width (b) mm
Beam height (h) mm
Beam longitudinal reinforcing steel bars and its percentage (
)Shear links spacing (mm) Section 1-1
at beam mid-span
Section 2-2
adjacent to the exterior columns
Top Bottom Top Bottom
S1 120 250 2 ϕ 10 (0.59%)
2 ϕ 10 (0.59%)
2 ϕ 10 (0.59%)
2 ϕ 10 (0.59%)
ϕ 6@100
S2 120 250 2 ϕ 12 (0.86%)
2 ϕ 10 (0.59%)
2 ϕ 12 (0.86%)
2 ϕ 10 (0.59%)
ϕ 6@100
S3 120 250 2 ϕ 10 (0.59%)
2 ϕ 12 (0.86%)
2 ϕ 10 (0.59%)
2 ϕ 12 (0.86%)
ϕ 6@100
High tensile deformed steel bars with diameters of 10 and 12 mm were used for longitudinal reinforcement in the specimens, and mild steel round bars with 6 mm diameters were used for stirrups. Tensile tests were conducted
on a sample of reinforcing bars to determine their true mechanical tensile properties. Table 2 lists the measured tensile properties of the used bars during the experimental tests.
Table 2. Properties of reinforcing steel bars
Diameter (mm) Type Yield strength (MPa)
Ultimate strength (MPa)
Elongation (%)
6 Mild steel 323 478 28.8
10 High-tensile steel 498 762 19.4
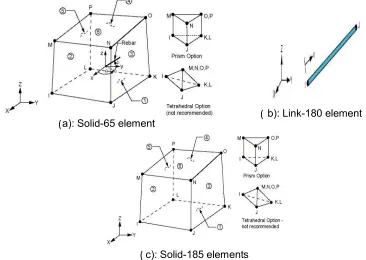
2.2 Finite Element Idealization for the Selected Elements
The beams and columns concrete elements were modeled using 3-D Solid-65 element. This element has the ability to simulate the behavior of reinforced concrete that includes cracking and crushing of concrete in three orthogonal directions in addition to the capability of forming plastic deformations. Fig. 2a shows that Solid-65 element has eight nodes and three degrees of freedoms as given in [6]. The longitudinal and transverse reinforcements of the tested specimens were simulated by using the advantages of Link-180 element. The link element consists of two nodes with three degrees of freedom as shown in Fig. 2b. The reasons for choosing this element to simulate the behavior of reinforcing steel bars is its ability to maintain plastic deformations [6]. Both concrete and steel elements are connected in common nodes so a full bond between the two elements is adopted. In order to overcome the problem of stress concentrations under loading points and supports, 20 mm bearing plates were simulated using Solid-185 elements. This element has eight
nodes and three degrees of freedom per each node as shown in Fig. 2c. Solid-185 element avoids the bearing collapse of concrete elements and it is recommended to be used instead of Solid-45 element [6].
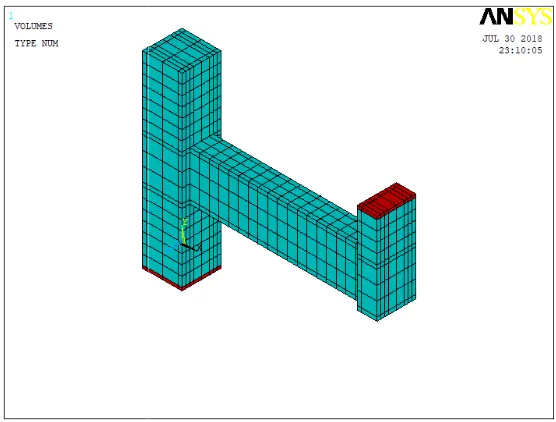
2.3 Typical FE Mesh for R/C
Substructures
In order to obtain appropriate results, a rectangular mesh has been used for concrete Solid-65 elements as recommended by Kachlakev et al. [7]. Consequently, the tested beam elements were typically discretized using 70x70x100 mm mesh, the columns elements were modelled using 75x75x70 mm mesh. Fig. 3 shows the typical mesh that was created for OMRF frames. Longitudinal and transverse reinforcements were created and modelled through the nodes of concrete elements. Fig. 4 presents the reinforcing steel bars configurations that were modeled in ANSYS. Only half of the specimen was modeled to take advantage of the symmetry in the samples geometry and reinforcement thus accelerating both solution and modelling time.
Fig. 2. Selected elements for the modeling of the specimens
(
a): Solid-65 element(
c): Solid-185 elementsFig. 3. Finite element idealization of ordinary frame specimens
Fig. 4. Longitudinal and transverse reinforcement typical idealization
3. MATERIALS MODELLING
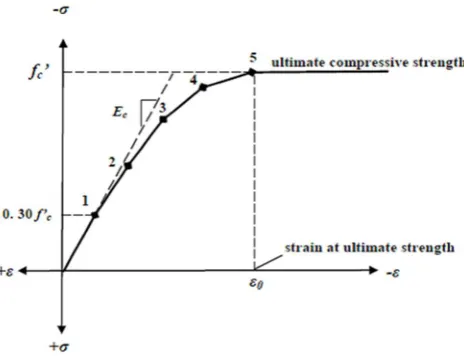
3.1 The Constitutive Model of Concrete
The five-parameter William-Warnke
criteria were used for concrete stress state in space. For the stress-strain curve in tension, a linear ascending part followed by a linear descending softening part, is used. Fig. 5 shows the compressive stress-strain curve which is adopted in the present study. The curve equations are recommended to be used for the simulation of concrete elements as stated by Desayi and Krishnan, [8]. The pre-peak concrete
Khater et al.; JERR, 7(4): 1-13, 2019; Article no.
Fig. 3. Finite element idealization of ordinary frame specimens
Fig. 4. Longitudinal and transverse reinforcement typical idealization
Concrete
Warnke failure criteria were used for concrete stress state in strain curve in tension, a linear ascending part followed by a linear descending softening part, is used. Fig. 5 shows strain curve which is e present study. The curve equations are recommended to be used for the simulation of concrete elements as stated by peak concrete
stress is presented through Eq. 1 while the post-peak concrete stress is given by Eq. 4 follows:
= / 1 + 0
= `
on condintion that = 0 ≤
= ` ≤ ≤
; Article no.JERR.52216
Fig. 4. Longitudinal and transverse reinforcement typical idealization
stress is presented through Eq. 1 while the peak concrete stress is given by Eq. 4 as
0 ≤ ≤ (1)
(2)
≤ 0.30 ` (3)
Where fc` is defined as the concrete stress, ε0 is the strain at ultimate compressive stress. Ecis the concrete modulus of elasticity and calculated as suggested by MacGregor [9].
EC = 5000 (fc`) 0.50
. (5)
3.2 Constitutive Model for Steel
Reinforcement
Fig. 6. shows the Elastic-perfectly plastic curve which is adopted in the simulation of both transverse and longitudinal reinforcement bars of the specimens. This behavior is identical in compression and tension. At the yielding point, the corresponding stress and strain are given by
fy and εy, respectively. The elasticity modulus of steel is given by Es.
3.3 Material Properties for the ANSYS
Table 3 presents the different parameters that are adopted in the present study in order to define the properties of elements material. Material No.1 is concerned with simulating solid-65 element, the material properties consist of linear isotropic and multilinear isotropic material properties. Poisson's ratio of the concrete was taken as 0.20. The points of concrete stress-strain curve are presented in Table.3. The second material is used to describe solid-185 elements. The material properties of Link-180 element which is used for all reinforcing steel bars were assumed to be bilinear isotropic. Poisson’s ratio for reinforcing steel bars was 0.3.
Fig. 5. Stress-strain curve for concrete in compression
Khater et al.; JERR, 7(4): 1-13, 2019; Article no.JERR.52216
Table 3. ANSYS material properties of ordinary frames specimens
Number of Material
Element category
Parameters values
1 Solid-65 for concrete
Linear Isotropic
Ec 32015 MPa
Poisson's ratio 0.2 Multilinear Isotropic
Strain εc Stress fc` (MPa) Point 1 0.0004 12.50
Point 2 0.0008 23.33 Point 3 0.0015 35.75 Point 4 0.00256 41.0 Point 5 0.0035 39.07 2 Solid-185 for
steel plates
Linear Isotropic
Es 2000000 MPa
Poisson's ratio 0.3 3 Link-180 for
steel bars
Linear Isotropic
Es 200000 MPa
Poisson's ratio 0.3 Bilinear Isotropic ( Longitudinal Reinforcement) Yield stress fy 512 MPa Bilinear Isotropic ( Transvers Reinforcement) Yield stress fy 323 MPa
4. RESULTS AND DISCUSION
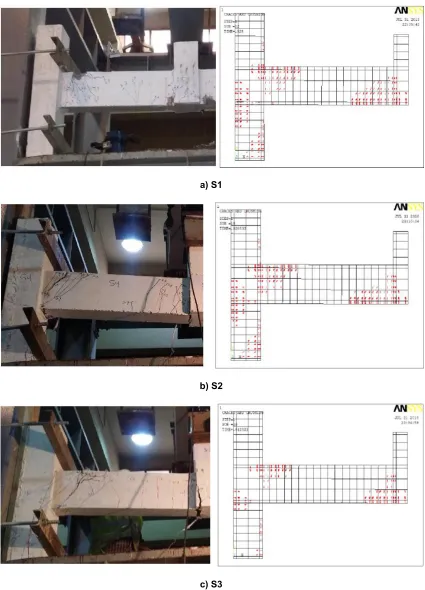
4.1 Predicted Failure and Cracking
Patterns
The predicted and experimental cracking patterns for the three specimens are shown in Fig. 7. Generally, there is a good agreement between the numerical predictions and testing results.
The examination of the figure and the results in Tables 4 and 5, leads to the following points:
Comparing the numerical and the experimental results for S1 in Fig 7a, shows that flexural cracks are concentrated near the central column stub and at the upper sections of the beam and exterior columns. Referring to Table 4, the onset predicted crack appeared at the lower middle beam section at a load of 13.35 kN which is 6.45% higher than the experimental load. The predicted onset crack deflection was 1.93 mm, this deflection is 3.20% higher than the tested deflection as shown in Table 5. More cracks started to occur with the increase of the load's intensity. After touching the ultimate predicted load of 75.34 kN, it was noted that the crushing of concrete
happened at the upper beam middle sections and lower beam end sections which are subjected to excessive compressive stresses.
Fig. 7b presents the cracking patterns for specimen S2, the expected initial crack happens at 19.34 kN which is 3.36% higher than the experimental load (18.71 kN) as shown in Table 4. The predicted onset crack deflection was 2.98 mm, this deflection is 34.80% higher than the tested deflection as shown in
Table 5. Recent cracks have arisen with the intensification of the applied load's intensity. The specimen failed when the predicted vertical deflection reached 107.7 mm which is 6.34% higher than the experimental deflection (101.27 mm).
Fig. 7c shows the cracking patterns for specimen S3, the initial simulated crack happened at a load of 21.67 kN which is 4.93% greater than the experimental load. The first crack deflection was 3.12 mm which is 26.80%
higher than the experimental one. The peak predicted deflection was 12.75
a) S1
b) S2
c) S3
Khater et al.; JERR, 7(4): 1-13, 2019; Article no.JERR.52216
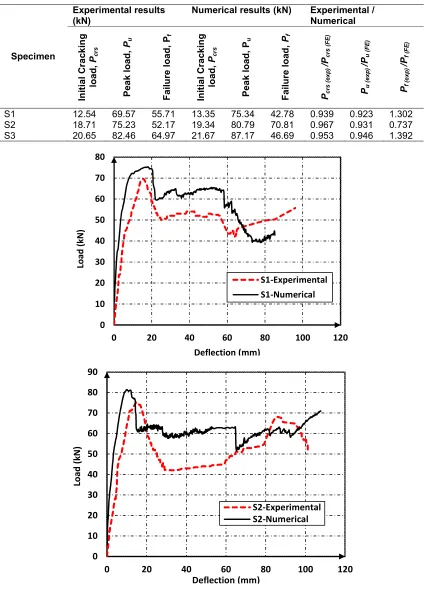
Table 4. Comparison of experimental and numerical loading results
Specimen
Experimental results (kN)
Numerical results (kN) Experimental / Numerical In it ia l C ra ckin g lo ad, Pcr s Pe a k load, Pu Fail ure lo ad, Pf In it ia l C ra ckin g lo ad, Pcr s Pe a k load, Pu Fail ure lo ad, Pf Pcrs (exp ) /P crs (FE)
Pu (e
xp)
/P
u
(FE)
Pf (e
xp) /P f (F E )
S1 12.54 69.57 55.71 13.35 75.34 42.78 0.939 0.923 1.302 S2 18.71 75.23 52.17 19.34 80.79 70.81 0.967 0.931 0.737 S3 20.65 82.46 64.97 21.67 87.17 46.69 0.953 0.946 1.392
0 10 20 30 40 50 60 70 80
0 20 40 60 80 100 120
Load (kN) Deflection (mm) S1-Experimental S1-Numerical 0 10 20 30 40 50 60 70 80 90
0 20 40 60 80 100 120
Load
(kN)
Deflection (mm)
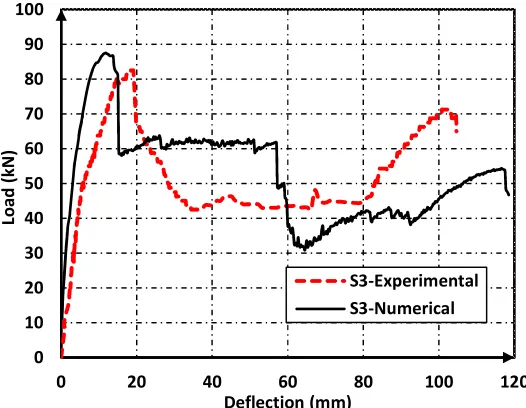
Fig. 8. Experimental and numerical load-deflection curves for S1, S2, and S3
4.2 Predicted Load-Deflection Relations
The numerical and experimental results of the tested frames are summarized in Tables 4 and 5. The comparison between numerical load-deflection curves and experimental ones are shown through Fig. 8 for specimens S1, S2, and S3, respectively. Generally, there is a good
agreement between the numerical predictions and testing results at pre-ultimate,
ultimate, compression arch action, and tensile catenary action stages. By analyzing the results, the following points are drawn;
For the results of specimen S1 shown in Fig. 8, the ratio between the experimental peak load Pu (exp) and the peak predicted load Pu (FE)is 0.923. The predicted deflection at ultimate level is 18.12 mm, which is close enough to the experimental deflection of 15.62 mm. The experimental and numerical load envelopes state that the specimen capacity is decreased after the peak load levels and then the capacity of the specimen rearises again due to the catenary action [10,11,12]. At the failure level, the applied load for the predicted model occurred at a deflection of 85.25 mm, which is close enough to the experimental deflection of 96.07 mm. The predicted failure load was 42.78 kN and the experimental failure load was 55.71 kN.
The predicted load-deflection curves for both experimental and predicted result for specimen S2 are shown in Fig. 8. Before the peak load level, the predicted model results are almost the same as experimental results. The peak applied load for both experimental and predicted model occurred at a deflection of value of 14.75 and 12.12 mm, respectively. The predicted peak load was 80.79 kN and the experimental peak load was 75.23 kN, the difference
between the two values is about 7% which is a good indication for results convergence. At the end of experimental test, the specimen failed at a deflection of 101.27 mm while the predicted model shows that the specimen failed at a deflection of 107.7 mm.
For the results of specimen S3 shown in Fig. 8, the ratio between the experimental peak load Pu (exp) and the peak predicted load Pu (FE) is 0.953. In
Fig.8c, the peak applied load for both experimental and predicted model
occurred at a deflection of value of 18.97 and 12.75 mm, respectively. The predicted peak load was 87.17 kN and the experimental peak load was 82.46 kN, the difference between the two values is about 6%. At the failure level, the applied load for the predicted model occurred at a deflection of 118.5 mm, which is close enough to the
0 10 20 30 40 50 60 70 80 90 100
0 20 40 60 80 100 120
Lo
ad
(kN)
Deflection (mm)
Khater et al.; JERR, 7(4): 1-13, 2019; Article no.JERR.52216
experimental deflection of 104.62 mm. The predicted failure load was 46.69 kN
and the experimental failure load was 64.97 kN.
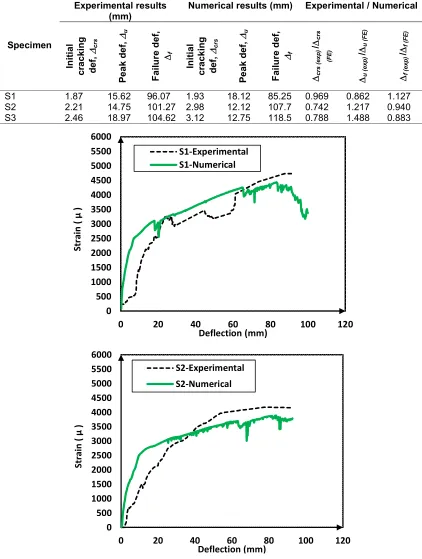
Table 5. Comparison of experimental and numerical deflection results
Specimen
Experimental results (mm)
Numerical results (mm) Experimental / Numerical
In iti al cr a c king def, crs P e a k def , u Fail ur e d ef, f In iti al cr a c king def, crs P e a k def , u Fail ur e d ef, f
crs (exp)
/
crs
(FE)
u (ex
p)
/
u (FE)
f (ex
p)
/
f (FE)
S1 1.87 15.62 96.07 1.93 18.12 85.25 0.969 0.862 1.127 S2 2.21 14.75 101.27 2.98 12.12 107.7 0.742 1.217 0.940 S3 2.46 18.97 104.62 3.12 12.75 118.5 0.788 1.488 0.883
0 500 1000 1500 2000 2500 3000 3500 4000 4500 5000 5500 6000
0 20 40 60 80 100 120
Str ain ( µ ) Deflection (mm) S1-Experimental S1-Numerical 0 500 1000 1500 2000 2500 3000 3500 4000 4500 5000 5500 6000
0 20 40 60 80 100 120
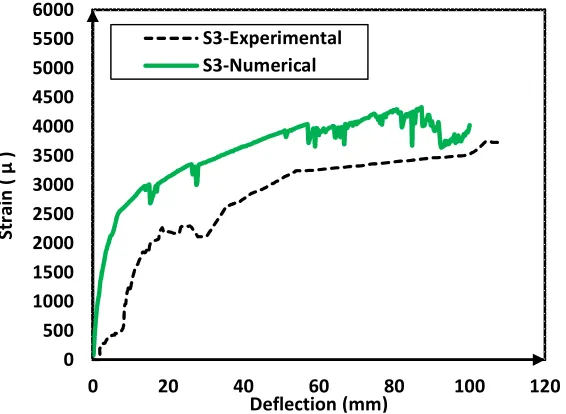
Fig. 9. Experimental and numerical steel strain-deflection relations for S1, S2 and S3
4.3 Predicted Steel Strains-Deflection Relations
The measured and predicted steel strains profile curves for three specimens are presented in Fig. 9. Strain values are given for the bottom reinforcement at mid-span of the beams. Generally, before yielding, the predicted strain-deflection curve is almost linear with the same trend compared to the experimental curve. The predicted bottom reinforcing steel strain in tension yield strain (2500 µ) occurred at a deflection close to the experimental ones. The simulated bottom bars strains continued to increase at the same time the applied forces started to decrease, representing the catenary stage and presenting the same laboratory behavior. In conclusion, there is considerable convergence between the numerical and the experimental results. Then it can be concluded that ANSYS program has the ability to expect reinforcement strains profiles of ordinary frames specimens under column removal scenario.
5. CONCLUSION
From the modelling and validation studies in this paper, the following points are concluded:
1- The ANSYS geometrical model combined with the proposed constitutive models for concrete and steel in compression and tension, has the ability to predict the progressive collapse behavior of ordinary moment-resisting frames with different
reinforcement configurations under the middle column removal scenario. The nonlinear response of all specimens is successfully predicted for different deflection levels until failure.
2- All ordinary moment-resisting frame specimens' failure mode was dominated by flexure action. The formation of large cracking in addition to concrete crushing was concentrated at the beam connections with the eliminated middle column and the exterior columns. The final failure mode is due to concrete crushing at the critical section of the beams.
3- Load resisting capacity of ordinary frames under progressive collapse is increased with the increase of longitudinal reinforcement ratio. Increasing the frames top reinforcement ratios lead to 18% increase in the peak resisting capacity. On the other hand, increasing the frames bottom reinforcement ratios lead to 10% increase in the peak resisting capacity.
COMPETING INTERESTS
Authors have declared that no competing interests exist.
REFERENCES
1. Department of Defense (DoD). Design of structures to resist progressive collapse. Unified Facility Criteria, UFC 4-023-03, Washington, DC; 2016.
0 500 1000 1500 2000 2500 3000 3500 4000 4500 5000 5500 6000
0 20 40 60 80 100 120
St
rai
n
(
µ
)
Khater et al.; JERR, 7(4): 1-13, 2019; Article no.JERR.52216
2. General Services Administration (GSA). Alternate path analysis and design guidelines for progressive collapse resistance. Washington, DC; 2016.
3. ACI American Concrete Institute. ACI 318-14: Building code requirements for structural concrete. Farmington Hills, Michigan, USA; 2014.
4. Egyptian Code of Practice: ECP 203. Design and construction for reinforced concrete structures. Ministry of Building Construction, Research Center for Housing, Building and Physical Planning, Cairo, Egypt; 2007.
5. Ahmed NK. Progressive collapse assessment of reinforced concrete beam-column assemblages. PhD, Faculty of Engineering, Benha University, Cairo Egypt; 2019.
6. ANSYS User Manual. ANSYS Inc., Canonburg, Pennsylvania. 2012;12. 7. Kachlakev D, Miller TP, Yim S, Chansawat
K, Potisuk T. Finite element modeling of reinforced concrete structures
strengthened with FRP laminates, Oregon. Department of Transportation, Research Group, Salem, Oregon; 2001.
8. Desayi P, Krishnan S. Equation for the stress-strain curves of concrete. ACI Journal. 1964;61(3):345-350.
9. MacGregor JG. Reinforced concrete mechanics and design. Prentice-Hall, Inc. Englewood Cliffs, NJ; 1992.
10. Yu J, Tan KH. Special detailing techniques to improve structural resistance against progressive collapse. Journal of Structural Engineering, American Society of Civil Engineers (ASCE). 2014;140(3):4013077. 11. Mehrdad S. Response of a reinforced
concrete infilled-frame structure to removal of two adjacent columns. Engineering Structures. 2008;30:2478–2491.
12. Yi WJ, He QF, Xiao Y, Kunnath SK. Experimental study on progressive collapse-resistant behavior of reinforced concrete frame structures. ACI Structural Journal. 2008;105(4):433-439.
© 2019 Khater et al.; This is an Open Access article distributed under the terms of the Creative Commons Attribution License (http://creativecommons.org/licenses/by/4.0), which permits unrestricted use, distribution, and reproduction in any medium, provided the original work is properly cited.
Peer-review history:
![Fig. 1. Ordinary frame specimen S1 reinforcement details [5]](https://thumb-us.123doks.com/thumbv2/123dok_us/9830516.1969191/3.612.93.521.639.702/fig-ordinary-frame-specimen-s-reinforcement-details.webp)