R E S E A R C H
Open Access
Detection of the third and fourth heart sounds
using Hilbert-Huang transform
Yi-Li Tseng
1, Pin-Yu Ko
2and Fu-Shan Jaw
1** Correspondence: [email protected] 1
Institute of Biomedical Engineering, National Taiwan University, Taipei 10617, Taiwan Full list of author information is available at the end of the article
Abstract
Background:The third and fourth heart sound (S3 and S4) are two abnormal heart
sound components which are proved to be indicators of heart failure during diastolic period. The combination of using diastolic heart sounds with the standard ECG as a measurement of ventricular dysfunction may improve the noninvasive diagnosis and early detection of myocardial ischemia.
Methods:In this paper, an adaptive method based on time-frequency analysis is proposed to detect the presence of S3 and S4. Heart sound signals during diastolic periods were analyzed with Hilbert-Huang Transform (HHT). A discrete plot of maximal instantaneous frequency and its amplitude was generated and clustered. S3 and S4 were recognized by the clustered points, and performance of the method was further enhanced by period definition and iteration tracking.
Results:Using the proposed method, S3 and S4 could be detected adaptively in a
same method. 90.3% of heart sound cycles with S3 were detected using our method, 9.6% were missed, and 9.6% were false positive. 94% of S4 were detected using our method, 5.5% were missed, and 16% were false positive.
Conclusions:The proposed method is adaptive for detecting low-amplitude and
low-frequency S3 and S4 simultaneously compared with previous detection methods, which would be practical in primary care.
Keywords:Third heart sound, Fourth heart sound, Hilbert-Huang Transform, time-fre-quency analysis, Phonocardiogram
1. Introduction
Auscultation has long been important for the diagnosis of heart diseases. Heart sounds heard by a stethoscope can be seen as mechanical instructions that indicate the opera-tion of the cardiac system. The third and fourth heart sounds, which are two abnormal components of heart sounds during diastolic periods, have been found to have rela-tionships with myocardial dysfunction [1-5]. The third and fourth heart sounds have been discovered over a century [6]. The third heart sound (S3) occurs in the rapid fill-ing period of early diastole. It is often present in systolic dysfunction [7]. Abnormal S3 is considered to be caused by altered physical properties of ventricle or increased in the rate and volume of blood flow in the rapid filling phase during ventricle diastole [5]. Sometimes it occurs in children. However, the auscultation of S3 in adults, espe-cially elders older than 40 years old, is abnormal and is connected with heart failure. The fourth heart sound (S4) occurs in late diastolic periods right before the first heart
sound. The presence of S4 is due to the forceful contraction of the atria in an effort to overcome an abnormally stiff or hypertrophic ventricle [8]. It can be detected in patients with diseases of diminished left ventricular compliance, such as acute myocar-dial infarction or ischemia [9].
The importance of S3 and S4 has been notified early in 1970s [5]. In 1997, M. Ishi-kawa et al. discovered that the appearing of S4 during long-term follow-up of acute myocardial infarction may be a strong indicator of poor prognosis [1]. Later in 2006, G. Marcus et al. have indicated that S3 has high specificity and can be a marker of left ventricular dysfunction [3]. In 2009,E. Lee et al. has proved that patients without clini-cal ST criteria for ischemia developed new or increased-intensity S3 and S4 during percutaneous coronary intervention induced ischemia [2]. Therefore, the combination of using diastolic heart sounds with the standard ECG as a measurement of ventricular dysfunction may improve the noninvasive diagnosis of myocardial ischemia.
Several studies have verified the characteristics of S3 and have applied time-fre-quency methods to detect S3 [10,11]. However, there have been no efficient methods specific for S4 detection due to its lower amplitude and uncertain frequency. Time-fre-quency methods have already been used for heart sounds analysis [12], but mainly in the analysis of the first and second heart sounds [13,14]. These advanced signal proces-sing methods, such as Short Time Fourier Transform, Wigner-Ville Distribution, and Wavelet transform, have some limitations [15,16]. The major disadvantage of the Short Time Fourier Transform is the resolution trade-off between time and frequency domain. The Wigner-Ville Distribution provides better resolution in both time and fre-quency domain, but its bilinear characteristic produces cross-term interferences. In recent years, the wavelet transform has become a widely used and versatile time-fre-quency method. The wavelet transform has variable time and fretime-fre-quency resolution, and it is able to carry out local analysis. These advantages made wavelet transform received considerable research attention. In 2005, Hult et al. have developed a wavelet-based method for recognition of S3 [17]. However, the wavelet transform is not an adaptive method. Once the mother wavelet function is generated, it cannot be modi-fied again to adapt to non-stationary signals. As non-stationary signals with large vari-eties of amplitude and frequency, heart sounds with S3 and S4 are more suitable to be analyzed by the Hilbert-Huang transform (HHT). HHT has been used to analyze heart sound signals in previous studies [18,19], while most of these methods are proposed to classify normal heart sound components such as S1 and S2. The analysis of abnormal heart sound components are still in research. Hilbert-Huang transform is a time-fre-quency method proposed by Norden Huang in 1998 [20]. It is a powerful method in the analysis of non-stationary and nonlinear signals. The empirical mode decomposi-tion of HHT can decompose heart sound signals adaptively to numbers of intrinsic mode functions, and Hilbert transform of these functions generates instantaneous fre-quency of signals. Hilbert-Huang transform provides fine resolution of three-dimen-sional time-frequency distribution of energy.
2. Materials and Methods
An adaptive-based algorithm was developed for the detection of S3 and S4 which are non-stationary signals with low amplitude and frequency. The schematic diagram of this recognition method was demonstrated in Figure 1. The proposed method could be divided into three steps: (1) Preprocessing, (2) Hilbert-Huang Transform and (3) Clus-tering and recognition. Details of these three steps were described in the following subsections.
2.1 Preprocessing
Heart sound signals recorded by electronic stethoscopes are often encompassed with high frequency noise, hence preprocessing is essential. As illustrated in Figure 1, the
signals were filtered to eliminate the noise, and followed by normalization and segmen-tation. These steps were illustrated in the following:
Filtering and Smoothing: Since heart sound signals are mainly less than 600 Hz, a Butterworth low-pass filter designed by digital finite impulse response (FIR) was applied. Hilbert transform was then used to produce the envelope of the signals. The envelope was denoted asxenvelope[n], where
xenvelope[n]=x[n]+j×hilbert{x[n]}, (1)
and x[n] was the raw data of heart sound signals.
Normalization:The amplitude of different heart sound signals were all normalized and limited to the scale of [-1 1]. The equation of normalization is in the following:
xnorm[n]=
xenvelope[n] maxxenvelope[n]
. (2)
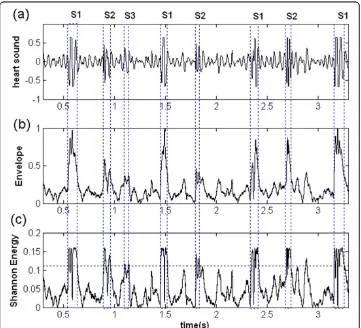
An example of normalization and enveloping of an abnormal heart sound record (Figure 2(a)) was shown in Figure 2(b).
Segmentation: The heart sound signals should be segmented into cycles before pro-cessing. Four terms were recognized during this step: the first heart sound (S1), the second heart sound (S2), systolic period, and diastolic period. To detect these terms
with noise interference rejection, Shannon energy (SE) of signals was used and calcu-lated as follows [21-25]:
SE[n]=−x2norm[n]×logx2norm[n]. (3)
As shown in (3), the feature of Shannon energy was to suppress the low amplitude components of signal [22]. The main components, S1 and S2, would therefore be picked up. Compared with other algorithms, such as absolute value or Shannon entropy, Shannon energy would be better for segmenting of noisy heart sound signals [22].
The Shannon energy of the heart sound record with S3 was shown in Figure 2(c). The threshold value was initially set to 70% of maximal value. If the threshold is cho-sen upper than 70%, some S2 with lower peak would be excluded and missed. But for threshold lower than 70%, noise, murmur, or additional heart sound would easily be picked up and affect the results of S1 and S2 recognition. Nevertheless, higher thresh-old is rather better because it would be easier to re-pick the missing S2 than dealing with noises. S1 and S2 were recognized by three steps in the following [24]:
a. If two peaks higher than the threshold were detected within 50 ms, the one with lower energy was eliminated.
b. For every interval between peaks, an interval with shorter length than the previous interval was denoted as a systolic period, while the other one was a diastolic period. The uncertain intervals were annotated.
c. For those uncertain intervals, a secondary threshold was set to find S1 or S2 which probably not have been recognized.
These steps were applied to ensure that S1 and S2 could be picked out correctly. Systolic and diastolic periods were then recognized. S3 and S4 with larger amplitudes could also be detected during segmentation.
2.2 Hilbert-Huang transform
Instantaneous frequency and its magnitude of preprocessed heart sound signals were extracted by Hilbert-Huang transform (HHT). HHT was used to adaptively decompose the non-stationary and nonlinear signals and extract the instantaneous frequency. As illustrated in Figure 1, HHT consisted of two steps: Empirical mode decomposition (EMD) and Hilbert transform. EMD was used to adaptively decompose the signal into a series of intrinsic mode functions (IMFs). Hilbert transform was then carried out to acquire instantaneous frequency and amplitude and constitute the time-frequency-energy distribution, Hilbert-Huang spectrum, of the signal.
2.2.1 Empirical mode decomposition (EMD)
The heart sound signal was first decomposed to IMFs. To acquire the IMFs, local minima and maxima of the signal were found out. The envelopes of the local minima and maxima were formed by cubic spline fitting, respectively. Let m1(t)denoted as the
average of these two envelopes, and the original signal was subtracted by m1(t) as
fol-lows:
Took h1(t)as a new signal and repeated the process described above until the
result-ing h1(t)met the criterion of the IMF [20]. The resulted signal was the first IMF
defined asc1(t), and the residual signal wasr1(t), where
r1(t)=x(t)−c1(t). (5)
The r1(t) was then considered as a new original signal and the iterative process was
again executed to extract the IMFs until thekth residual signalrk(t)became a singular
function, which meant that no more IMF could be further extracted. The x(t) was therefore expressed by
x(t)= k
i=1
ci(t)+rk(t), (6)
and c1(t)tock(t)werekIMFs of the signal.
EMD method would make the signal more symmetrical by eliminating the riding waves and decomposes the signal adaptively.
2.2.2 Hilbert transform
The second step of HHT, Hilbert transform, extracted the instantaneous frequency and amplitude of each IMF. Each component ci(t) of IMFs was Hilbert transformed,
denoted by yi(t), so:
yi(t)= 1 π
∞
−∞
ci(τ)
t−τdτ. (7)
The combination ofxi(t)andyi(t)was an analytic signal zi(t), where
zi(t)=xi(t)+jyi(t)=ai(t)ejθi(t), (8)
and xi(t)and yi(t) were respectively the real part and imaginary part of zi(t). The
amplitude and phase of zi(t)were defined by the following expressions:
ai(t)=
x2
i (t)+y2i (t), (9)
θi(t)= tan−1
yi(t)
xi(t)
. (10)
Since the definition of the instantaneous frequency was
dωi(t)= dθi(t)
dt , (11)
the original signal could be expressed by
x(t)= n
i=1
ai(t)ej
ωi(t)dt. (12)
2.3 Clustering and Recognition
In this subsection, the relationship between instantaneous frequency and its amplitude were plotted and clustered. By correlating the clustered points with the original sound signal, the positions of S3 and S4 were labeled. For those possibly missing components, an iterative method was applied to enhance the accuracy.
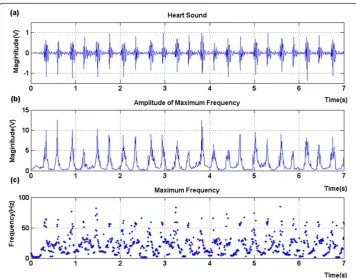
The components with the maximal amplitude of each instantaneous frequency were selected in (12). That is to say, as simplification we considered only the maximal con-tribution of frequency at a time. The extracted instantaneous frequency and its ampli-tude were shown in Figure 3 and 4. A normal heart sound signal was shown in Figure 3(a). There were two major components within a normal beat, the first heart sound (S1) and the second one (S2). In comparison to Figure 3(a), there were additional com-ponents, S3 and S4, during diastolic periods (S2-S1 interval) in Figure 4(a). The ampli-tudes of S3 and S4 were smaller than S1 and S2 with great varieties.
The maximal instantaneous frequency and its amplitude were therefore used to dis-tinguish S3 and S4 from the baseline noise in the interval from S2 to S1. Figure 3(b) and 3(c) illustrated the magnitude of the maximal instantaneous frequency and the amplitude of the frequency, and so did Figure 4(b) and 4(c). Our data were sampled with a sampling frequency of 8000 Hz. Figure 3(c) indicated that the maximal instanta-neous frequency of a normal heart sound was mainly lower than 100 Hz. The S1 and S2 were around 50 Hz. Components of the baseline signal were with low frequency, while there were a few numbers of points carried with larger frequency which might be caused by the baseline noise. However, Figure 4(c) indicated that there were
components with larger instantaneous amplitude or frequency during diastolic periods in an abnormal record with S3 and S4.
Since there were great variations both in the amplitude and in the instantaneous fre-quency of S3 and S4, these two parameters should to be considered simultaneously when we were trying to verify whether there are S3 or S4 in a record. Therefore, we plotted the maximal instantaneous frequency and its magnitude of the S2-S1 interval of the above two heart sounds in Figure 5. The number of points depends on the reso-lution of Hilbert spectrum. Figure 5(a) showed the relationship between the maximal instantaneous frequency and its magnitude in a normal heart sound, whereas Figure 5 Figure 4An abnormal heart sound with the presence of the third and fourth heart sound (a). The magnitude (b) of the maximal instantaneous frequency (c) was indicated.
(b) indicated an abnormal one with S3 and S4 during the S2-S1 interval. It is obvious that the frequency-magnitude distribution of Figure 5(b) was more diverse.
K-mean algorithm was then used as cluster analysis of frequency-magnitude distribu-tion. Also shown in Figure 5(b) with different symbol, the distributed data could be divided into three groups: Normal points with low amplitude and frequency, uncertain points, and abnormal points with high frequency or amplitudes. The group with the fewest number of points was denoted as the last one. These points in the abnormal group could then be projected to the original Hilbert spectrum and the time when abnormal points occurred would be verified. If the abnormal signals occur periodically right before S1, they could be denoted as S4. In contrast, S3 occurs periodically after S2.
An iterative recognition method was then applied for detecting those components that are possibly missing. Since S3 and S4 are various both in amplitude and fre-quency, an adaptive detection method might occasionally misjudge noise signals as heart sound components or vice versa. The iterative recognition method examined whether the detected points were periodically occurring. For those positions where S3 or S4 should have been detected, the method determined if there is a missing point. Consequently, S3 and S4 of heart sound signals could be recognized separately with enhanced accuracy.
3. Results
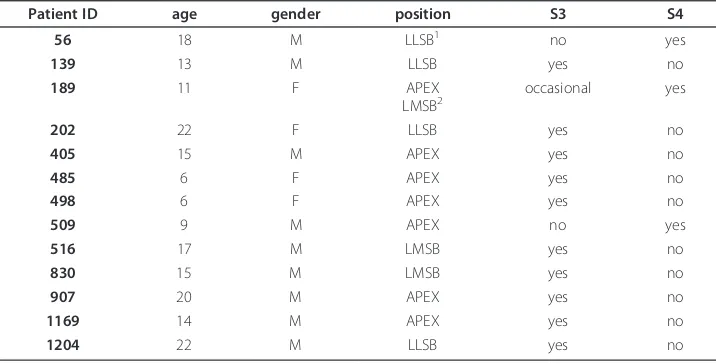
Heart sound records from Cardiac Auscultatory Recording Database (CARD) of Johns Hopkins University [26] were used to verify the recognition accuracy of the proposed method. The CARD database contains up to 800 records, and about 15 records include S3 or S4. Thirteen recording samples were included and the patients’information was provided in Table 1. There were also other databases with one or two samples with S3 or S4. However, for the consideration of their distinct sources of recording and the validation of signals, we only used samples from CARD database as the concern of
Table 1 Information of patients including their ID, age, gender, recording position, the presence of S3 and S4
Patient ID age gender position S3 S4 56 18 M LLSB1 no yes
139 13 M LLSB yes no
189 11 F APEX
LMSB2 occasional yes
202 22 F LLSB yes no
405 15 M APEX yes no
485 6 F APEX yes no
498 6 F APEX yes no
509 9 M APEX no yes
516 17 M LMSB yes no
830 15 M LMSB yes no
907 20 M APEX yes no
1169 14 M APEX yes no
1204 22 M LLSB yes no 1
LLSB = Left Lower Sternal Border
2
reliability. These samples with S3 or S4 were recorded in the position where extra heart sounds were best heard.
An example from one of the patients with S3 and S4 after utilizing the iterative recognition method was shown in Figure 6. For these recording samples, the total cycles for recognition and the results of detection were demonstrated in Table 2. Using the proposed method with iterative recognition, 90.3% of heart beat cycles with S3 were identified, 9.6% were missed and 9.6% were false positive. For S4, 94.4% were detected, 5.5% were missed and 16% were false positive (FP).
The overall performance of the algorithm was evaluated by sensitivity and precision. The detected and missed component were denoted as true positive (TP) and false negative (FN). The sensitivity and precision of the method was therefore calculated as follows:
sensitivity= TP
TP+FN (13)
Figure 6Abnormal heart sound signal with S3 and S4 labeled.
Table 2 Number of cycles where S3 and S4 are recognized, missed or false recognized
Patient ID S3 S4 Total Cycles recognized missed False recognized missed false
139 5 0 0 5
202 2 1 0 3
405 6 0 1 6
485 6 0 0 6
498 5 1 0 6
516 5 2 1 7
830 5 0 0 5
907 5 0 2 5
1169 7 0 0 7
1204 6 0 2 6
189 4 2 0 5 1 0 6
56 7 0 1 7
precision= TP
TP+FP. (14)
The sensitivity of the detection method was 90.4% and 94.5% for S3 and S4, and the precision of S3 and S4 were 90.4% and 85.5%, respectively.
4. Discussion
The aim of this research was to automatically recognize S3 and S4 in an abnormal heart sound. This method further extracted information such as the maximal instanta-neous frequency and amplitude from a time-frequency spectrum of Hilbert-Huang transform. The signals were adaptively decomposed and transformed. The extraction could provide information of a heart sound signal by retaining only the main frequency component. Then the cluster analysis compared the signal in the same record. Using the proposed method, the sensitivity for S3 and S4 were 90.4% and 94.5%, and the pre-cision were 90.4% and 85.5%, respectively. The sensitivity of S4 detection was better than S3. With the adaptive method based on time-frequency analysis, the algorithm eliminated the influence of noise and body movement. The effect of great variance of S3 and S4 could also be eliminated. Automated recognition of S3 and S4 within the same method would therefore be feasible.
However, the existence of extra sounds during diastolic period, such as diastolic murmur or noise produced by the electronic stethoscope, would still contribute to mis-judgments. Since the method includes the whole period of diastole, the interference of these extra sounds could not be eliminated. Nevertheless, using the whole period of diastole is essential since the occurring time of S3 and S4 is different from patient to patient. The interference of noise could be minimized by the proposed relative cluster-ing analysis method when the noise and murmur are no larger than S3 and S4.
The low amplitude sometimes makes S3 and S4 indistinguishable from background noise, which would be one of the limitations of using them as diagnostic parameters. This characteristic increase the difficulties for clinicians to hear and judge the presence of S3 and S4, thus reduce the reliability of diagnosing by these two components. Some recent studies have also evaluated the relationship between the level of physician experience and accurate auscultation of heart sound [3]. These investigations mostly claimed that clearly heard S3 and S4 could be seen as markers with high specificity associated with left ventricular dysfunction and improve the detection rate for the patients who are nondiagnostic by standard ECG [1,2].
5. Conclusion
The proposed method based on Hilbert-Huang transform is adaptive for detecting low-amplitude and low-frequency S3 and S4, which are seen as the early symptoms of myocardial dysfunction. Further extraction of the instantaneous frequency was carried out by Hilbert-Huang transform. The extracted frequency-magnitude distributions was clustered and analyzed. Components of S3 and S4 in abnormal heart sound could therefore be recognized. Performance of the method was estimated using the CARD database. In comparison with previous detection methods, S3 and S4 could be detected simultaneously using the proposed method and the performance was quantitatively evaluated.
Acknowledgements
This work was supported by grant 100-2221-E-002-064- from the National Science Council, Taiwan.
Author details
1Institute of Biomedical Engineering, National Taiwan University, Taipei 10617, Taiwan.2Department of Electrical Engineering, National Taiwan University, Taipei 10617, Taiwan.
Authors’contributions
YL carried out the algorithm design, implementation, and wrote the paper; PY worked on the signal processing of heart sound segmentation; FSJ contributed to discussion and suggestions of the topic and manuscript writing. All authors read and approved the final manuscript.
Competing interests
The authors declare that they have no competing interests.
Received: 28 September 2011 Accepted: 14 February 2012 Published: 14 February 2012
References
1. Ishikawa M, Sakata K, Maki A, Mizuno H, Ishikawa K:Prognostic significance of a clearly audible fourth heart sound detected a month after an acute myocardial infarction.Am J Cardiol1997,80:619-621.
2. Lee E, Michaels AD, Selvester RH, Drew BJ:Frequency of diastolic third and fourth heart sounds with myocardial ischemia induced during percutaneous coronary intervention.J Electrocardiol2009,42:39-45.
3. Marcus G, Vessey J, Jordan MV, Huddleston M, McKeown B, Gerber IL, Foster E, Chatterjee K, McCulloch CE, Michaels AD:Relationship between accurate auscultation of a clinically useful third heart sound and level of experience.Arch Intern Med2006,166:617-622.
4. Roos M, Toggweiler S, Jamshidi P, Zuber M, Kobza R, Meier R, Erne P:Noninvasive detection of left ventricular systolic dysfunction by acoustic cardiography in cardiac failure patients.J Card Fail2008,14:310-319.
5. Shah PM, Gramiak R, Kramer DH, Yu PN:Determinants of atrial (S4) and ventricular (S3) gallop sounds in primary myocardial disease.N Engl J Med1968,278:753-758.
6. Thayer WS:Further observations on the third heart sound.Arch Intern Med1909,4:297-305.
7. Folland ED, Kriegel BJ, Henderson WG, Hammermeister KE, Sethi GK:Implications of 3rd Heart Sounds in Patients with Valvular Heart-Disease.New Engl J Med1992,327:458-462.
8. Michaels AD, Shah SJ, Nakamura K, Marcus GM, Gerber IL, McKeown BH, Jordan MV, Huddleston M, Foster E: Association of the fourth heart sound with increased left ventricular end-diastolic stiffness.Journal of Cardiac
Failure2008,14:431-436.
9. Harris IS, Lee E, Yeghiazarians Y, Drew BJ, Michaels AD:Phonocardiographic timing of third and fourth heart sounds during acute myocardial infarction.J Electrocardiol2006,39:305-309.
10. Kumar D, Carvalho P, Antunes M, Henriques J, Sa e Melo A, Schmidt R, Habetha J:Third Heart Sound Detection Using Wavelet Transform-Simplicity Filter.Engineering in Medicine and Biology Society, 2007 EMBS 2007 29th Annual
International Conference of the IEEE; 22-26 Aug. 20072007, 1277-1281.
11. InBraunwald’s heart disease: a textbook of cardiovascular medicine.Edited by: Braunwald E, Zipes DP, Libby P.
Philadelphia: Saunders/Elsevier; 2008:.
12. Erne P:Beyond auscultation - acoustic cardiography in the diagnosis and assessment of cardiac disease.Swiss Med Wkly2008,138:439-452.
13. Chen D, Durand LG, Guo Z, Lee HC:Time-frequency analysis of the first heart sound. Part 2: An appropriate time-frequency representation technique.Med Biol Eng Comput1997,35:311-317.
14. Debbal S, Bereksi-Reguig F:Analysis of the second heart sound using continuous wavelet transform.J Med Eng
Technol2004,28:151-156.
15. Khadra L, Matalgah M, Elasir B, Mawagdeh S:The Wavelet Transform and Its Applications to Phonocardiogram Signal Analysis.Med Inform1991,16:271-277.
16. Debbal SM, Bereksi-Reguig F:Time-frequency analysis of the first and the second heartbeat sounds.Appl Math
Comput2007,184:1041-1052.
18. Zhao Z, Zhao Z, Chen Y:Time-frequency analysis of heart sound based on HHT [Hilbert-Huang transform].
International Conference on Communications, Circuits and Systems; 27-30 May 20052005, 929.
19. Ari S, Saha G:Classification of heart sounds using empirical mode decomposition based features.International
Journal of Medical Engineering and Informatics2008,1:91-108.
20. InHilbert-Huang transform and its applications.Edited by: Huang NE, Shen SS. London: World Scientific; 1999:.
21. Groch MW, Domnanovich JR, Erwin WD:A New Heart-Sounds Gating Device for Medical Imaging.IEEE T Bio-Med Eng 1992,39:307-310.
22. Liang H, Lukkarinen S, Hartimo I:Heart sound segmentation algorithm based on heart sound envelogram.
Computers in Cardiology 1997; 7-10 Sep 19971997, 105-108.
23. Reed TR, Reed NE, Fritzson P:Heart sound analysis for symptom detection and computer-aided diagnosis.Simul
Model Pract Th2004,12:129-146.
24. Jiang Z, Choi S:Comparison of envelope extraction algorithms for cardiac sound signal segmentation.Expert Syst Appl2008,34:1056-1069.
25. Vepa J, Tolay P, Jain A:Segmentation of heart sounds using simplicity features and timing information.IEEE
International Conference on Acoustics, Speech and Signal Processing; March 31 2008-April 4 20082008, 469-472.
26. Tuchinda C, Thompson WR:Cardiac auscultatory recording database: Delivering heart sounds through the Internet.
J Am Med Inform Assn2001, 716-720.
27. Davie AP, Francis CM, Caruana L, Sutherland GR, McMurray JJV:Assessing diagnosis in heart failure: Which features are any use?Qjm-Mon J Assoc Phys1997,90:335-339.
28. Lok CE, Morgan CD, Ranganathan N:The accuracy and interobserver agreement in detecting the‘gallop sounds’by cardiac auscultation.Chest1998,114:1283-1288.
doi:10.1186/1475-925X-11-8
Cite this article as:Tsenget al.:Detection of the third and fourth heart sounds using Hilbert-Huang transform.
BioMedical Engineering OnLine201211:8.
Submit your next manuscript to BioMed Central and take full advantage of:
• Convenient online submission
• Thorough peer review
• No space constraints or color figure charges
• Immediate publication on acceptance
• Inclusion in PubMed, CAS, Scopus and Google Scholar
• Research which is freely available for redistribution