M E T H O D O L O G Y
Open Access
Peak event analysis: a novel empirical method for
the evaluation of elevated particulate events
Aaron Orkin
1*, Pamela Leece
1, Thomas Piggott
2, Paul Burt
3and Ray Copes
4Abstract
Background:We report on a novel approach to the analysis of suspended particulate data in a rural setting in southern Ontario. Analyses of suspended particulate matter and associated air quality standards have conventionally focussed on 24-hour mean levels of total suspended particulates (TSP) and particulate matter <10 microns, <2.5 microns and <1 micron in diameter (PM10, PM2.5, PM1, respectively). Less emphasis has been placed on brief peaks in suspended particulate levels, which may pose a substantial nuisance, irritant, or health hazard. These events may also represent a common cause of public complaint and concern regarding air quality.
Methods:Measurements of TSP, PM10, PM2.5, and PM1levels were taken using an automated device following local complaints of dusty conditions in rural south-central Ontario, Canada. The data consisted of 126,051 by-minute TSP,
PM10, PM2.5, and PM1measurements between May and August 2012. Two analyses were performed and compared.
First, conventional descriptive statistics were computed by month for TSP, PM10, PM2.5, and PM1, including mean values and percentiles (70th, 90th, and 95th). Second, a novel graphical analysis method, using density curves and line plots, was conducted to examine peak events occurring at or above the 99th percentile of per-minute TSP readings. We refer to this method as“peak event analysis”. Findings of the novel method were compared with findings from the conventional approach.
Results:Conventional analyses revealed that mean levels of all categories of suspended particulates and suspended particulate diameter ratios conformed to existing air quality standards. Our novel methodology revealed extreme outlier events above the 99th percentile of readings, with peak PM10and TSP levels over 20 and 100 times higher than the respective mean values. Peak event analysis revealed and described rare and extreme peak dust events that would not have been detected using conventional descriptive statistics.
Conclusions:Peak event analysis underscored extreme particulate events that may contribute to local complaints regarding intermittently dusty conditions. These outlier events may not appear through conventional analytical approaches. In comparison with conventional descriptive approaches, peak event analysis provided a more analytical and data-driven means to identify suspended particulate events with meaningful and perceptible effects on local resi-dents.
Keywords:Air quality, Suspended particulate matter, Public health, Environmental health, Peak event analysis, Dust
* Correspondence:[email protected] 1
Dalla Lana School of Public Health, University of Toronto, 155 College Street, Toronto, ON M5S 3 M2, Canada
Full list of author information is available at the end of the article
Background
Elevated suspended air particulate levels are associated with increased cardiovascular and respiratory mortality [1]. These associations have been widely recognized in settings where populations experience ongoing exposure to suspended particulates arising from human activities and combustion [1]. More recently, elevated mortality has been associated with naturally-occurring suspended particulates and relatively brief exposures, such as Sa-haran dust blown to the Iberian Peninsula [2]. In occu-pational settings, brief and even singular exposures to high levels of irritant dust, vapour, fume or smoke has, in patients with no prior history of respiratory disease, been described as the causative agent in reactive airways dysfunction syndrome and irritant-induced asthma, result-ing in symptoms of airway inflammation and bronchial re-activity without a latency period [3,4].
Canadian air quality standards have conventionally fo-cussed on mean suspended particulate values measured over multiple years. The Canadian Ambient Air Quality Objective is 120 μg/m3, measured as a 3-year mean of 24-hour mean total suspended particulate (TSP) levels. Even subtle changes in a 3-year mean TSP value will likely have meaningful aggregate health effects, but are unlikely to result in immediately perceptible changes to residents or complaints regarding air quality [5].
In contrast, relatively brief peak events in suspended particulate matter may be readily perceptible or repre-sent a nuisance and cause for complaint for people res-iding in a given area, and may result in discomfort and mucous membrane and airway irritation. Canadian stan-dards identify 1-hour mean limits for sulphur dioxide, ozone, nitrogen dioxide, and hydrogen sulphide, but do not place limits on relatively brief peak allowances for PM2.5 or PM10 by defining limits at the 98th percentile
or through 24-hour and annual means [6]. Air quality standards in other jurisdictions do identify peak limits. United States standards, for example, indicate that 24-hour PM10 readings are not to exceed 150 μg/m3
more than once per year over 3 years [7]. However, in-frequent peak events lasting only a few hours may not be identifiable through the analysis of 24-hour means.
This paper concerns the analysis of air quality data collected in a rural Ontario community, following local complaints concerning episodic dusty conditions to de-termine if the available data confirmed the occurrence of episodic peaks in particulate levels. A 31 August 2012 public statement from the County Health Unit identi-fied the dust source as a tailings pile from an upwind nepheline syenite mine [8]. We describe a novel ap-proach to suspended particulate data analysis, designed to identify and explore peak dust events irrespective of whether those events produce deviations from regula-tory air quality standards.
Methods
Suspended particulate data
In response to local complaints of dusty conditions, from 24 May 2012 to 2 October 2012, the Ontario Ministry of the Environment conducted automated sus-pended particulate and basic meteorological measure-ments at the test site, located 2.5 km and 5.5 km from two nepheline syenite mine processing locations. The survey design was to verify the complaints and try to determine the source. A real-time aerosol particulate analyzer, (Grimm Technologies Inc., Germany, Model 107) was used for this survey. Instrument intake con-sisted of a stainless steel PM10head and inlet located
ap-proximately 6 feet off the ground. The instrument had been calibrated before then after the survey. The survey instruments produced minute readings of particulate matter less than 10 microns, 2.5 microns and 1 micron in diameters (PM10, PM2.5, and PM1 respectively) and
computed readings of total suspended particulates (TSP), as well as humidity, barometric pressure, wind speed and wind direction.
The data set included 10 548 observations for May 2012, 26 705 for June 2012, 13 771 observations for July 2012, 29 595 observations for August 2012, 43 187 ob-servations for September 2012 and 2245 obob-servations for October 2012. Differences in the number of observa-tions per month were due to variaobserva-tions in the amount of time when the monitoring equipment was deployed, and due to events such as power outages at the testing site.
Analyses performed
We analysed these data from a public health perspective in order to determine if local air quality complaints could be traced to elevated particulate levels. Our lysis was conducted using two approaches. The first ana-lysis followed conventional approaches drawn from Brook and colleagues’ large-scale study of Canadian at-mospheric particulate matter [9]. For each of TSP, PM10,
PM2.5, and PM1, the data were described by month
ac-cording to the mean, maximum and minimum values, the standard deviation, and the 10th, 50th, 70th, 90th and 95th percentiles percentile readings for each sus-pended particulate measurement. These values were then compared with Canadian standards, assuming, ac-cording to the Central Limit Theorem, that the mean of the minute values would approximate the mean of 24-hour values. These results were also compared with combined summary statistics from 14 urban Canadian sites as reported by Brook and colleagues.
changes and sources of environmental particulates, these brief peak events may have minimal effect on calculated monthly means. Peak event analysis consisted of three analyses of particulate measurements above the 99th percentile. First, the presence of peak readings was con-firmed by plotting smoothed density curves of the top 1% of values for each of TSP, PM10, PM2.5, and PM1.
Second, summary quantile statistics were computed for each of TSP, PM10, PM2.5, and PM1 values by month:
99th percentile, and each permillile (‰ile) between 990 and 999. These permilliles permit assessment of peaks. Third, line graphs of per-minute TSP and PM10 values
were generated for each month, to provide a visual ana-lysis of peak events.
Our analysis was not designed to associate elevated particulate events with a given source. Analysis of me-teorological data was not performed.
All statistical computations and visualizations were generated using the R Statistical Package v.2.15.1 and Microsoft Excel 2010.
Results
Conventional analysis
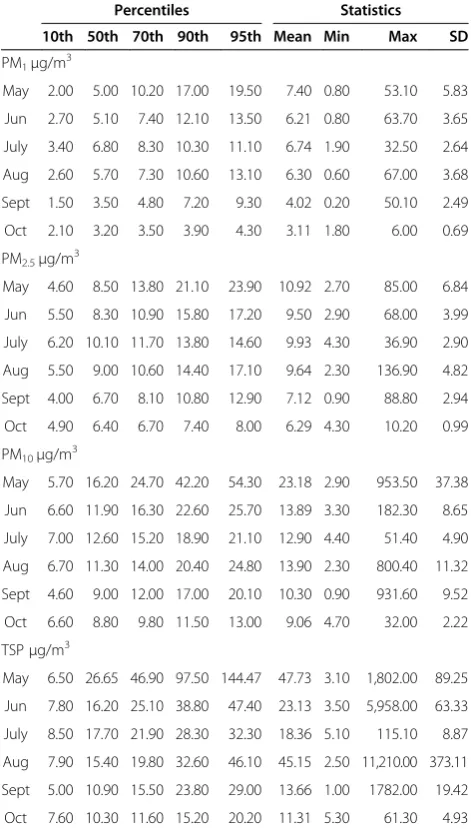
Table 1 provides a summary of descriptive statistics aris-ing from the first conventional analysis. Median statistics show minimal variability by month. Median by-minute TSP ranges from 10.30μg/m3in October to 26.65μg/m3 in May. Assessment of TSP values at the 95th percent-ile shows more variation, ranging from 20.20 μg/m3 in October to 144.47 μg/m3 in May. Similarly, PM10
values show minimal variability at the median (median of 8.80μg/m3in October to 16.20μg/m3in May, 95th per-centile values of 13.00μg/m3 in October to 54.30μg/m3 in May). PM2.5 values show less variability at the median
and 95th percentile (medians of 6.40μg/m3in October to 10.10μg/m3in July, 95th percentile values of 8.00μg/m3 in October to 23.90 μg/m3 in May). PM1 values show
still less variability at the median and 95th percentile (medians of 3.20μg/m3in October to 6.8μg/m3in July, 95th percentile values of 4.30 μg/m3 in October to 19.50μg/m3in May).
Overall, using the 10th, 50th, 70th, 90th and 95th per-centiles for analysis, May appears to be by far the dusti-est month, while readings in October show substantially less suspended particulate. Variation in the months of June to September appears to be less substantial.
These statistics provide some suggestion of extreme peak levels, especially in PM10 and TSP values. The
maximum value for TSP in August is 11,210.00 μg/m3, with a standard deviation more than fourfold higher than any other month. In May, maximum PM10 levels
are 953.50 μg/m3 with a standard deviation more than threefold greater than other months. This conventional analysis does not provide further insights or description
of these peak events, though it suggests data heavily skewed toward the lower end of a wide distribution.
Peak event analysis
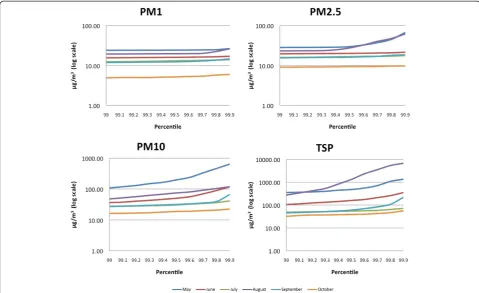
Figure 1 provides by-month curves of TSP, PM10, PM2.5,
and PM1 readings at and above the 99th percentile of
readings (or the 990th to 999th permillile of readings). Note that the y-axis is displayed on a logarithmic scale. These graphs portray trends in rare peak measurements in suspended particulate levels. Between the 990th and 999th permillile, substantial variability is observed that cannot be captured even by analysing the 95th or 99th percentile of readings. This provides evidence of
Table 1 Conventional by-minutes summary statistics PM1, PM2.5, PM10 and TSP, May-October 2012
Percentiles Statistics 10th 50th 70th 90th 95th Mean Min Max SD
PM1μg/m 3
May 2.00 5.00 10.20 17.00 19.50 7.40 0.80 53.10 5.83
Jun 2.70 5.10 7.40 12.10 13.50 6.21 0.80 63.70 3.65
July 3.40 6.80 8.30 10.30 11.10 6.74 1.90 32.50 2.64
Aug 2.60 5.70 7.30 10.60 13.10 6.30 0.60 67.00 3.68
Sept 1.50 3.50 4.80 7.20 9.30 4.02 0.20 50.10 2.49
Oct 2.10 3.20 3.50 3.90 4.30 3.11 1.80 6.00 0.69
PM2.5μg/m 3
May 4.60 8.50 13.80 21.10 23.90 10.92 2.70 85.00 6.84
Jun 5.50 8.30 10.90 15.80 17.20 9.50 2.90 68.00 3.99
July 6.20 10.10 11.70 13.80 14.60 9.93 4.30 36.90 2.90
Aug 5.50 9.00 10.60 14.40 17.10 9.64 2.30 136.90 4.82
Sept 4.00 6.70 8.10 10.80 12.90 7.12 0.90 88.80 2.94
Oct 4.90 6.40 6.70 7.40 8.00 6.29 4.30 10.20 0.99
PM10μg/m 3
May 5.70 16.20 24.70 42.20 54.30 23.18 2.90 953.50 37.38
Jun 6.60 11.90 16.30 22.60 25.70 13.89 3.30 182.30 8.65
July 7.00 12.60 15.20 18.90 21.10 12.90 4.40 51.40 4.90
Aug 6.70 11.30 14.00 20.40 24.80 13.90 2.30 800.40 11.32
Sept 4.60 9.00 12.00 17.00 20.10 10.30 0.90 931.60 9.52
Oct 6.60 8.80 9.80 11.50 13.00 9.06 4.70 32.00 2.22
TSPμg/m3
May 6.50 26.65 46.90 97.50 144.47 47.73 3.10 1,802.00 89.25
Jun 7.80 16.20 25.10 38.80 47.40 23.13 3.50 5,958.00 63.33
July 8.50 17.70 21.90 28.30 32.30 18.36 5.10 115.10 8.87
Aug 7.90 15.40 19.80 32.60 46.10 45.15 2.50 11,210.00 373.11
Sept 5.00 10.90 15.50 23.80 29.00 13.66 1.00 1782.00 19.42
Oct 7.60 10.30 11.60 15.20 20.20 11.31 5.30 61.30 4.93
substantial, but brief, peaks in the observed levels of sus-pended particulates, especially TSP and PM10.
These effects are particularly pronounced in May and August. In May, where the 99th percentile corre-sponds with 105 observations, peak levels of TSP oc-curring at the 999th permillile are more than 3.8 times higher than those levels observed at the 990th permil-lile, while peak levels of PM10 at the 999th permillile
are 6.0 times higher than those levels observed at the 990th permillile. In August, where the 99th percentile corresponds with 295 observations, peak levels of TSP occurring at the 999th permillile are more than 24.9 times higher than those levels observed at the 990th permil-lile, while peak levels of PM10 at the 999th permillile
are more than 2.5 times higher than those levels ob-served at the 990th permillile. In both May and August, peak events in PM2.5are also observed above the 994th
permilile. None of these effects are seen through the conventional analysis. In comparison with May and August, there is less evidence of extreme variation in the top percentile of the suspended particulate data in June, July, September and October. Given that the 90th and 95th percentile values were also not elevated in comparison with mean and median values in these months, there were therefore fewer brief peak events in June, July, September and October.
Figure 2 provides exemplars of the line graphs gen-erated to further explore the peak events observed in May and August. In May, peak events in TSP are ac-companied closely by elevations in PM10. In August,
however, some substantial elevations in TSP that con-tribute to the highest percent of readings are not accompanied by proportionate PM10 elevations (for
ex-ample, the TSP spike on 8 August 2012 and on the first half of 15 August 2012).
Discussion
These two analyses reveal different features in the same data set and provide an opportunity to compare the in-formation derived from conventional evaluations of sus-pended particulate with the information arising from our novel peak event analysis.
Our initial approach to suspended particulate data analysis, identified here as the conventional approach, succeeded in providing adequate information to confirm that the air quality at the test site likely conforms with Canadian air quality standards. (The data could not con-firm this conclusively because a 3-year mean of 24-hour values cannot be computed.) Furthermore, our conven-tional approach permits comparison to other dominant literature in this field. Brook and colleagues' study of suspended particulates in 14 urban Canadian centres
provides an appropriate national comparator. In their study, mean TSP and PM10 values were 46.0 and 24.0,
respectively. In the same study, TSP and PM10 values at
the 95th percentile were found to be 123.0 and 58.0, respectively. In all months at the test site, mean monthly values for TSP, PM10 and PM2.5 were below mean
24-hour values reported by Brook and colleagues. Table 2 lists these comparators.
However, our conventional analysis also reveals the limitations of this approach. Local concerns regarding air quality in the community– and indeed the impetus for initiating air quality monitoring at this site – per-tained to peak events, not changes in baseline suspended particulate levels. Immediate community concerns re-lated to eye irritation, nose and upper airway irritation, and difficulty breathing [5], not long-term impacts on cardiorespiratory health. Peak suspended particulate events may not have any identifiable effect on mean an-nual suspended particulate measurements or result in a departure from standards based on 3-year means. Our
peak event analysis centered on a statistical interrogation of suspended particulate readings at or above the 99th percentile of readings. Above the 99th percentile there is evidence that substantial TSP peaks occurred with par-ticular severity in May and August. With the exception of August, all months after May showed substantially fewer peak episodes. In some cases, and with per-minute data like that used in this study, peak episodes may be observed as readings above the 995th permillile, and may not affect that 90th, 95th or 99th percentile values.
Some of the very high TSP levels observed in this study may be due the measurement instrument errors. Particles above 10 microns can interact with the instru-ment’s laser and sensor to over-report TSP concentra-tions under certain condiconcentra-tions. This effect is most likely to occur under high relative humidity conditions be-cause the instrument has a limited capacity to dry the incoming air stream [10]. Under long periods of high humidity conditions this capacity can be exceeded. High humidity conditions can cause unusual TSP read-ings under certain conditions. Even the highest TSP measurements reported fall within the instrument’s measurement range.
The Ontario occupational exposure limit for the res-pirable fraction of nepheline syenite—the primary min-ing product at the upwind site and primary contributor to the particulate measurements herein—is 10 mg/m3, or 10,000 μg/m3 [11]. American occupational permis-sible exposure limits are half this figure (5 mg/m3) [12]. This exposure limit is intended for an occupational set-ting, and not a general outdoor setting. Brief episodes of
Table 2 Summary 24-hour statistics from 14 urban sites, adapted from Brook et al., 1997 [9]
Percentiles Statistics 10th 50th 70th 90th 95th Mean Max SD
TSP 22.0 46.0 62.0 98.0 123.0 55.2 572.0 37.8
PM10 11.3 24.0 32.0 47.4 58.0 27.6 175.0 16.3
PM2.5 5.0 11.0 16.0 26.1 32.2 13.9 89.0 9.5
TSP: Total Suspended Particulates, PM: particulate matter, SD: Standard Deviation.
TSP readings well above 1000μg/m3will likely pose a sub-stantial and perceptible nuisance and may have aggregate health effects. Whether mean 24-hour TSP, PM10or PM2.5
readings are below existing standards is not relevant to this finding. Conventional analyses of suspended particu-late data may not attend to peak events.
Conclusions
This analysis shows minimal variation in mean TSP, PM10, PM2.5 and PM1levels between May and October
2012. Throughout this period, mean TSP readings matched closely with Canadian air quality standards. However, these standards do not attend to measure-ments of extreme peaks in dust levels or their potential health effects. Such peaks are observed in the data pro-vided, particularly in August and May 2012. Identifying these peak events require a different approach to sus-pended particulate data analysis. The method presented here identifies peak events occurring at or above the 99th percentile of by-minute suspended particulate data. This approach provides a data-driven way to identify and explore peak events without relying on the use of an arbitrary cut-point for peaks. Peak event analysis may complement conventional approaches to suspended par-ticulate analysis, and may provide opportunities to iden-tify airborne hazards to human health that would escape more conventional analyses.
Abbreviations
TSP:Total suspended particulates; PM10: PM2.5, PM1, Particulate matter less than 10, 2.5 and 1 microns in diameter, Respectively.
Competing interests
The authors declare that they have no competing interests.
Authors’contributions
AO conceived of and designed and carried out the statistical analysis for the study and drafted the manuscript. PL participated in the design of the study and helped to draft the manuscript. TP contributed to preparation of the data graphical representation and helped to draft the manuscript. PB contributed to air quality data collection and technical interpretation of the air quality instrument’s measurements. RC participated in the study design and helped to draft the manuscript. All authors read and approved the final manuscript.
Acknowledgements
The authors wish to thank Dr. Rosana Pellizzari and the Peterborough City-County Health Unit for involving us in the analysis of this data, as well as Michael Ladouceur at the Ontario Ministry of the Environment for the data collection. We thank Dr. Mustafa Hirji and Dr. Kevin Thorpe for their assistance with statistical coding questions, and the whole Environmental Health Team at Public Health Ontario for their helpful feedback and review.
Author details 1
Dalla Lana School of Public Health, University of Toronto, 155 College Street, Toronto, ON M5S 3 M2, Canada.2Michael G. DeGroote School of Medicine, McMaster University, Hamilton, Canada.3Ministry of the Environment, Kingston, Canada.4Public Health Ontario, Environmental Health, Toronto, Canada.
Received: 20 March 2013 Accepted: 28 October 2013 Published: 1 November 2013
References
1. Committee on the Medical Effects of Air Pollutants (Chair: JG Ayres): Long-term exposure to air pollution: Effect on mortality.London; 2009. 2. Jimenez E, Linares C, Martinez D, Diaz J:Role of Saharan dust in the
relationship between particulate matter and short-term daily mortality among the elderly in Madrid (Spain).Sci Total Env2010,408:5729–5736. 3. Brooks SM, Weiss MA, Bernstein IL:Reactive airways dysfunction
syndrome.Chest1985,88:376–384.
4. Labrecque M:Irritant-induced asthma.Curr Opin Allergy Clin Immunol2012, 12:140–144.
5. Canadian Counsel of Ministers of the Environment:Canada-Wide Standards for Particulate Matter (PM) and Ozone.2000. http://www.ccme.ca/assets/pdf/ pmozone_standard_e.pdf.
6. Environment Canada:National Ambient Air Quality Objectives.2010. http://www. hc-sc.gc.ca/ewh-semt/pubs/air/naaqo-onqaa/index-eng.php.
7. International Air Quality Advisory Board:Progress Report 25 for the International Joint Commission (Chapter 5).2000. http://www.ijc.org/php/ publications/html/progress25/chap5.html.
8. Pellizzari R:Message from the Medical Officer of Health Peterborough County-City Health Unit Friday, August 31, 2012.2012.
9. Brook JF, Dann TF, Burnett RT:The relationship Among TSP, PM10, PM2.5, and Inorganic Constituents of Atmospheric Particulate Matter at Multiple Canadian Locations.J Air Waste Manage Assoc1997,47:2–19.
10. United States Environmental Protection Agency Clean Air Scientific Advisory Committee Ambient Air Monitoring and Methods Subcommittee:Review of the White Paper on Particulate Matter (PM) Light Extinction Measurements. 2010. http://yosemite.epa.gov/sab/sabproduct.nsf/92C9F5AA09A76 A93852577150004A782/$File/EPA-CASAC-10-010-unsigned.pdf.
11. Ontario Ministry of Labour:Occupational Exposure Limits for Ontario Workplaces. 2013. http://www.labour.gov.on.ca/english/hs/pubs/oel_table.php.
12. Centers for Disease Control National Institute for Occupational Health and Safety:Particulates Not Otherwise Specified.2012. http://www.cdc.gov/niosh/ npg/npgd0480.html.
doi:10.1186/1476-069X-12-92
Cite this article as:Orkinet al.:Peak event analysis: a novel empirical method for the evaluation of elevated particulate events.Environmental Health201312:92.
Submit your next manuscript to BioMed Central and take full advantage of:
• Convenient online submission
• Thorough peer review
• No space constraints or color figure charges
• Immediate publication on acceptance
• Inclusion in PubMed, CAS, Scopus and Google Scholar
• Research which is freely available for redistribution
![Table 2 Summary 24-hour statistics from 14 urban sites,adapted from Brook et al., 1997 [9]](https://thumb-us.123doks.com/thumbv2/123dok_us/9161687.1912542/5.595.58.538.89.317/table-summary-hour-statistics-urban-sites-adapted-brook.webp)
