ISSN: 1942-9703 / CC BY-NC-ND Abstract - Generally, an adults need to sleep for about 8 hours
every night to keep the body in a good condition. In addition to adequate sleep, good sleep quality is also an important factor to note. But when the sleep time and sleep quality was disrupted, of course many bad effects are lurking. The quality of one's sleep can be known by reading the bio potential signals in the brain commonly called electroencephalograph (EEG). To be able to detect this signal, an EEG sensor is required at some point around the head. The data of signal measurement by EEG sensor will be recorded and can be processed directly by computer, without having to go through the signal conditioning circuit first. This process is usually called the data acquisition process. In the first stage of digital processing on a computer, the signal will have pre-processing (cutting, filtering and segmentation). Then, the signal will be extracted by the method of Discrete Wavelet Transform and Fast Fourier Transform. The output of this system is the signal characteristics of the frequency and amplitude of the EEG signal of each sleep data segment. The amplitude results will be used as input in analyzing using the t test method paired samples. It is obtained that lavender aromatherapy with alpha and theta waves frequency of 0.023 and 0.021, respectively provide the smaller of significance level about 0,05.
Index Terms— DWT, EEG, FFT, Statistical Methods.
I. INTRODUCTION
LEEP is a basic human need characterized by minimal physical activity, decreased awareness, changes in physiological processes of the body and decreased response to external stimuli. Sleep has great benefits for the body. Benefits of sleep, among others, can restore balance and central nervous activity at normal levels. Sleep is also useful for protein synthesis that allows the process of improvement [1]. Broadly speaking sleep can be divided into two phases, the Rapid Eye Movement (REM) phase and the Nonrapid Eye Movement (NREM) phase. NREM is an early stage of light sleep that is marked by the movement of the eyeball stopped, body temperature decreased, heart rate slowed, as well as absolutely no muscle activity in some parts of the body, while REM is a phase marked by rapid eye movement, loss of muscle strength and apparent dreams [2].
Manuscript received June 9, 2018. This research was supported by the Technical Implementation Unit for Instrumentation Development, Indonesian Institute of Sciences and Faculty of Technology and Computer Science, Universitas Prima Indonesia.
Mardi Turnip, L. Wijaya, A. Dharma, L.A. Sarena are with Faculty of Technology and Computer Science, Universitas Prima Indonesia, Medan, Indonesia
Dwi Esti K. and Arjon Turnip is with Technical Implementation Unit for
Instrumentation Development Indonesian Institute of Sciences, Bandung, Indonesia (Email: [email protected])
Generally adults need time to sleep for 7-8 hours each day. If bedtime is not met well then it will have a bad impact on health and can affect the quality of sleep a person as well as the emergence of other sleep disorders. Pupil who experience sleep disorders, will cause the concentration to decrease, weakened endurance, trigger the attack of various dangerous diseases such as cancer, stroke, and narcolepsy. During sleep, a person rests some of his organs, one of which is the brain [3] where the human brain will keep working, especially when dreaming. The brain will work like it is doing activities during the day. From this fact, we are able to know the condition of the body and the quality of one's sleep through brain signals.
The brain signals commonly called electroencephalograph (EEG) have different frequencies according to the activity being performed, either during sleep or awake. This signal has low voltage amplitudes, thus at the microvolt order in the range of 100 μV-1 mV [4]. The human brain also produces five EEG signals, namely Gamma (30Hz - 50Hz), Beta (13Hz - 30Hz), Alpha (8Hz – 13Hz), Theta (4Hz – 8Hz) dan Delta (0,5Hz – 4Hz). These signals can be used to determine the effect of aromatic stimuli on sleep quality. In this experiment the analyzed EEG signals are Alpha, Theta, and Delta.
Various studies have been done proven that the quality of sleep can be increased with aromatic stimuli. Aromatherapy is the use of a variety of essential oils derived from plants in helping to treat various physical and emotional health problems. Each type of aromatherapy has different benefits to the body, one of which is to make the body relax and easy to fall asleep. Some commonly used juice in aromatherapy because of its versatile nature is lunghonclary, eucalyptus, geranium, lemon, petitgrain, rosemary, sandalwood, tea tree, Cananga odorata and lavender. Medical research reveals the fact that the smell inhaled has a significant impact on feelings. Smells directly affect the brain [1].
In previous studies lavender proved to help cure depression, anxiety, insomnia, and headaches while sandalwood is less able to help in improving sleep quality. So in this study selected two aromatherapy namely lavender and sandalwood in order to get a fairly significant comparison results. In the first stage of digital processing performed on the computer, the signal will experience pre-processing (cutting and filtering). Then, the signal will be extracted by the method of Discrete Wavelet Transform (DWT) and Fast Fourier Transform (FFT). The output obtained is frequency and the amplitude in the EEG signal of each sleep data segment and
Statistical Analysis of Sleep Quality from EEG
Signal with Aromatic Stimuli
M. Turnip, L. Wijaya, A. Dharma, L. Anita Sarena, Dwi Esti K., and A. Turnip
the output used for statistical analysis is only the amplitude value of the EEG signal.
II. PROCEDURE FOR PAPER SUBMISSION
Research methods include the process of giving aromatherapy stimulus to the subject, taking EEG signal data, data acquisition, pre-processing, feature extraction process and statistical analysis. The resulting output is the amplitude and maximum frequency of the subject EEG signal. Further process is the data of aromatherapy effect on subject sleep quality.
Figure 1. Block Diagram. A. Data Aquisition
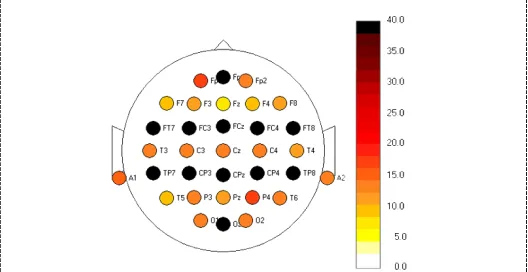
Data acquisition is a result of the measurement of electrical data from the measuring device, which then the data will be inserted into the computer for processing. The process of acquisition generally involves the process of taking signals and processing them for information. In the first stage of the subject undergo the process of preparation of experiments in the form of MITSAR EEG sensor installation on the head. After undergoing the preparation process, subjects are welcome to sleep in a place that has been prepared. Make sure the subject is ready and relax before the data is taken. Data collection begins since the patient closes his eyes to sleep with a span of 90 minutes (1 sleep cycle). Data retrieval in the form of brain signals recording during sleep with WinEEG application with 19 channel electrode used among them is Fp1, Fp2, F7, F3, F2, F4, F8, T3, C3, Cz, C4, T4, T5, P3, P2, P4, T6, O1, O2, A1 and A2. Figure 2 shows the EEG point pattern on the subject.
Figure 2. Pattern of Electrode Placement to Record EEG Signals. B. Signal Processing
The first stage of pre-processing is cutting 600,000 sampling points (20 minutes) for lavender and normal testing
while cutting 540000 sampling points (18 minutes) for sandalwood and normal testing. From one record that is cut into 3 parts of which is the first part, the middle, and the last part. Then the signal will go through the filtering process, the signal is filtered or cleaned from the noise that usually arises due to the interference of the power supply (50Hz) and other biopotential signals (artifacts) which are also caught by the frequency of the sensor. Bandpass filter is a circuit that passes the frequency at a certain area between the first cutoff frequency and the second cut-off frequency and dampens the frequency outside the area.In addition Bandpass filter is a circuit designed to pass the frequency within certain limits and reject other frequencies outside the desired frequency. And bandpass filter is a combination of highpass and lowpass filter. The bandpass filter will forward the signals with the frequency between (median frequency) and hold the frequency below and above the median [5-11]. In this experiment the brain signals will be filtered according to the respective frequencies of the brain wave that is alpha waves (wake) with a frequency of 8-13 Hz,theta wave (light sleep) with a frequency of 4 - 8 Hz and delta waves (deep sleep) with a frequency of 0.5 - 4 Hz.
Figure 3. Raw EEG Data With Lavender Stimulus.
Figure 4. EEG Signal With Lavender Stimulus After Filtering With Alpha Wave Frequency.
ISSN: 1942-9703 / CC BY-NC-ND extraction methods commonly used in signals. Wavelets have
the ability to analyze single and multidimensional signals, especially if the signal has different information at each time. Wavelet representation is multiscale of signal decomposition, which we can regard as a tree, where each level stores the projection of the signal into its base function into a certain resolution or in other words the wavelet converts the value into a series of specific coefficients. Representation of time frequency with wavelet is done by filtering the signal with a pair of filters that will cut the frequency domain to the middle. The wavelet function Ψ, can be represented as follows [12]:
𝝍𝝍𝒔𝒔,𝝉𝝉(𝒙𝒙) =√𝒔𝒔𝟏𝟏𝝍𝝍 �𝒕𝒕−𝝉𝝉𝒔𝒔 � (1)
Figure 5. EEG Signal With Lavender Stimulus After Filtering With Frequency Delta Waves.
Figure 6. EEG Signal With Lavender Stimulus After Filtering With Theta Wave Frequency.
Figure 7. EEG Signal With Aromatherapy Lavender Stimulus After Filtering With Alpha Wave Frequency And DWT Extraction.
Figure 8. EEG Signal With Aromatherapy Stimulus Lavender After Filtering With Delta Wavelength And DWT Extraction.
Figure 9. EEG Signal With Aromatherapy Stimulus Lavender After Filtering With Theta Wave Frequency And DWT Extraction.
Fourier Transform (FT) is a method for compression of signals and images described from signals defined from unlimited time intervals to alpha frequency components. FT is an advanced series of Fourier. Fast Fourier Transform is a faster and more efficient algorithm for calculating Discrete Fourier Transform (DFT). The FFT method can be done in time and frequency domain. Therefore the performance of FT is more to surpass WT performance capability of most signals, both stationary and non stationary [4]. The FFT method is used to plot the EEG signal in the frequency domain of the feature extraction process and recognize the recorded signal pattern. The purpose of character extraction is to know the information contained in the signal and to know the specific form of the signal coming from each individual.
C. Statistical Analysis
The quality of data used to determine the results or conclusions obtained. If the data is of good quality then the information to be obtained is also good and vice versa. Data quality is determined by its accuracy. Inaccurate data is indicated by the presence of outliers. This data must be removed so as not to damage the results. It also required the examination of data normality [13]. At this stage SPSS software is used for statistical analysis.
The Paired Sample T Test was performed on two paired sample, a paired sample is defined as a sample with the same subject but undergoing two different treatments or measurements [14]. Researchers using this test usually want to compare data before being treated (pretest) and after being treated (post test) basicaly the conclusion or hypothesis in the statistic is divided into two null hypothesis (Ho) and alternative hypothesis (Ha).Dalam SPSS uji paired sample t test will get the result output form Mean, standard deviation, standard error, degrees of freedom (df), t count and a significant 2 tailed score to be used for decision making or conclusion. Here is a basic decision-making: (i) Based on comparison t arithmetic with t table [14]: If the calculated statistics (t figures output)> statistics table (table t), then Ho is rejected but If the statistics count (t output) <statistics table (table t), then Ho accepted. (ii) Based on the probability value [14-17]: If the probability is> 0.05, then Ho is accepted and if the probability is <0.05, then Ho is rejected.
Based on the the parametric statistic test paired sample t test without stimulus with lavender aromatherapy stimulus and aromatherapy sandalwood where the number of subject (N) of 6 people and degrees of freedom (df) of 5 obtained the maximum mean of 0.27511 and the minimum mean of - 2.70266 as noted in the Table 6. For a maximum standard deviation value of 4.30191 listed in Table 6 and a minimum standard deviation of 0.00632 are listed in Table 1. The maximum mean standard error value of 1.75625 is listed in Table 6 and the minimum mean error standard of 0.00258 is listed in Table 1. From the results obtained can be seen that based on the value of Sig. (2-tailed) above obtained significant results on cutting the last part of the test section without stimulus with aromatherapy lavender with an alpha wave frequency of 0.023 as listed in Table 1 and theta waves of 0.021 as listed in Table 2, respectively of Sig value. (2-tailed) obtained is smaller than the level of significance used is (0.05). So based on the theory of statistical analysis, alternative hypothesis (Ha) accepted or the presence of lavender aromatherapy stimulus effect that is given to the quality of sleep subject. In the first part of the data cut, and the middle part of the other where the value of Sig. (2-tailed) obtained is greater than the level of significance used (0.05). So based on the theory of statistical analysis, zero hypothesis (Ho) accepted or no effect of lavender or sandalwood aromatherapy stimulus that is given to the quality of sleep subject.
III. RESULTS
The results of this experiment are statistical analysis. In statistical analysis, hypothesis that will be used there are 2 types of alternative hypothesis (Ha) and zero hypothesis (Ho) where Ha and Ho are concluded based on the experimental results performed. Ha concluded as there are significant results or the influence of aromatic giving of lavender or sandalwood given to the quality of sleep subject while Ho concluded as no significant results or influence of aromatic giving of lavender or sandalwood given to the quality of sleep subject. Results and analysis obtained in the form of mean value (Mean), standard deviation, standard error mean, t count, degrees freedom, and Sig. (2 tailed). Mean value is the average result of the total number of amplitude values inputted in SPSS.
Standard deviation is used to determine how the distribution of data in the sample, and how close the data points to the average sample value. The standard error can be defined as the standard deviation of the sample mean. In the statistical analysis t arithmetic used for decision-making basis compared with t statistics table, Sig (2-tailed) results are the most commonly used basis for decision-making based on probability values an alpha wave of 0.023 as shown in Table 1 and theta waves of 0.021 as listed in Table 2, each of the Sig values. (2-tailed) obtained is smaller than the level of significance used is (0.05). So based on the theory of statistical analysis, alternative hypothesis (Ha) accepted or the presence of lavender aromatherapy stimulus effect that is given to the quality of sleep subject. In the first part of the data cut, and the middle part of the other where the value of Sig. (2-tailed) obtained is greater than the level of significance used (0.05). So based on the theory of statistical analysis, zero hypothesis (Ho) accepted or no effect of lavender or sandalwood aromatherapy stimulus that is given to the quality of sleep subject.
TABLEI
DISTRIBUTION OF PAIRED SAMPLE TANALYSIS RESULTS TEST OF ALPHA WAVES WITHOUT STIMULUS AND WITH AROMATIC STIMULUS LAVENDER.
N Mean Std.
Deviation Std. Error Mean
t df Sig. (2 tailed) Normal_Alpha_Pertama
Lavender_Alpha_Pertama
6
-0,00850
0,02838 0,01159 -0,734
5 0,496
Normal_Alpha_Tengah Lavender_Alpha_Tengah
6 0,00054 0,01811 0,00739 0,073 5 0,945
Normal_Alpha_Akhir Lavender_Alpha_Akhir
6
-0,00839
0,00632 0,00258 -3,250
5 0,023
TABLEII
DISTRIBUTION OF PAIRED SAMPLE TANALYSIS RESULTS THETA TEST WITHOUT STIMULUS AND WITH AROMATIC STIMULUS LAVENDER.
N Mean Std.
Deviation Std. Error Mean
t df Sig. (2 tailed) Normal_Theta_Pertama
Lavender_Theta_Pertama
6
-0,374
1,54523 0,631 -0,593
5 0,579
Normal_ Theta_Tengah Lavender_ Theta _Tengah
6
-0,042
0,42607 0,174 -0,242
5 0,819
Normal_ Theta _Akhir Lavender_ Theta _Akhir
6
-0,290
0,21266 0,087 -3,338
ISSN: 1942-9703 / CC BY-NC-ND TABLEIII
DISTRIBUTION OF ANALYSIS RESULTS PAIRED SAMPLE TTEST WITHOUT STIMULUS DELTA WAVES AND WITH AROMATIC STIMULUS LAVENDER.
N Mean Std.
Deviation Std. Error Mean
t df Sig. (2 tailed) Normal_ Delta _Pertama
Lavender_Delta_Pertama
6
-0,40954
2,17955 0,88980 -0,460
5 0,665
Normal_ Delta _Tengah Lavender_ Delta
_Tengah
6 0,10004 2,76693 1,12960 0,089 5 0,933
Normal_ Delta _Akhir Lavender_ Delta _Akhir
6
-0,49084
1,76075 0,71882 -0,683
5 0,525
TABLEIV
DISTRIBUTION OF ANALYSIS RESULTS PAIRED SAMPLE TTEST ALPHA WAVES WITHOUT STIMULUS AND WITH AROMATIC STIMULUS SANDALWOOD.
N Mean Std. Deviation
Std. Error Mean
t df Sig. (2 tailed) Normal_Alpha_Pertama
Sandalwood_Alpha_Pertama 6
-0,02618
0,04028 0,01644 -1,592
5 0,172
Normal_Alpha_Tengah Sandalwood_Alpha_Tengah
6 -0,00828
0,03991 0,01629 -0,508
5 0,633
Normal_Alpha_Akhir Sandalwood_Alpha_Akhir
6 -0,00407
0,01125 0,00459 0,886 5 0,416
TABLEV
DISTRIBUTION OF PAIRED SAMPLE TANALYSIS RESULTS THETA TEST WITHOUT STIMULUS AND WITH AROMATIC STIMULUS SANDALWOOD.
N Mean Std. Deviation
Std. Error Mean
t df Sig. (2 tailed) Normal_Theta_Pertama
Sandalwood_Theta_Pertama 6
-0,90768
1,26031 0,51452 -1,764
5 0,138
Normal_ Theta_Tengah Sandalwood_ Theta
_Tengah
6 -0,40753
1,68519 0,68798 -0,592
5 0,579
Normal_ Theta _Akhir Sandalwood_ Theta _Akhir
6 0,10464 0,38658 0,15782 0,663 5 0,537
TABLEVI
DISTRIBUTION OF PAIRED SAMPLE TANALYSIS RESULTS OF DELTA WITHOUT STIMULUS DELTA TEST AND AROMATIC STIMULUS OF SANDALWOOD.
N Mean Std. Deviation
Std. Error Mean
t df Sig. (2 tailed) Normal_ Delta _Pertama
Sandalwood_Delta_Pertama 6
-2,70266
3,65219 1,49100 -1,183
5 0,130
Normal_ Delta _Tengah Sandalwood_ Delta
_Tengah
6 -0,62089
4,30191 1,75625 -0,354
5 0,738
Normal_ Delta _Akhir Sandalwood_ Delta _Akhir
6 0,27511 2,48178 1,01539 0,271 5 0,797
Based on the above table the parametric statistic test paired sample t test without stimulus with lavender aromatherapy stimulus and aromatherapy sandalwood where the number of subject (N) of 6 people and degrees of freedom (df) of 5 obtained the maximum mean of 0.27511 and the minimum mean of - 2.70266 as listed in Table 6. For the maximum deviation standard score of 4.30191 listed in Table 6 and minimum standard deviation of 0.00632 are listed in Table 1.
The maximum mean standard error value of 1.75625 is listed in Table 6 and standard minimum mean error of 0.00258 listed in Table 1. From the results obtained can be seen that based on the value of Sig. (2-tailed) above obtained significant results on cutting the last part of the test section without stimulus with aromatherapy lavender with an alpha wave
frequency of 0.023 as listed in Table 1 and theta waves of 0.021 as listed in Table 2, respectively of Sig value. (2-tailed) obtained is smaller than the level of significance used is (0,05). So based on the theory of statistical analysis, alternative hypothesis (Ha) accepted or the presence of lavender aromatherapy stimulus effect that is given to the quality of sleep subject. In the first part of the data cut, and the middle part of the other where the value of Sig. (2-tailed) obtained is greater than the level of significance used (0.05). So based on the theory of statistical analysis, nullnya hypothesis (Ho) accepted or no effect of lavender or sandalwood aromatherapy stimulus that is given to the quality of bed subject.
IV. CONCLUSION
Based on the results of statistical analysis conducted, the subject of experiments that sleep without aromatherapy and who were given lavender aromatherapy experienced light sleep while those given aromatherapy sandalwood less affect the quality of the subject's sleep so that the subject did not experience light sleep or sleep soundly. In this experiment lavender aromatherapy proved to be more effective in improving the quality of the subject's sleep than aromatherapy sandalwood.
ACKNOWLEDGMENT
This research was supported by Universitas Prima Indonesia, the thematic program through the Bandung Technical Management Unit for Instrumentation Development, Indonesian Institute of Science.
REFERENCES
[1] Kurnia, A. D., Wardhani, V. dan Rusca, K. T. 2009. Aromaterapi Bunga Lavender Memperbaiki Kualitas Tidur Pada Lansia. Jurnal Kedokteran
Brawijaya. XXV(2): 83-86.
[2] Kurniawan, R. 2013. REM Dan NREM.
http://rahmatkurniawan9415.blogspot.co.id/2013/04/rem-dan-nrem.html. Diakses tanggal 19 September 2017.
[3] Mahendra, Y. H., Tjandrasa, H. dan Fatichah, C. 2017. Klasifikasi Data EEG Untuk Mendeteksi Keadaan Tidur Dan Bangun Menggunakan Autoregressive Model dan Support Vector Machine. JUTI: Jurnal
Ilmiah Teknologi Informasi.15(1): 35-42.
[4] Azhari, A., Susanto, A. dan Soesanti, I. 2015. Studi Perbandingan: Cognitive Task Berdasarkan Hasil Ekstraksi Ciri Gelombang Otak. Seminar Nasional Teknologi Informasi Dan Multimedia. 6-8 Februari
2015, STMIK AMIKOM Yogyakarta. Hal. 7-12.
[5] Agung, S. 2014. Pengertian dan Kupas Tentang Band Pass Filter. http://setiaagungw.blogspot.co.id/2014/05/pengertian-dan-kupas-tentang-band-pass.html. Diakses tanggal 21 September 2017.
[6] Turnip, A,. Kusumandari, DE,. Amri, MF,. Simbolon, AI,. Suhendra, MA,. Iskandar, I,. Wirakusumah, FF., 2017 Detection of Drug Effects on Brain Activity using EEG-P300 with Similar Stimuli IOP Conference Series: Materials Science and Engineering.
[7] Turnip, A., Hong, KS,. Jeong, MY., 2011 Real-time feature extraction of P300 component using adaptive nonlinear principal component analysis
BioMedical Engineering OnLine10(3).
[8] Turnip, A., Hong, KS., 2012 Classifying mental activities from EEG-P300 signals using adaptive neural network Int. J. Innov. Comp. Inf.
Control8(7).
[9] Turnip, A., Hutagalung, SS., Pardede, J., Soetraprawata, D., 2013 P300 detection using multilayer neural networks based adaptive feature extraction method. International Journal of Brain and Cognitive
[10] Turnip, A., Siahaan, M., 2014. Adaptive Principal Component Analysis based Recursive Least Squares for Artifact Removal of EEG Signals.
Advanced Science Letters20 (10-12) 2034-2037(4) .
[11] Turnip, A., Kusumandari, DE., 2014 Improvement of BCI performance through nonlinear independent component analisis extraction. Journal of
Computer9(3) 688-695.
[12] Naibaho, V. 2015. Klasifikasi Emosi Melalui Sinyal EEG Yang Dihasilkan Otak Dengan Menggunakan Discrete Wavelet Transform Dan Backpropagation Artificial Neural Network. E-Proceeding Of
Engineering. 2(1): 1535-1540.
[13] Arilaha, A. 2011. Metode Analisis Data Statistik. http://asril-arilaha.blogspot.co.id/2011/08/metode-analisis-data-statistik.html. Diakses tanggal 21 September 2017.
[14] Cheong, L. C., Sudirman, R. dan Hussin, S. S. 2015. Feature Extraction Of EEG Signal Using Wavelet Transform For Autism Classification.
ARPN Journal Of Engineering And Applied Sciences. 10(19):
8533-8540.
[15] Djamal, E. C. dan Tjokronegoro, H. A. 2005. Identifikasi dan Klasifikasi Sinyal EEG Terhadap Ransangan Suara Dengan Ekstraksi Wavelet dan Spektral Daya. ITB Journal Of Science.
[16] Kamarudin. 2014. Makalah Statistik Parametrik dan Non Parametrik.
http://societykamaru.blogspot.co.id/2014/01/makalah-statistik-parametrik-dan-non.html. Diakses tanggal 21 September 2017.
[17] Mareti, S. 2010. Pengaruh Aromaterapi Terhadap Penurunan Kejadian Insomnia Pada Usia Lanjut Di Dusun Kramen Kring VI Sido Agung Godean Sleman Yogyakarta. Skripsi. STIK AISYIYAH, Yogyakarta.
Mardi Turnip received S.Kom. degree in Informatics Engineering from the National Institute of Technology (ITENAS) Bandung, Indonesia, in 2010 and the M.Kom degree. in the Information System from STMIK LIKMI Bandung, Indonesia, in 2013. He worked at Universitas Prima Indonesia, Indonesia as a lecturer. The research area is information systems and artificial intelligence.