Paper received: 7.1.2008 Paper accepted: 15.5.2008
CAM Algorithm as Important Element by Achieving of Good
Machined Surface Quality
Janez Kopač* - Primož Kržič
University o f Ljubljana, Faculty o f Mechanical Engineering, Slovenia
The paper deals with test o f four different NCprograms created by 4 different CAM algorithms using identical settings. The subsequent experimental verification has resulted in a conclusion that arrangement o f the points on the tool path does have influence on the machining time and finish surface quality.
© 2008 Journal o f Mechanical Engineering. All rights reserved.
Keywords: CAM systems, toolpath optimization, NC programs, surface quality, machining time
0 INTRODUCTION
CNC toolpaths are based on NC programs which are created using CAM systems. These systems utilize different methods and mathematical algorithms for calculating or optimization of toolpaths, which can givevery different results with the same parameter settings [8] and [9], In our past work we have noticed that arrangement of the points along the toolpath can have a substantial influence on the machining time and finished surface of the part.
1 EXPERIMENT PREPARATION
With the presented experiment we wanted to prove that the toolpath point arrangement could influence on machining time and a quality of the finished surface. We tested four different toolpaths, which were calculated with four different CAM algorithms using same settings.
*Corr. Author’s Address: University of Ljubljana,
The geometry of the part was presented by a half-sphere with a diameter of a 24 mm. On a bottom it transforms to a 3 mm radius (Fig. 1). The stock was a cylinder with a 30 mm diameter. The stock material was AlMgSi0.5.
All the experiments were made on a Sodick MC430L milling machine (Fig. 2 and Table 1).
The test tool had the following features: - Tool manufacturer and type: OSGWXS-LN-EBD, - Tool type: ball mill,
- Tool Diameter: 2 mm, - Tool Radius: 1 mm.
The test toolpath had the following common parameters:
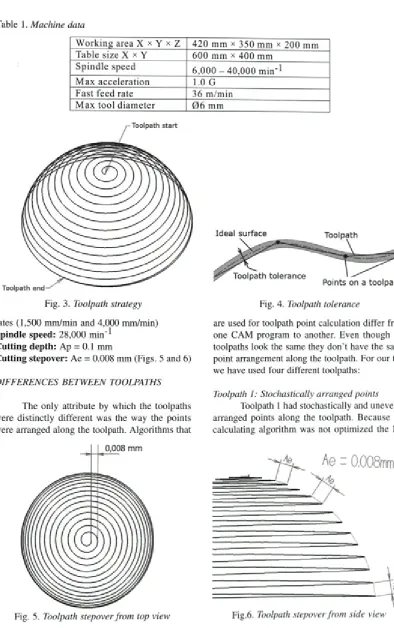
Toolpath strategy: all the tested toolpaths had identical programmed toolpath strategy - cutting the surface with the helical moves from top to bottom (Fig. 3).
Toolpath tolerance: 0.002 mm (Fig. 4)
Feed rate: we tested the toolpaths with two feed
Fig.2. Sodick MC430L milling machine
W orking area X x Y x Z 420 mm x 350 mm x 200 mm Table size X x Y 600 mm x 400 mm
S pindle speed 6,000 - 40,000 m in'*
M ax acceleration 1.0 G F ast feed rate 36 m /m in M ax tool diam eter 0 6 mm
Id e a l surface Tool path
Toolpath to leran ce
Points on a to o lp a th
Fig. 4. Toolpath tolerance
rates (1,500 mm/min and 4,000 mm/min)
Spindle speed: 28,000 min'*
Cutting depth: Ap = 0.1 mm
Cutting stepover: Ae = 0.008 mm (Figs. 5 and 6)
DIFFERENCES BETWEEN TOOLPATHS
The only attribute by which the toolpaths were distinctly different was the way the points were arranged along the toolpath. Algorithms that
Fig. 5. Toolpath stepover from top view
are used for toolpath point calculation differ from one CAM program to another. Even though the toolpaths look the same they don’t have the same point arrangement along the toolpath. For our test we have used four different toolpaths:
Toolpath 1: Stochastically arranged points
Toolpath 1 had stochastically and unevenly arranged points along the toolpath. Because the calculating algorithm was not optimized the NC
Fig. 7. NC program simulation o f toolpath 1
program consisted o f 10-times more points than any other tested toolpath (Fig. 7).
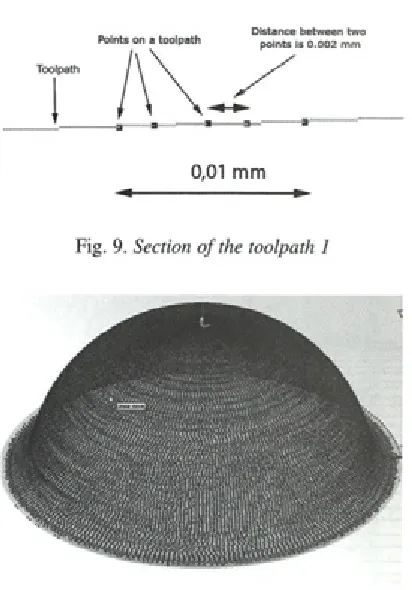
The toolpath section (Fig. 8) demonstrates that the distances between the adjacent toolpath points can vary between 0.002 mm and 0.05 mm.
F ig . 9 show s e n la rg e d se c tio n o f the toolpath. It can be noticed that there are 5 points on a section, which is only about 0.01 mm long.
0,01 m m
Fig. 9. Section o f the toolpath 1
Fig. 8. Section o f toolpath 1
Toolpath 2: Evenly arranged points that don’t show a pattern along Z-axis
This toolpath point’s arrangement displays no recognizable pattern along Z-axis (Fig. 10). The distances between the adjacent toolpath points are relatively constant and vary between 0.25 mm and 0.35 mm (Fig. 11). W hen comparing Figure 10 to Figure 7 it can be clearly noticeable that toolpath 1 has much higher density of points then the toolpath
2
.Toolpath 3: Evenly arranged points that show a distinct pattern along Z-axis
This toolpath consisted o f substantially smaller number o f points than toolpaths 2 and 4 (see Tables 3 ,4 and 5). In this was mainly the result o f the CAM algorithm leaving out the points on the lover portions of the test part where the toolpath radius is larger. Some sections of the toolpath had
Fig. 12. NC program simulation o f toolpath 3
sm aller distances betw een adjacent points than other sections (Fig. 13). The toolpath simulation is shown on Figure 12.
Toolpath 4: Evenly arranged points that show a distinct sun-ray pattern along Z-axis
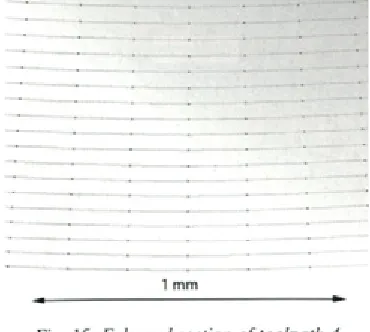
The points are evenly arranged along the toolpath and show a distinct sunray pattern along Z-axis (Figs. 14 and 15). This m eans that the distance between adjacent points on the toolpath is rising with the toolpath depth and radius of the surface.
3 TEST RESULTS
Each of the test parts has been machined with two programmed feed rates. Machining with the lower feed rate (f = 1500 mm/min) was used to produce finished surface, the higher feed rate was used to test m achining tim e reduction. A fter
Fig. 14. NC program simulation o f toolpath 4
1 mm
Fig. 13. Enlarged section o f toolpath 3
running the tests we photographed the test parts u nder the optical m icroscope w ith 30x magnification. Each part was also checked by naked eye and photographed with a digital compact camera.
Toolpath 1
The results of test are summarized in Table 2. The first column represents measured parameters and the second column shows the results. Toolpath 1 machining time at 1,500 mm/min was 10% longer than theoretical machining time. The most probable two reasons for such a delay are the facts that toolpath consists of 10 times more points than other toolpaths and that in some sections we can find up to 5 points in only 0.01 mm length of the toolpath. The machine cannot process so many points with the program m ed feed rate, w hich re su lts in lowering the average feed rate. When we increased the feed rate to 4000 mm/min, the machining time
1 mm
Theoretical toolpath time ( f = 1,500 mm/min) 571 s
Theoretical toolpath length 13,971 mm
Number o f points 433,884
Toolpath density (average number o f points on 1mm o f toolpath) 31 points/mm Measured toolpath time ( f = 1,500 mm/min) 625 s Measured toolpath time ( f = 4,000 mm/min) 590 s
M inimum feed rate ( f = 4,000 mm/min) 1,000 mm/min Actual calculated feed rate (f = 1,500 mm/min) 1,341 mm/min Actual calculated feed rate (f = 4,000 mm/min) 1,420 mm/min
decreased for only 6.5%. M inimum detected feed rate of 1000 mm/min at programmed 4000 mm/min shows that the toolpath had certain sections where the m achine m ovem ent speed had to be largely reduced.
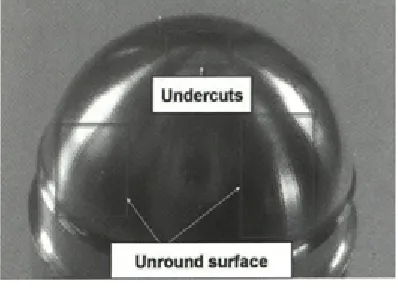
Figure 16 represents some issues regarding tool movement. In some sections o f the toolpath the feed rate decreased rapidly which resulted in tool vibration and subsequently in gouges in the surface. Large gouge about 1 mm long and 0.5 mm wide can be seen in the upper left com er of Figure 16. As we can see on Figure 17 the gouges can be seen with naked eye. In the real world such part would be treated as a waste.
The other issue concerns faceted surface on the lover section of the part. The surface texture can be seen in Figure 17.
Toolpath 2
The results of the test are represented in Table 3. Toolpath 2 had 10 times less toolpath points than toolpath 1 even though theoretical machining tim e and toolpath length was the same as with toolpath 1.
Fig. 16. Finished part after toolpath1 (enlarged 30-times)
Toolpath 2 machining time was 2.2% longer than theoretical. When we increased the feed rate to 4,000 mm/min, the machining time was shortened by 56%. Average feed rate at programmed 4,000 mm/min was 3,435 mm/min, which shows that the toolpath 2 is much more optimized for high feed rate than toolpath 1 (Table 3). Minimum detected feed rate of 2,500 mm/min at programmed 4,000 mm/min confirms that the toolpath did not have any sections where the machine movement speed had to be largely reduced.
The other reason o f round and sm ooth finished surface was the fact that individual cuts overlay previous cuts and the toolpath did not show a sunray pattern along Z-axis (Figs. 18 and 19). The finished surface was therefore automatically better.
Theoretical toolpath time (f = 1,500 mm/min) 571 s
Theoretical toolpath length 13,971 mm
Number o f points 47,634
Toolpath density (average number of points on 1mm o f toolpath) 3.4 points/mm Measured toolpath time (f = 1,500 mm/min) 559 s
Measured toolpath time (f = 4,000 mm/min) 244 s
Minimum feed rate (f = 4,000 mm/min) 2,500 mm/min
Actual calculated feed rate (f = 1,500 mm/min) 1,499 mm/min Actual calculated feed rate (f = 4,000 mm/min) 3,435 mm/min
Fig. 18. Part after toolpath 2 (enlarged 30-times)
Toolpath 3
The results of the test are represented in Table 4. Toolpath 3 had smaller density o f points then toolpath 2 but the actual average feed rate was lower than feed rate on toolpath 2. Toolpath 3 machining time was 5% longer than theoretical m achining tim e. C om pared to toolpath 2 this toolpath had certain areas where the points were more densely packed than others (Fig. 13). When we increased the feed rate to 4,000 mm/min the machining time shortened by 20%. This toolpath had smaller density of points (number of points on 1 mm of toolpath) compared to toolpath 2 but the time gain from increasing the feed rate was smaller.
Table 4. Toolpath 3 test results
Theoretical toolpath time (f = 1,500 mm/min) 393 s
Theoretical toolpath length 9,823 mm
Number o f points 27,243
Toolpath density (average number o f points on 1mm o f toolpath) 2.8 points/mm M easured toolpath time (f = 1,500 mm/min) 414s
M easured toolpath time (f = 4,000 mm/min) 330 s
Minimum feed rate (f = 4,000 mm/min) 1,000 mm/min
Actual calculated feed rate (f = 1,500 mm/min) 1,423 mm/min Actual calculated feed rate (f = 4,000 mm/min) 1,786 mm/min
Fig. 19. Finished part after toolpath2
This shows that the toolpath was not as much optimized for high feed rates as toolpath 2 (Table 4). Minimum detected feed rate of 1000 mm/min at programmed 4000 mm/min shows that the toolpath had certain sections where the machine movement speed had to be largely reduced.
Fig. 20. Part after toolpath 3 (enlarged 30-times)
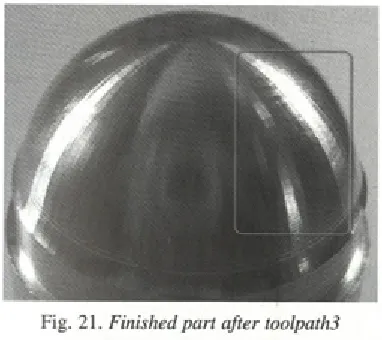
The facets are clearly seen even with naked eye (Fig. 21). In real world such part would most probably be considered as scrap part.
Toolpath 4
The results of the test are summarized in Table 5. Even though the toolpath density was higher than the toolpath density o f toolpaths 2 and 3 the m achining time was only 2% longer than theoretical machining time. W hen we increased the feed rate to 4,000 mm/min, the machining time was
Table 5. Toolpath 4 test results
Fig. 21. Finished part after toolpath3
decreased by 60%. Minimum detected feed rate of 2,000 m m /m in at program m ed 4,000 m m /m in confirms that the toolpath did not have any sections where the m achine m ovem ent speed had to be largely reduced.
The average recorded feed rate was 3,603 mm/min, which shows that the toolpath was well optimized for high feed rate cutting.
Figure 22 represent the finished surface photographed under the m icroscope w ith 30x magnification. They demonstrate that the surface
Theoretical toolpath time ( f = 1,500 mm/min) 623 s
Theoretical toolpath length 15,196 mm
Num ber o f points 74,040
Toolpath density (average number o f points on 1mm o f toolpath) 4.9 points/mm Measured toolpath time ( f = 1,500 mm/min) 636 s
M easured toolpath time (f = 4,000 mm/min) 253 s
M inimum feed rate ( f = 4,000 mm/min) 2,000 mm/min Actual calculated feed rate (f = 1,500 mm/min) 1,433 mm/min Actual calculated feed rate (f = 4,000 mm/min) 3,603 mm/min
S
V #
\ ^
did not include any gouges; the moves were smooth and short enough that they did not produce facets.
Figure 23 shows that the quality of surface is as predicted. There are no special marks or facets seen on the surface.
4 CONCLUDING REMARKS
Test re s u lts c le a rly show th at p o in t arrangem ent along the toolpath has a distinct influence on a surface quality of finished part and machining time.
1. Influence of the toolpath points arrangement on the surface quality
When comparing Figures 17, 19, 21 and 23 it can be clearly seen that surface quality differs from one toolpath to another. When we look at the parts 2 and 4 we can see that the surface is smooth and round, while the surface on the parts 1 and 3 has go u g es and fa c e ts. The re su lts c learly demonstrate that the toolpath tolerance is not the only parameter that influences the quality of the finished surface.
Results (Figs. 8, 11, 13, 15 and Tables 2, 3, 4 and 5) show that the toolpaths that had most evenly arranged points (toolpaths 2 and 4) showed the best results on the surface quality.
The toolpath density is important factor for getting good surface finish quality. If the density is very low this means that the toolpath tolerance was not correctly set. On the other side very high average density of points does not guarantee a good surface quality. T his is clearly p resen ted by comparing toolpath 3 and toolpath 4. Toolpath 4 had almost 2 times lower average point density than toolpath 3 but the surface quality was much better. The reason for lower surface quality in toolpath 3 is the fact that the points were not evenly arranged.
2. Influence o f point arrangem ent on the machining time
At relatively small feed rates the influence of point arrangement to the machining time is not
very large. Even with toolpath 1, which had very low quality of point arrangement, the machining at 1500 m m /m in, was only 10% longer than theoretical machining time.
The influence gets noticeable when the feed rate is increased. When the feed rate was increased to 4000 mm/min the toolpaths with more evenly arranged points (toolpaths 2 and 4) show ed noticeable decrease of machining time. On the other side toolpaths 1 and 3 did not demonstrate almost any decrease of machining time.
5 REFERENCES
[1] Young-Keun, C., B anerjee, A. Tool path generation and tolerance analysis for free-form surfaces. International Journal o f Machine Tools & Manufacture, 47, 2007, p. 689-696. [2] Suresh, K., Yang, D. Constant scallop-height
machining o f free-form surfaces. Journal o f Engineering for Industry, 116,1994, p. 253-259. [3] Farin, G. Curves and surfaces fo r CAGD. San
Diego, CA: Academic Press, 2002.
[4] Loney, G.C., Ozsoy, T.M. Machining o f free form surface. Computer Aided Design, 19,
1987, p. 85-89.
[5] Kopač, J., Pogačnik, M. Theory and practice o f achieving quality surface in turn milling. Int. j. mach, tools manuf, 37/5, 1997, p. 709-715. [6] Krajnik, P., Kopač, J. Modem machining o f die
and mold tools. J. mater, process, technol,
157/158, 2004, p. 543-552.
[7] Roblek, T., Kopač, J. G-code optim ization enables HSC machining at low performance CNC machine tools. Conference proceedings. Celje: Tecos, 2003, p. 331-336.
[8] Zghal, B., Haddar, M, Numerical model for dynamic analysis o f tool and w orkpiece in turning. Advances in Production Engineering & Management, voi. 2, no. 2, June 2007, p. 55-62.