in the population sciences published by the Max Planck Institute for Demographic Research Konrad-Zuse Str. 1, D-18057 Rostock · GERMANY www.demographic-research.org
DEMOGRAPHIC RESEARCH
VOLUME 25, ARTICLE 12, PAGES 407-436
PUBLISHED 9 AUGUST 2011
http://www.demographic-research.org/Volumes/Vol25/12/ DOI: 10.4054/DemRes.2011.25.12
Research Article
Occupational inequalities in health
expectancies in France in the early 2000s:
Unequal chances of reaching and
living retirement in good health
Emmanuelle Cambois
Caroline Laborde
Isabelle Romieu
Jean-Marie Robine
© 2011 Emmanuelle Cambois et al.
This open-access work is published under the terms of the Creative Commons Attribution NonCommercial License 2.0 Germany, which permits use, reproduction & distribution in any medium for non-commercial purposes, provided the original author(s) and source are given credit.
1 Background 408 1.1 Population ageing, health, and working life: The French context 408 1.2 Trends and patterns in health expectancies 409 1.3 Health expectancy differentials: Context and new insight 409
2 Method and data 410
2.1 Occupation and health 410
2.2 Health expectancies calculation method 412 2.3 Health concepts, definitions, and indicators 413 2.4 Interpreting occupational differentials in HE 415
3 Results 416
3.1 Unequal life expectancy and healthy life expectancy 416 3.2 Unequal chances of surviving in good health until age 65 419
4 Discussion 421
4.1 Double disadvantage for low qualified and manual occupations 421 4.2 Large HE differentials for women despite reduced LE differentials 422 4.3 A critical period before the retirement age 422 4.4 Various health situations and varying differentials 423
4.5 Limitations of the datasets 425
4.6 Conclusion 425
5 Acknowledgments 426
Occupational inequalities in health expectancies
in France in the early 2000s:
Unequal chances of reaching and living retirement in good health
Emmanuelle Cambois1
Caroline Laborde2
Isabelle Romieu3
Jean-Marie Robine4
Abstract
Increasing life expectancy (LE) raises expectations for social participation at later ages. We computed health expectancies (HE) to assess the (un)equal chances of social/work participation after age 50 in the context of France in 2003. We considered five HEs, covering various health situations which can jeopardize participation, and focused on both older ages and the pre-retirement period. HEs reveal large inequalities for both sexes in the chances of remaining healthy after retirement, and also of reaching retirement age in good health and without disability, especially in low-qualified occupations. These results challenge the policy expectation of an overall increase in social participation at later ages.
1. Background
1.1 Population ageing, health, and working life: The French context
France has one of the highest life expectancies (LE) at birth in the world: it topped 80 years in the early 2000s and increases, on average, by three months per year. Whether these years of life gained are years of good or poor health is a significant public health issue, especially for forecasting future levels of need of care and assistance (Manton 1982; Fries 1980; Kramer 1980). This is also a critical factor in appraising the potential for social participation at older ages and in identifying (un)equal opportunities in this domain. Indeed, a good health status is a basic requirement for social participation (World Health Organization 1946).
Due to lengthening LE, the legal retirement age5 has recently been raised in France, to balance the number of pension contributors and recipients. However, trends and patterns in health, and therefore ability to work at later ages, received little attention in the debate. Health was only considered through references to studies on the unequal length of healthy life lived after retirement. Yet this issue is also important before retirement for the sustainability of the system. Poor health and activity limitations were found to be major determinants of labour force exit before the retirement age in France and elsewhere (Barnay 2009; Jusot et al. 2008; Sirven and Debrand 2008). Self-reported poor health increases in the years preceding retirement, even in occupational classes where it is already high, before decreasing again after retirement (Westerlund et al. 2009). These studies highlight occupational differentials in health, health deterioration, and the link between health and job loss. Health being a major determinant of social/work participation, social inequalities in health lead to unequal chances of social participation at later ages. This paper explores the extent to which the relatively long LE in France is associated with healthy life, based on various dimensions of health, and whether all social groups follow the same pattern. It presents computations of health expectancies (HE) for occupational groups at ages 50 and 65, and for the 50-65 age group.
5 Reform outcomes in France are both an increase in the number of years of contribution to the retirement
1.2 Trends and patterns in health expectancies
Health expectancy is the average number of years, at a particular age, to be lived in a given health status within total LE (Sullivan 1971). It complements the usual LE by integrating a health component, and has become a major population health indicator, used to monitor health trends worldwide (Jagger and Robine 2011). There are as many HEs as health measures (disability, diseases, perceived health, etc.). Among these, the European Community has recently included the so-called "Healthy Life Years" (HLY) or LE without activity limitation, in the list of structural indicators (Robine et al. 2009). Looking at international trends and patterns in HE, many countries, including France, have experienced a relatively good development, showing that the additional years of LE over the 1990s were not years of disability (Robine, Romieu, and Michel 2003). Even recently France was in the top group in Europe, with 20 remaining years without activity limitation after age 50 (Jagger et al. 2008a). Meanwhile, French men have relatively low HE based on chronic diseases, functional limitations, or good perceived health, compared to other countries; while for women, France more constantly ranks among the top countries, except with regard to good self-perceived health (Jagger et al. 2011; Jagger et al. 2008b). Furthermore, a trend study confirmed that the years of life gained over the 1990s were not years of severe disability, but were years with moderate levels of disability and functional limitations (Cambois et al. 2008). Finally, the French HEs conceal wide disparities (Cambois, Robine, and Hayward 2001). Men in the highly-qualified occupations enjoy a smaller number of years with disability over their longer life than manual workers.
1.3 Health expectancy differentials: Context and new insight
A number of studies worldwide consistently show for the 1990s a double advantage for higher social groups in term of longer and healthier lives compared to lower socioeconomic groups (Crimmins and Cambois 2003). More recent studies confirm this finding (Majer et al. 2010; Bronnum-Hansen et al. 2004; Bronnum-Hansen and Baadsgaard 2008; Matthews, Jagger, and Hancock 2006; Matthews et al. 2009; Minicuci and Noale 2005; Pérès et al. 2005; Van Oyen et al. 2005; Lievre, Alley, and Crimmins 2008; Bossuyt et al. 2004). Although these studies have already illustrated the unequal share of life between years in good and poor health, they are often of limited utility in the debate concerning the prolongation of working life.
were based on occupations, linking poor health and shorter life expectancy in the unskilled occupations (Melzer et al. 2000; Bronnum-Hansen 2000).
Second, HEs are mainly based on only one health indicator: self-perceived health, severe disability, or general disability. Each of these indicators, although highly informative, only partially documents health situations and related differentials. For instance, severe disability provides useful information for public health policies targeting elders and for assessing need of assistance in personal care, but such disability is quite rare before age 70 and of limited interest for describing health in late working ages. Referring only to years with severe disability might under-estimate critical periods of poor health that may jeopardize work and social participation.
Finally, in these studies HEs are computed at ages 30 or 65, counting the aggregate number of years in good/poor health to be lived over the entire remaining life course or over the retirement period. But none of these indicators shed light on how these years are distributed before or after retirement and whether or not the differentials are compressed at the end of life or already exist at working ages. This information is essential for the debate on the possible postponement of the retirement age. French estimates of partial HE between ages 50 and 60 for 1980 and 1991 showed small differentials in this age range (Cambois et al. 2001).
Our study aims to estimate HE differentials by 1) using the entire occupational classification encompassing employed, self-employed, and economically inactive; 2) using a variety of health dimensions to better document health situations and differentials; and 3) examining the pre-retirement period using partial HE calculations to account not only for unequal chances of healthy ageing, but also for unequal chances of reaching retirement in good health. This study provides new and more complete estimations of occupational differentials in HE in France, both of which are useful in the framework of the public health objective of reducing inequalities, and contribute to the debate on expanded social participation of older adults and more specifically on the postponement of the legal retirement age.
2. Method and data
2.1 Occupation and health
(McDonough 2000; Ferrie et al. 1995). These job characteristics are unevenly distributed by occupational class worldwide and this is also recurrently highlighted in France (Cohidon and Santin 2007; Arnaudo et al. 2004; de Gaudemaris et al. 2002). Greater exposure to risk factors of poor health at work and more generally in daily life, and a lower ability to access care and to cope with health problems, contribute to the occupational differentials in HE (Marmot et al. 2008).
Under the French classification, occupational classes are based on occupations, skills, and wage levels (Desrosières and Thévenot 2002) (Box 1). We used six occupational classes (including the employed, unemployed, and retired) and the economically inactive group (not retired or retired with no reported previous occupation). Occupational classification enables us to describe a range of social situations within the population rather than simply comparing lower/higher classes. What is happening in-between also needs to be documented (Marmot et al. 2008).
Box 1: The occupational classification in France
Names (short labels used in tables)
Example of occupations Comment
Highly-qualified occupations (High. qualif.)
Intellectual occupations, upper managerial staff and administrators, medical doctors, independent professionals, engineers
Intermediate occupations (Interm. Occup.)
Primary teachers, skilled technicians, supervisors, medical and social workers, intermediate managerial functions and administrators, clergy
High-wage occupations with above-average qualifications.
Clerks and employees
Clerical and sales workers, civil servants, police and army, private-sector
administrative staff, sales and direct personal services
Manual workers
(Manual Wk.) Skilled, unskilled, and farm workers
Low-wage occupations with lowest qualifications, harder working conditions and above-average risk of unemployment
Farmers (Farmers) Various size farm businesses
Self-employed (Self-Empl.)
Business, trade, and craft self-employed occupations (Shop owners, business owners, craft industry, self-employed workers).
Self-employed occupations, including diverse social situations (size of the business,...), but with some common features (managing own business,…)
Inactive group (Inactive)
Economic inactivity: Students, conscripts, disability pensioners, currently not working for reasons other than employment or retirement.
2.2 Health expectancies calculation method
Calculation. We used the Sullivan method (Sullivan 1971), based on health
prevalences drawn from standard population health surveys, life tables, and long term care (LTC) institutionalization rates, stratified by sex, age group, and occupational class. Starting with the occupation-specific life tables, we first broke down the five-year-age-group person-years into years lived in LTC institutions and years lived in private households, based on the age- and occupation-specific LTC institutionalization rates. The "person-years in institutions" are all considered as "person-years in poor health", as suggested in Sullivan's method. Second, we broke down the remaining person-years into person-years in good and poor health by applying the five-year-age-group specific weighted prevalence of health problems obtained from the health survey for each occupational class. Finally, HEage x is the sum of the five-year-age-group
"healthy person-years" from age x divided by the total survivors at age x. Partial HE50-65
is obtained by summing the five-year-age-group "healthy person-years" from age 50 to age 64, divided by the survivors at age 50. HE confidence intervals were estimated taking into account the sample sizes of the mortality follow-up and of the health survey (Jagger et al. 2006). We computed HE50, HE65 and partial HE50-65 for each occupational
class.
Occupational life tables. Unlike life tables for the general population, life tables
by occupational class are not routinely computed by the French National Institute of Statistics and Economics Studies (INSEE). We therefore constructed ad hoc occupational life tables using INSEE's “permanent demographic sample” (EDP) (Couet 2006). The EDP is a 1% representative population sample followed up from census to census since 1968. The sample is matched with vital status information so that the population can be stratified by occupational class at census, and deaths occurring in the various classes in the following years can be recorded. In this study we used the 1999 EDP sample comprising 157,628 men and 174,295 women aged 30 and above at the time of the 1999 census. 21,136 deaths occurred in this sample over the five-year follow-up period (1999-2003). We computed occupational life tables with these data modeled with IMaCh (Lièvre, Brouard, and Heathcote 2003).
Population living in institutions.Like most population surveys, the French health
2.3 Health concepts, definitions, and indicators
Conceptual framework. Health can be defined in terms of morbidity (symptoms,
conditions, chronic diseases etc.), functional health (impairment, disability, handicap etc.), subjective health (self-perceived health, quality of life, etc.). These dimensions can be described as a process advancing from disease through to dependence via a variety of situations (Wood and Badley 1978; World Health Organization 2001; Verbrugge and Jette 1994). Chronic diseases or accidents may affect the organs and the basic metabolism (impairments), leading to deterioration of the body functions (locomotor, sensory, and cognitive functional limitations), which in turn leads to difficulties in or inability to perform daily activities (activity restrictions), in interaction with individual resources and environmental factors (Box 2). There are unequal risks that a given disease (or accident) will lead to functional disorders and that these functional limitations will lead to activity restrictions. This depends in part on the person’s resources and environment, especially availability of technical aids, and home or workplace adaptation to compensate for functional decline and to maintain activity (Verbrugge, Rennert and Madans 1997; Agree 1999).
We use various indicators to disentangle these health and disability statuses in order to document social differentials in health. We assume that unequal social/work participation is the result of either unequal exposure to risk factors of poor health and of disease and functional limitations on the one hand, and/or unequal resources to compensate for their impact on daily activities (care, devices…) on the other.
Health Survey and health indicators.The health indicators used in this study are
from the 2002-2003 French health survey (DREES 2008). The survey was conducted on a representative sample of private households. Self-reported information on health status, prevention, and health behaviour was obtained via three interviews. For each private household the data collection concerns all household members and spanned a one-month period. Our study sample comprises 13,438 men and women aged 50 and over. In this study we selected five health measures based on the conceptual framework of the disablement process (collected during the first and the last interview, with a weighting system to compensate for attrition between the interviews and sample distortion):
1) Self-reported chronic diseases (reporting a chronic or long-term disease or condition). This question is part of the Minimum European Health Module (Eurostat), designed to identify diseases which are a potential source of care use and disability (Cox et al. 2009).
2) Self-perceived health. This question is also part of the European Minimum Health Module and is based on the recommendations of WHO-Europe (De Bruin, Picavet, and Nossikov 1996). In this study we consider persons reporting being in very good or good perceived health, as opposed to those who report being in fair to very poor perceived health.
3) Physical and sensory functional limitations (reporting difficulty in at least one of the following situations: clearly seeing newspaper print, recognizing someone’s face across the street, clearly hearing what is said in a conversation, walking a certain distance, going up or down stairs, using hands and fingers to manipulate small objects). These questions are based on proposals from the mid-1960s (Nagi 1965). In this study we focus on residual functional limitations (difficulties despite aids and devices) to capture forms of body function alterations which are not (sufficiently) compensated and which expose people to restriction in daily activities.
activity without specifying the type of activity concerned (work, household chores, leisure, personal care, etc.). GALI was found to be correlated to functional limitations, restrictions in personal care or domestic activities, and to reflect work disability in the working-age population (Tubeuf et al. 2008).
5) ADL-restrictions(difficulty in or need of assistance for washing, getting dressed, feeding, getting in and out of bed). They correspond to the most severe level of activity restrictions, usually defined as difficulties in activities of daily living (Katz et al. 1963). They reflect situations of dependence requiring human assistance. They are a common measurement instrument but represent a limited range of disability situations. ADL-restrictions reflect situations of social exclusion in many areas of life due to severely impaired functioning.
2.4 Interpreting occupational differentials in HE
In the framework described above occupational differentials in LE with/without chronic diseases reflect differentials in exposure to diseases and accidents, as well as in associated risk factors, general health practices, health literacy, and knowledge about own health status. They indicate a risk of further functional decline.
LE in poor/good-perceived health provides complementary information. Self-perceived health is linked to retirement transitions and work conditions, but more generally is a strong predictor of mortality (Idler and Benyamini 1997) and functional decline (Idler and Kasl 1995; Ferraro, Farmer, and Wybraniec 1997). It is shaped by chronic illness, functional health, activity, affect, medication, and use of health services, as well as by psychosocial factors, including those linked to work (Salavecz et al. 2010; Benyamini et al. 2000; Goldstein, Siegel, and Boyer 1984; von dem Knesebeck, Dragano, and Siegrist 2005; Westerlund et al. 2009). It is therefore also a relevant indicator for understanding inequalities due to socially differentiated health-damaging physical and psychosocial exposures over the life course and working career. Occupational differentials in self-perceived health reflect inequalities in health, personal abilities, and work and life conditions. It helps to identify exposures that alter mental and psychological well-being.
compensate for such limitations (technical devices, adaptation of residential/work environments) with a view to lowering the risk of further activity restrictions. Occupational differentials in LE with/without functional limitations should reflect the differentials in exposure to risk factors of poor health which impair body functions, such as exposure to health-damaging working conditions. They reflect unequal functional resources required to perform normal activities. Activity restrictions, especially ADL restrictions, correspond to complex disability situations in which severely deteriorated health prevents normal performance of activities of daily living. Occupational differentials in LE with/without activity restrictions correspond to differences in the type and severity of health problems and to different ways of coping with them. They reflect unequal chances of independence and work/social participation. LE in poor perceived health, with functional limitations or self-reported chronic diseases captures periods of self-reported deteriorated health status, which are known to be predictive of further activity restrictions and premature retirement, even if the health problems concerned are not diagnosed and acknowledged as potential work disabilities. We consider these three health dimensions as indicators of individual resources required for social participation, and therefore as indicators of potential restriction in social participation. We consider LE with activity restriction (GALI or ADL) as indicators of actual restriction in social participation. The difference between potential and actual restriction in social participation relates to the capacity to cope with deteriorated health, which is unequal across social groups (Verbrugge et al. 1997).
3. Results
3.1 Unequal life expectancy and healthy life expectancy
Table 1 shows the distribution of the study population by gender and occupational class, as well as the raw and age-standardized prevalence (age 50+) for the five health indicators. Differences in the prevalences are large, with the economically inactive (comprising relatively old and ill men) having the highest prevalences, followed by manual workers. Farmers also display a high prevalence of functional limitations.
functional limitation, and six additional years withoutGALI or ADL restrictions. The smallest differential, three years, concerns LE withoutchronic disease.
Table 1: Size of the occupational group in the 2002-03 health survey sample
(and weighted percentages) and prevalence
(raw and age-standardized) of poor health and disability. France, men and women aged 50 and over
Row and age-standardized* health and disability prevalences Sample size and
distribution
Chronic diseases
Poor perceived health
Functional
limitations GALI
ADL restrictions N % weighted Raw Stand. Raw Stand. Raw Stand. Raw Stand. Raw Stand.
High. qualif. 1,191 16.0 % 51% 52% 22% 24% 27% 29% 14% 15% 2% 3%
Interm occup. 1,333 20.4 % 53% 54% 30% 31% 33% 34% 18% 19% 3% 3%
Farmers 455 8.6 % 62% 56% 49% 42% 50% 42% 23% 20% 8% 6%
Self-empl. 699 11.6 % 52% 51% 33% 32% 40% 38% 18% 17% 5% 4%
Clerks 502 8.6 % 52% 52% 36% 36% 35% 36% 19% 19% 5% 5%
Manual Wk. 1,837 31.2 % 57% 57% 47% 47% 48% 48% 24% 24% 7% 7%
Inactive 212 3.6 % 74% 42% 72% 54% 73% 53% 70% 56% 19% 10%
Men
Total 6,229 100.0 % 55% 55% 38% 38% 41% 41% 22% 22% 6% 6%
High. qualif. 564 6.4 % 48% 53% 24% 28% 24% 31% 15% 18% 4% 6%
Interm occup. 975 11.5 % 55% 58% 35% 39% 34% 39% 21% 23% 4% 5%
Farmers 455 7.8 % 69% 62% 55% 48% 58% 48% 33% 27% 13% 9%
Self-empl. 423 6.2 % 60% 54% 41% 43% 48% 40% 29% 25% 10% 10%
Clerks 2,321 32.7 % 61% 61% 45% 47% 47% 48% 24% 24% 7% 10%
Manual Wk. 887 13.1 % 67% 65% 54% 54% 54% 49% 28% 27% 10% 9%
Inactive 1,584 22.4 % 64% 64% 48% 46% 48% 49% 29% 29% 9% 9%
Women
Total 7,209 100.0 % 61% 61% 45% 45% 46% 46% 26% 26% 8% 8%
Source: 2002-03 French health survey, INSEE. * Prevalence standardized on the age structure of the male and female population aged 50 and over.
Overall, women live longer but spend more years with health problems than men. For women, the differentials in years in good perceived health and years without functional limitations between highly-qualified occupations and manual workers are similar to those observed for men, while differentials in LE are much smaller. The differentials regarding activity restrictions are less pronounced for women than for men.
g 0 )
Table 2: Life and Health expectancies at age 50 and at age 65 by occupational
class in France, 2002-03 (Men and women a ed 5 and over
The HE/LE ratios show the unfavourable picture for farmers, male clerks, and manual workers for chronic diseases, poor perceived health and functional limitations (Table 2). They spend half of their life with poor well-being and physical functioning, much longer than highly-qualified, intermediate, and self-employed occupations. This pattern is even more pronounced at age 65, due to the higher prevalence of morbidity and functional problems.
3.2 Unequal chances of surviving in good health until age 65
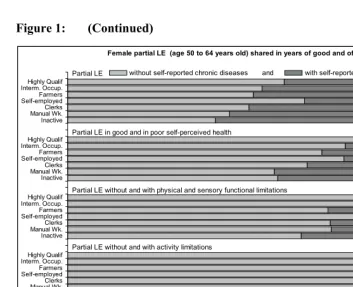
Figure 1 presents partial LE in the age range surrounding the retirement ages (LE50-65).
It shows unequal risks of premature mortality and poor health status (for those who are still alive at age 50). Among 50-year-olds, a number will survive and remain healthy until age 65, but others will not remain healthy or even not survive over the 15-year period. On average, leaving aside the economically inactive men, between 0.5 and 1 year are lost due to premature mortality in this age range in each male occupational group (less than 0.5 years for females). Meanwhile, the potential number of healthy years lost is much larger. For both sexes, highly-qualified occupations, the self-employed, and clerks have longer LE50-65 and HE50-65. The economically inactive will
enjoy less than a third of this 15-year span in good health (except for ADL restrictions). Manual workers who reach the age of 50 can expect to live fewer than nine years without functional limitations and in good perceived health within the 15-year age range, vs more than 12 years in highly-qualified occupations. The graph also shows the paradoxical situation of male farmers: LE50-65 is high, and close to that of self-employed
men, while their HE50-65 is lower, especially for functional limitation and perceived
health.
While premature mortality is lower for women than for men, they have no advantage in HE50-65. They live even fewer years without chronic diseases. Both male
Figure 1: Male and female partial health and life expectancies in the 50-64 age range for various health dimensions in the occupational classes (current or previous if retired)
0 1 2 3 4 5 6 7 8 9 10 11 12 13 14 15
Inactive Manual Wk.Clerks Self-employedFarmers Interm. Occup.Highly Qualif Inactive Manual Wk.Clerks Self-employedFarmers Interm. Occup.Highly Qualif Inactive Manual Wk.Clerks Self-employedFarmers Interm. Occup.Highly Qualif Inactive Manual Wk.Clerks Self-employedFarmers Interm. Occup.Highly Qualif Inactive Manual Wk.Clerks Self-employedFarmers Interm. Occup.Highly Qualif
Partial LE without and with difficulties in personal care activities Partial LE without and with activity limitations
Partial LE without and with physical and sensory functional limitations Partial LE in good and in poor self-perceived health
Male partial LE (age 50 to 64 years old) shared in years of good and of poor health
Figure 1: (Continued)
0 1 2 3 4 5 6 7 8 9 10 11 12 13 14 15
Inactive Manual Wk.Clerks Self-employedFarmers Interm. Occup.Highly Qualif Inactive Manual Wk.Clerks Self-employedFarmers Interm. Occup.Highly Qualif Inactive Manual Wk.Clerks Self-employedFarmers Interm. Occup.Highly Qualif Inactive Manual Wk.Clerks Self-employedFarmers Interm. Occup.Highly Qualif Inactive Manual Wk.Clerks Self-employedFarmers Interm. Occup.Highly Qualif
Expected Years of Life
Partial LE without and with difficulties in personal care activities Partial LE without and with activity limitations
Partial LE without and with physical and sensory functional limitations Partial LE in good and in poor self-perceived health
Female partial LE (age 50 to 64 years old) shared in years of good and of poor health
Partial LE without self-reported chronic diseases and with self-reported chronic diseases
Source: Computations based on 2002-2003 French Health Survey, INSEE / 1999-2003 mortality follow-up in EDP, INSEE / 1998-1999 Disability survey, INSEE
4. Discussion
4.1 Double disadvantage for low qualified and manual occupations
working conditions are generally health-damaging (physically demanding, time constraints, outdoor work) and can actually cause functional deterioration. Surprisingly, this does not affect their LE and LE without activity restrictions.
4.2 Large HE differentials for women despite reduced LE differentials
Women display large occupational differentials in HE despite the small differences in LE. They have a higher LE than men, whatever the occupational situation, but this does not confer an advantage in terms of HE.
While other social criteria, such as spouse's occupation or family structure, are more appropriate for highlighting mortality differentials among women (Arber 1997; Mejer and Rober-Bobée 2003), in this study we used their own occupation to examine the potential health impact of their work conditions and careers. Except for the inactive class (which do not have the same role in the male and female labour markets), occupational differentials in HE are actually of the same order of magnitude as for men. This result means that women's careers may be as health-damaging as those of men, and that they also have unequal chances of reaching retirement age in good health.
4.3 A critical period before the retirement age
This study highlighted large partial HE50-65 differentials between manual workers and
highly-qualified occupations, ranging from more than one year for LE without activity restrictions to more than four years for LE50-65 in good perceived health. In this age
group women and men spend an equivalent period of time with some functional health problems, which jeopardize work and social participation in late working ages to the same extent for both men and women.
We cannot directly compare our results with other studies, including for France, due to data comparability problems (Cambois, Robine, and Mormiche 2007) or differences in the methods of computation and social criteria used. We nonetheless note that estimates for 1991 showed a much smaller gap of 0.3 years in DFLE50-59 between
qualified occupational classes and manual workers (Cambois et al. 2001). These differences are due, first, to the size of the age groups (50-65 years in this study versus 50-59 years in the 1991 study, excluding the 60-64 age group); second, to the more detailed distribution across occupational classes (in the previous study the three groups produced more heterogeneity within groups and fewer differences between them); and, third, to the measurement of various disability dimensions. In the European study,
Community Household Panel data, are about two years between higher educated and lower educated groups (Majer et al. 2010). Here the differential seems closer to what was found in our study; yet we guess it would have been larger if the distribution had been based on occupational distribution, as the disability indicator of this survey is usually close to moderate levels of disability (such as functional limitations) (Cambois et al. 2008).
4.4 Various health situations and varying differentials
The largest differentials are observed for functional limitations and poor perceived health. Among manual workers onset of poor health begins earlier than for members of other occupational classes. Indeed, functional limitations and poor perceived health are much more frequent in manual occupations than in qualified occupations, as they are closely linked to work/life conditions (Salavecz et al. 2010; von dem Knesebeck et al. 2005; Crimmins and Hayward 2004). Poor perceived health and functional limitations jeopardize the ability to work, so we consider these two HE indicators as warning periods for potential restrictions in social participation. They reflect the exhaustion of physical and mental resources.
Despite the relatively high French HLY value in Europe at age 50 (Jagger et al. 2008a), differentials between manual workers and highly qualified occupations are six years for men (five for women). GALI is closely linked to work inactivity as found in a recent study (Tubeuf et al. 2008). This is also confirmed by the extremely low HE without GALI we obtained for inactive men. As a summary measure GALI is a useful indicator, being a step further in the disablement process, when daily life is already affected by health and functioning problems. HE with GALI reflects periods of actual restrictions in social participation, which already amount to more than 2.5 years for manual workers in the 50-65 age group (vs. less than 2 years for highly qualified occupations).
At the end of the process ADL restrictions reflect an even more severely deteriorated health status. LE50 with ADL restrictions reflects periods over which care
and assistance are required: it is around three years for manual workers and two years for the highly qualified occupations. A study of a French elderly cohort (PAQUID) measured educational differentials in HE and concluded that there is probably an incompressible minimum period of time at the end of life to be lived with severe disability such as ADL restrictions, whatever the social status (Pérès et al. 2005). Small absolute differentials in LE50 with ADL restrictions mean large differentials in LE50
of recovery for the lower social groups, explaining the remaining social gaps in HE even at older ages (Jagger et al. 2007b; Minicuci and Noale 2005; Majer et al. 2010). These results point up differences in the capacity to manage health problems and cope with functional limitations in order to recover or maintain the level of activity and autonomy.
Finally, we found a three-year differential between higher and lower social groups in LE without chronic diseases for men aged 50 (four years for women) due to differences in exposure to hazardous environments, in health behaviours and in access to care. Under the disablement process model these HE differentials provide a partial explanation for the differentials in LE without functional limitations and activity restrictions. A study in the Netherlands showed that non-fatal disabling diseases were clearly contributing to social differences in DFLE (Nusselder et al. 2005). The contribution of a number of diseases, including depression, to differentials in DFLE has also been demonstrated in a British cohort (Peres, Jagger, and Matthews 2008; Matthews et al. 2009; Jagger et al. 2007a).
Meanwhile, we found relatively small differentials for LE withoutchronic diseases in this study compared to LE without functional limitations, while other studies have highlighted a clear relationship between diseases and occupational groups in France (Melchior et al. 2005a; Melchior et al. 2005b; Menvielle et al. 2003; Leclerc, Kaminski, and Lang 2008; Lang et al. 1997). Our results can be explained by under-reporting of diseases in surveys in the lowest social groups. This is due to their lower access to care which makes them less likely to detect and therefore to report health problems (Tubeuf et al. 2008; Mackenbach, Looman, and van der Meer 1996). Our aggregate indicator of morbidity, LE without chronic diseases, might therefore be less useful than the other indicators for addressing the issues explored in this study. A more relevant approach could be to select specific diseases that are known to be responsible for the onset of functional limitations and for social differentials (Dalstra et al. 2006; Jagger et al. 2007a).
4.5 Limitations of the datasets
Beside the issue of reporting bias there are other drawbacks associated with the datasets, which tend to under-estimate the occupational differentials. First, the household surveys may have excluded more people of low socioeconomic status in poor health due to a selection effect on respondents, thereby artificially lowering the prevalence of poor health in these groups, as was demonstrated with the Belgian population (Lorant et al. 2007). Second, there were no measures of deterioration in mental functions in the questionnaire, which is difficult to assess in such a survey. This dimension is clearly lacking in this study, yet it is partly represented in the reporting of chronic diseases and poor self-perceived health.
There are also limitations due to the HE computation method used. First, considering all years lived in an LTC institution as years lived in poor health may artificially increase the prevalence of poor health statuses, such as disability. However, a sensitivity study showed an underestimation of only a few months when computing DFLE estimates, which are within the confidence intervals (Cambois et al. 2008). Second, LE and HE are intended to be period indicators that summarize the probability of dying, of becoming disabled, and of recovering from disability over a given period, using incidence data; but computing these probability sets requires data collected through multi-wave surveys which are quite rare and also have major biases, which do not impact the various social groups equally (attrition, under-registration of mortality). The Sullivan method is a good compromise, using cross-sectional prevalence of disability rather than period incidence and recovery data. But, being based on prevalence, the method includes both current and past incidences of disability (Rogers, Rogers, and Branch 1989; Hoem 1977). A study on this topic did not find much variation in the final HE estimates using period incidences or cross-sectional prevalences (Imai and Soneji 2007). Nevertheless, the differentials in HE in our study reflect differentials not only linked to current exposure but also to past exposure and standard of living.
4.6 Conclusion
LE50-65 ingood perceived health and withoutfunctional limitations, which reflects
differentials in exposure to both physically and mentally damaging life/work conditions, reveals a critical period prior to age 65. With an average of nine years of
LE50-65 without functional limitations, manual workers have the lowest chances of
surviving and reaching the legal retirement age in good functional health, under today's health and work conditions. These indicators can be used as a warning for periods of high risk for further activity limitations, especially in late working ages.
Indeed, partial LE50-65 with GALI confirms that activity limitations exist before
age 65, especially for manual workers. This indicator measures a period of difficulties with regular activities, including work. For those who cannot remain in the labour force until the legal retirement age, it means exclusion from the regular system for a longer period and an increasing risk of low pensions and social precariousness. In the debate about the retirement system, this challenges the legitimacy of postponing the legal age for labour force withdrawal (without pension penalties) for all occupational categories. In relation to public health policies, LE with ADL restrictions measures the period over which care and assistance are needed. It is the result of the whole disablement process, and our results again point out inequalities in the length of this period across occupational classes.
Increasing LE without functional limitations and in good perceived health requires interventions to improve life/work conditions and decrease the exposure to various risk factors. It could also be achieved by facilitating occupational mobility away from physically/mentally demanding jobs or situations in order to shorten periods of exposure and alleviate the early risk of functional deterioration. But it could also be achieved by improving access to compensation strategies and rehabilitation. HE indicators should definitely help to monitor achievements and developments in these different directions.
5. Acknowledgements
References
Agree, E.M. (1999). The influence of personal care and assistive devices on the measurement of disability. Social Science & Medicine 48(4): 427-443.
doi:10.1016/S0277-9536(98)00369-4.
Arber, S. (1997). Comparing inequalities in women’s and men’s health: Britain in the 1990s. Social Science & Medicine 44(6): 773-787.
doi:10.1016/S0277-9536(96)00185-2.
Arnaudo, B., Magaud-Camus, I., Sandret, N., Coutrot, T., Floury, M.-C., Guignon, N., Hamon-Cholet, S., and Waltisperger, D. (2004). L’exposition aux risques et aux pénibilités du travail de 1994 à 2003: Premiers résultats de l’enquête SUMER 2003. 52(1): 1-8.
Barnay, T. (2009). In which ways do unhealthy people older than 50 exit the labour market in France? European Journal of Health Economics 11(2): 127-140.
doi:10.1007/s10198-009-0155-4.
Benyamini, Y., Idler, E.L., Leventhal, H., and Leventhal, E.A. (2000). Positive affect and function as influences on self-assessments of health: Expanding our view beyond illness and disability. The Journals of Gerontology Series B 55(2): P107-P116. doi:10.1093/geronb/55.2.P107.
Bossuyt, N., Gadeyne, S., Deboosere, P., and Van Oyen, H. (2004). Socio-economic inequalities in health expectancy in Belgium. Public Health 118(1): 3-10.
doi:10.1016/S0033-3506(03)00130-6.
Bronnum-Hansen, H. (2000). Socioeconomic differences in health expectancy in Denmark. Scandinavian Journal for Public Health 28(3): 194-199.
Bronnum-Hansen, H., Andersen, O., Kjoller, M., and Rasmussen, N.K. (2004). Social gradient in life expectancy and health expectancy in Denmark. Sozial- und
Präventivmedizin 49(1): 36-41. doi:10.1007/s00038-003-3003-9.
Bronnum-Hansen, H. and Baadsgaard, M. (2008). Increase in social inequality in health expectancy in Denmark. Scandinavian Journal of Public Health 36(1): 44-51.
doi:10.1177/1403494807085193.
Cambois, E., Clavel, A., Robine, J.-M., and Romieu, I. (2008). Trends in disability-free life expectancy at age 65 in France: Consistent and diverging patterns according to the underlying disability measure. European Journal of Ageing 5(4): 287-298.
Cambois, E., Robine, J.-M., and Hayward, M.D. (2001). Social inequalities in disability-free life expectancy in the French male population (1980-1991).
Demography 38(4): 513-524. doi:10.1353/dem.2001.0033.
Cambois, E., Robine, J.-M., and Mormiche, P. (2007). Did the prevalence of disability massively decreased in France over the 1990's? A discussion of questions asked in the French health survey. Population E 62(2): 313-336.
Chau, N. and Khlat, M. (2009). Strong association of physical job demands with functional limitations among active people: A population-based study in North-eastern France. International Archives of Occupational and Environmental
Health 82(7): 857-866. doi:10.1007/s00420-009-0394-9.
Cohidon, C. and Santin, G. (2007). Conditions de travail selon l’activité professionnelle dans l’enquête décennale santé 2003 de l’Insee. INVS, Rapport de l’INVS. Couet, C. (2006). L'échantillon démographique permanent de l'INSEE. Courrier des
statistiques (117-119): 5-14.
Cox, B., Van Oyen, H., Cambois, E., Jagger, C., Le Roy, S., Robine, J.-M., and Romieu, I. (2009). The reliability of the Minimum European Health Module.
International Journal of Public Health 54(2): 55-60.
doi:10.1007/s00038-009-7104-y.
Crimmins, E.M. and Cambois, E. (2003). Social inequalities in health expectancy. In: Robine, J.M., Jagger, C., Mathers, C., Crimmins, E., and Suzman, R. (eds.).
Determing health expectancies. Chichester: John Wiley & Sons, Ltd: 111-126.
Crimmins, E.M. and Hayward, M.D. (2004). Workplace characteristics and work disability onset for men and women. Sozial- und Präventivmedizin 49(2): 122-131. doi:10.1007/s00038-004-3105-z.
Dalstra, J.A., Kunst, A.E., Mackenbach, J.P., and EU Working Group on Socioeconomic Inequalities in Health (2006). A comparative appraisal of the relationship of education, income and housing tenure with less than good health among the elderly in Europe. Social Science & Medicine 62(8): 2046-2060. doi:10.1016/j.socscimed.2005.09.001.
De Bruin, A., Picavet, H.S.J., and Nossikov, A. (1996). Health interview surveys: Towards international harmonization of methods and instruments. Copenhagen: WHO Regional Office for Europe.
diseases. Annales de Cardiologie et d'Angeiologie (Paris) 51(6): 367-372.
doi:10.1016/S0003-3928(02)00149-X.
Desrosières, A and Thévenot, L. (2002). Les catégories socioprofessionnelles. Paris: La Découverte.
DREES (2008). Dossier: Etat de santé: Quelques illustrations des apports, limites et perspectives de l’Enquête décennale Santé. Revue Française des Affaires Sociales 1: 7-104.
Ferraro, K.F., Farmer, M.M., and Wybraniec, J.A. (1997). Health trajectories: Long-term dynamics among black and white adults. Journal of Health and Social
Behavior 38(1): 38-54. doi:10.2307/2955360.
Ferrie, J.E., Shipley, M.J., Marmot, M.G., Stansfeld, S., and Davey Smith, G. (1995). Health effects of anticipation of job change and non-employment: Longitudinal data from the White Hall Study II. British Medical Journal 311: 1264-1269. Fried, L.P., Bandeen-roche, K., Williamson, J.D., Prasada-Rao, P., Chee, E., Tepper, S.,
and Rubin, G.S. (1996). Functional decline in older adults: Expanding methods of ascertainment. Journal of Gerontology: Medical Sciences 51A(5): M206-M214. doi:10.1093/gerona/51A.5.M206.
Fries, J.F. (1980). Aging, natural death, and the compression of morbidity. The New
England Journal of Medicine 303(3): 130-135. doi:10.1056/
NEJM198007173030304.
Goldstein, M.S., Siegel, J.M., and Boyer, R. (1984). Predicting changes in perceived health status. American Journal of Public Health 74(6): 611-614.
doi:10.2105/AJPH.74.6.611.
Hoem, J.M. (1977). A markov chain model of working life tables. Scandinavian
Actuarial Journal (1): 1-20.
Huisman, M., Kunst, A., Deeg, D., Grigoletto, F., Nusselder, W., and Mackenbach, J. (2005). Educational inequalities in the prevalence and incidence of disability in Italy and the Netherlands were observed. Journal of Clinical Epidemiology
58(10): 1058-1065. doi:10.1016/j.jclinepi.2004.12.011.
Idler, E.L. and Kasl, S.V. (1995). Self-ratings of health: Do they also predict change in functional ability? Journals of Gerontology B 50(6): S344-S353. doi:10.1093/
geronb/50B.6.S344.
Imai, K. and Soneji, S. (2007). On the estimation of disability-free life expectancy: Sullivan's method and its extension. Journal of the American Statistical
Association 102(480): 1199-1211. doi:10.1198/016214507000000040.
Jagger, C., Cox, B., Le Roy, S., and EHEMU group (2006). Health expectancy calculation by the Sullivan Method. Third Edition. EHEMU Technical Report. Jagger, C., Gillies, C., Moscone, F., Cambois, E., Van Oyen, H., Nusselder, W.,
Robine, J.-M., and EHLEIS team (2008). Inequalities in healthy life expectancies in EU25: A cross-national meta-regression analysis. The Lancet
9656(372): 2124-2131. doi:10.1016/S0140-6736(08)61594-9.
Jagger, C., Matthews, R., Matthews, F., Robinson, T., Robine, J.-M., and Brayne, C. (2007). The burden of diseases on disability-free life expectancy in later life. The
Journals of Gerontology A 62(4): 408-414.
Jagger, C., Matthews, R., Melzer, D., Matthews, F., and Brayne, C. (2007). Educational differences in the dynamics of disability incidence, recovery and mortality: Findings from the MRC Cognitive Function and Ageing Study (MRC CFAS).
International Journal of Epidemiology 36(2): 358-365. doi:10.1093/ije/dyl307.
Jagger, C. and Robine, J.-M. (2011). Healthy life expectancy. In: Rogers, R.G. and Crimmins, E.M. (eds.). International Handbook of Adult Mortality. Springer: 551-568.
Jagger, C., Robine, J.-M., Van Oyen, H., and Cambois, E. (2008). Life Expectancy with Chronic Morbidity. In: European Commission (ed.). Major and Chronic
Diseases Report 2007. Luxembourg: European Commission: 292-304.
Jagger, C., Spiers, N., and Arthur, A. (2005). The role of sensory and cognitive function in the onset of activity restriction in older people. Disability and Rehabilitation
27(5): 277-283. doi:10.1080/09638280400006523.
Jagger, C., Weston, C., Cambois, E., Van Oyen, H., Nusselder, W., Doblhammer, G., Rychtarikova, J., and Robine, J.-M. (2011). Inequalities in health expectancies at older ages in the European Union: Findings from the Survey of Health and Retirement in Europe (SHARE). Journal of Epidemiology and Community
Jusot, F., Khlat, M., Rochereau, T., and Sermet, C. (2008). Job loss from poor health, smoking and obesity: A national prospective survey in France. Journal of
Epidemiology and Community Health 62(4): 332-337. doi:10.1136/
jech.2007.060772.
Karasek, R.A. (1990). Lower health risk with increased job control among whitecollar workers. Journal of Organizational Behavior 11(3): 171-185. doi:10.1002/ job.4030110302.
Katz, S., Ford, A.B., Moskowitz, R.W., Jackson, B.A., and Jaffe, M.W. (1963). Studies of illness in the aged. The Index of ADL: A standardized measure of biological and psychosocial function. Journal of the American Medical Association
185(12): 914-919. doi:10.1001/jama.1963.03060120024016.
Kempen, G.I.J.M., Steverink, N., Ormel, J., and Deeg, D.J.H. (1996). The assessment of ADL among frail elderly in an interview survey: Self-report versus performance-based tests and determinants of discrepancies. Journal of
Gerontology: Psychological Sciences 51B(5): 254-260. doi:10.1093/geronb/
51B.5.P254.
Kramer, M. (1980). The rising pandemic of mental disorders and associated chronic diseases and disabilities. Acta Psychiatrica Scandinavica 62(S285): 382-397. doi:10.1111/j.1600-0447.1980.tb07714.x.
Lang, T., Ducimetiere, P., Arveiler, D., Amouyel, P., Cambou, J.P., Ruidavets, J.B., Montaye, M., Meyer, V., and Bingham, A. (1997). Incidence, case fatality, risk factors of acute coronary heart disease and occupational categories in men aged 30-59 in France. International Journal of Epidemiology 26(1): 47-57. doi:10.1093/ije/26.1.47.
Leclerc, A., Kaminski, M., and Lang, T. (2008). Inégaux face à la santé. Du constat à
l'action. Paris: Inserm/La découverte.
Lievre, A., Alley, D., and Crimmins, E.M. (2008). Educational differentials in life expectancy with cognitive impairment among the elderly in the United States.
Journal of Aging and Health 20(4): 456-477. doi:10.1177/0898264308315857.
Lièvre, A., Brouard, N., and Heathcote, C. (2003). The estimation of health expectancies from cross-longitudinal surveys. Mathematical Population Studies
10(4): 211-248. doi:10.1080/713644739.
survey and a census. International Journal of Epidemiology 36(6): 1292-1299. doi:10.1093/ije/dym191.
Mackenbach, J.P., Looman, C.W., and van der Meer, J.B. (1996). Differences in the misreporting of chronic conditions, by level of education: The effect on inequalities in prevalence rates. American Journal of Public Health 86(5): 706-711. doi:10.2105/AJPH.86.5.706.
Majer, I.M., Nusselder, W.J., Mackenbach, J.P., and Kunst, A.E. (2010). Socioeconomic inequalities in life and health expectancies around official retirement age in 10 Western-European countries. Journal of Epidemiology and
Community Health. doi:10.1136/jech.2010.111492.
Manton, K. (1982). Changing concepts of morbidity and mortality in the elderly population. The Milbank Memorial Fundation Quarterly / Health and Society
60: 83-244.
Marmot, M.G., Friel, S., Bell, R., Houweling, T.A.J., Taylor, S., and on behalf of the Commission on Social Determinants of Health (2008). Closing the gap in a generation: Health equity through action on the social determinants of health.
The Lancet 9650 (372): 1661-1669. doi:10.1016/S0140-6736(08)61690-6.
Matthews, F.E., Jagger, C., Miller, L.L., and Brayne, C. (2009). Education differences in life expectancy with cognitive impairment. Journal of Gerontology A 64(1): 125-131. doi:10.1093/gerona/gln003.
Matthews, R.J., Jagger, C., and Hancock, R.M. (2006). Does socio-economic advantage lead to a longer, healthier old age? Social Science & Medicine 62(10): 2489-2499. doi:10.1016/j.socscimed.2005.11.019.
McDonough, P. (2000). Job insecurity and health. International Journal of Health
Service 30(3): 453-476. doi:10.2190/BPFG-X3ME-LHTA-6RPV.
Mejer, L. and Rober-Bobée, I. (2003). Mortalité des femmes et environnement familial: Rôle protecteur de la vie de famille. INSEE Première (8952): 1-4.
Melchior, M., Goldberg, M., Krieger, N., Kawachi, I., Menvielle, G., Zins, M., and Berkman, L.F. (2005). Occupational class, occupational mobility and cancer incidence among middle-aged men and women: A prospective study of the French GAZEL cohort*. Cancer Causes Control 16(5): 515-24. doi:10.1007/
s10552-004-7116-0.
Findings from the GAZEL cohort study. American Journal of Public Health
95(7): 1206-1212. doi:10.2105/AJPH.2004.048835.
Melzer, D., McWilliams, B., Brayne, C., Johnson, T., and Bond, J. (2000). Socioeconomic status and the expectation of disability in old age: Estimates for England. Journal of Epidemiology and Community Health 54(4): 286-292. doi:10.1136/jech.54.4.286.
Menvielle, G., Luce, D., Fevotte, J., Bugel, I., Salomon, C., Goldberg, P., Billon-Galland, M.A., and Goldberg, M. (2003). Occupational exposures and lung cancer in New Caledonia. Occupational and Environmental Medicine 60(8): 584-589. doi:10.1136/oem.60.8.584.
Minicuci, N. and Noale, M. (2005). Influence of level of education on disability free life expectancy by sex: The ILSA study. Experimental Gerontology 40(12): 997-1003. doi:10.1016/j.exger.2005.08.011.
Mormiche, P. and Boissonnat, V. (2003). Handicap et inégalités sociales: Premiers apports de l'enquête HID. Revue Française des Affaires Sociales 57(1/2): 267-286.
Nagi, S.Z. (1965). Some conceptual issues in disability and rehabilitation. In: Sussman, M.B. (ed.). Sociology and rehabilitation. Washington: American Sociological Association: 100-113.
Nusselder, W.J., Looman, C.W., Mackenbach, J.P., Huisman, M., Van Oyen, H., Deboosere, P., Gadeyne, S., and Kunst, A.E. (2005). The contribution of specific diseases to educational disparities in disability-free life expectancy. Americna
Journal of Public Health 95(11): 2035-2041. doi:10.2105/AJPH.2004.054700.
Pérès, K., Jagger, C., Lièvre, A., and Barberger-Gateau, P. (2005). Disability-free life expectancy of older French people: Gender and education differentials from the
PAQUID cohort. European Journal of Ageing 2(3): 225-233.
doi:10.1007/s10433-005-0006-9.
Pérès, K., Jagger, C., and Matthews, F.E. (2008). Impact of late-life self-reported emotional problems on disability-free life expectancy: Results from the MRC Cognitive Function and Ageing Study. International Journal of Geriatric
Psychiatry 23(6): 643-649. doi:10.1002/gps.1955.
Robine, J.-M., Romieu, I., and Michel, J.P. (2003). Trends in health expectancies. In: Robine, J.-M., Jagger, C., Mathers, C., Crimmins, E.M., and Suzman, R. (eds.).
Determining health expectancies. Chichester: John Wiley & Sons, Ltd: 75-101.
Rodgers, W. and Miller, B. (1997). A comparative analysis of ADL questions in surveys of older people. Journal of Gerontology 52B(Special Issue): 21-36.
doi:10.1093/geronb/52B.Special_Issue.21.
Rogers, A., Rogers, R.G., and Branch, L.G. (1989). A multistate analysis of active life expectancy. Public Health Reports 104(3): 222-225.
Salavecz, G., Chandola, T., Pikhart, H., Dragano, N., Siegrist, J., Jockel, K.H., Erbel, R., Pajak, A., Malyutina, S., Kubinova, R., Marmot, M., Bobak, M., and Kopp, M. (2010). Work stress and health in Western European and post-communist countries: An East-West comparison study. Journal of Epidemiology and
Community Health 64(1): 57-62. doi:10.1136/jech.2008.075978.
Siegrist, J. (1996). Adverse health effects of high effort low reward conditions. Journal
of Occupational Health Psychology 1(1): 27-41. doi:10.1037/1076-8998.1.1.27.
Sirven, N. and Debrand, T. (2008). Social participation and healthy ageing: An international comparison using SHARE data. Social Science & Medicine 67(12): 2017-2026. doi:10.1016/j.socscimed.2008.09.056.
Smith, L.A., Branch, L.G., Scheer, P.A., Wetle, T., Evans, D.E., Hebert, L., and Taylor, J.O. (1990). Short-term variability of measures of physical function in older people. Journal of American Geriatrics Society 38(9): 993-998.
Sullivan, D.F. (1971). A single index of mortality and morbidity. HSMHA Health
Reports 86(4): 347-354. doi:10.2307/4594169.
Tubeuf, S., Jusot, F., Devaux, M., and Sermet, C. (2008). Social heterogeneity in self-reported health status and measurement of inequalities in health. Paris: Irdes (12).
Van Oyen, H., Bossuyt, N., Deboosere, P., Gadeyne, S., Abatih, E., and Demarest, S.S. (2005). Differential inequity in health expectancy by region in Belgium. Sozial-
und Präventivmedizin 50(5): 301-310.
Verbrugge, L.M., Rennert, C., and Madans, J.H. (1997). The great efficacy of personal and equipment assistance in reducing disability. American Journal of Public
Health 87(3): 384-392. doi:10.2105/AJPH.87.3.384.
Verbrugge, L.M. and Jette, A.M. (1994). The disablement process. Social Science &
von dem Knesebeck, O., Dragano, N., and Siegrist, J. (2005). Social capital and self-rated health in 21 European countries. Psychosocial Medicine 2.
Westerlund, H., Kivimaki, M., Singh-Manoux, A., Melchior, M., Ferrie, J.E., Pentti, J., Jokela, M., Leineweber, C., Goldberg, M., Zins, M., and Vahtera, J. (2009). Self-rated health before and after retirement in France (GAZEL): A cohort study.
The Lancet 374(9705): 1889-1896. doi:10.1016/S0140-6736(09)61570-1.
Wood, P.H.N. and Badley, E.M. (1978). An epidemiological appraisal of disablement. In: Bennett, A.E. (ed.). Recent Advances in Community Medicine. Edinburgh: Churchill Livingstone: 149-173.
World Health Organization (1946). Constitution of the World Health Organisation. Department of State Bulletin.