DEMOGRAPHIC RESEARCH
VOLUME 28, ARTICLE 40, PAGES 1167-1198
PUBLISHED 6 JUNE 2013
http://www.demographic-research.org/Volumes/Vol28/40/ DOI: 10.4054/DemRes.2013.28.40
Research Article
Does the orphan disadvantage “spill over”?
An analysis of whether living in an area with a
higher concentration of orphans is associated
with children’s school enrollment in
sub-Saharan Africa
Emily Smith-Greenaway
Jessica Heckert
© 2013 Emily Smith-Greenaway & Jessica Heckert.
This open-access work is published under the terms of the Creative Commons Attribution NonCommercial License 2.0 Germany, which permits use, reproduction & distribution in any medium for non-commercial purposes, provided the original author(s) and source are given credit.
1 Introduction 1168
2 Concentration of orphans and children’s school enrollment 1169 2.1 Support for a negative association between the concentration of
orphans and children’s school enrollment
1169
2.2 Support for a positive association between the concentration of orphans and children’s school enrollment
1171
2.3 Support for a curvilinear association between the concentration of orphans and children’s school enrollment
1171
3 Data and methods 1172
3.1 Data 1172
3.2 Measures 1173
3.2.1 School enrollment 1173
3.2.2 Concentration of orphans 1174
3.2.3 Controls 1174
4 Analytic strategy 1175
5 Results 1176
6 Summary and conclusions 1185
7 Acknowledgements 1187
References 1189
Does the orphan disadvantage “spill over”? An analysis of whether
living in an area with a higher concentration of orphans is associated
with children’s school enrollment in sub-Saharan Africa
Emily Smith-Greenaway1
Jessica Heckert2
Abstract
BACKGROUND
Despite considerable concern regarding the social consequences of sub-Saharan Africa’s high orphan prevalence, there has been no research investigating how living in a community densely populated with orphans is more broadly associated with children’s — including nonorphans’ — acquisition of human capital.
OBJECTIVE
We provide a new look at the implications of widespread orphanhood in sub-Saharan Africa by examining whether living in an area with a high concentration of orphans is associated with children’s likelihood of school enrollment.
METHODS
We use data from the Demographic and Health Survey (DHS) and the Multiple Indicators Cluster Survey (MICS) among 383,010 children in 336 provinces in 34 sub-Saharan African countries to estimate multilevel logistic regression models to assess whether living in a setting with a higher concentration of orphans is associated with school enrollment.
RESULTS
Orphan concentration has a curvilinear association with children’s school enrollment in western and eastern Africa: The initially positive association becomes negative at higher levels. In central and southern Africa, orphan concentration has a positive linear association with children’s school enrollment.
1Department of Sociology. The Pennsylvania State University, 211 Oswald Tower, University Park PA
16801. E-mail: [email protected].
CONCLUSION
In western and eastern Africa, the negative association between living in a setting more densely populated with orphans and children’s school enrollment provides suggestive evidence that the orphan disadvantage “spills over” in those communities most heavily affected. Conversely, in central and southern Africa, the positive association between living in a setting more densely populated with orphans and children’s school enrollment highlights the resiliency of these relatively wealthier communities with high levels of orphans. Although longitudinal research is needed to confirm these findings and clarify the underlying mechanisms, this study lays the groundwork for a new body of research aimed at understanding the broader social implications of widespread orphanhood in sub-Saharan Africa.
1. Introduction
Sub-Saharan Africa has the highest percentage of orphaned children (12% of the child population) of any world region (The United Nations Children’s Fund 2006). An estimated 53 million children in sub-Saharan Africa are orphaned, largely as a result of the high levels of AIDS-related mortality in the region (The United Nations Children’s Fund 2006). Policy makers project that the number of orphans in sub-Saharan Africa will continue to increase exponentially.
Despite the high number of orphans in sub-Saharan Africa, Western-style orphanages and child-headed households remain uncommon in the region. In fact, most orphaned children join existing households (Urassa, Boerma, Ng'weshemi, Isingo, Schapink, and Kumogola 1997), and fewer than 5% live in orphanages or in child-headed households (Beard 2005; Monasch and Boerma 2004). The growing burden of orphans has led many researchers to question whether African communities and kinship networks can adequately care for orphans. Some researchers warn that the high prevalence of orphans may erode African societies (Caldwell 1997). Foster and Germann (2002) have argued that the extended family does not have the endless capacity to absorb orphans, and that households and communities may cease to be viable social or economic units as a result of the growing burden (Foster et al.1996).
in areas highly populated with orphans. To extend the current literature on orphanhood in sub-Saharan Africa, and to contribute to the conversation about the resiliency of African families and communities in coping with high levels of orphans, this paper investigates whether living in an area with a higher concentration of orphans is associated with children’s — including nonorphans’ — education.
Building on evidence that the concentration of orphans varies within African countries (Weinreb, Gerland, and Fleming 2008), we test whether the province level concentration of orphans is positively, negatively, or curvilinearly associated with children’s school enrollment. We use Demographic and Health Surveys (DHS) and Multiple Indicator Cluster Surveys (MICS) data to estimate a series of multilevel logistic regression models for 383,010 children (7–14 years old) living in 336 subnational provinces in 34 sub-Saharan African countries. Although longitudinal research is needed to confirm the robustness of the relationships established here, this study provides valuable insight into whether the high prevalence of orphans is associated with nonorphaned children’s well-being.
2. Concentration of orphans and children’s school enrollment
2.1 Support for a negative association between the concentration of orphans and children’s school enrollment
In addition to the concentration of orphans being associated with children’s school enrollment as a result of its relationship with socioeconomic disadvantage, the concentration of orphans may be negatively associated with children’s school enrollment through its association with a high prevalence of HIV/AIDS (Bicego, Rutstein, and Johnson 2003). Because the concentration of orphans is highly correlated with the severity of the HIV/AIDS epidemic (Bicego, Rutstein, and Johnson 2003), children — including nonorphans — in areas with a higher concentration of orphans may be more likely to rely on caregivers who are living with HIV/AIDS. Extending evidence that households coping with AIDS strategically increase the quantity of child labor to offset the strain associated with the illness (Rugalema 2000), the greater burden of domestic responsibilities and labor force participation among children in highly affected areas will likely lower their ability to become, or remain, enrolled in formal school. From this perspective, children living in areas with more orphans and more adults living with HIV/AIDS will be less likely to be enrolled in school.
In addition to the greater burden of HIV/AIDS, settings with a higher concentration of orphans may have higher prime-aged adult mortality and, as a result, these settings may have fewer economically active adults in the community. The smaller adult population will likely elevate pressure on the relative population structure, thereby exacerbating the already high dependency ratio in African communities (Eastwood and Lipton 2011). Furthermore, AIDS deaths are common among highly educated and economically active persons, which deprives communities of not only adults in general but, specifically, of economically productive ones (Ntozi and Mukiza-Gapere 1995). Living in an area with a larger cohort of children relative to the adult population is likely to intensify the competition for scarce social and economic resources. From this perspective, the unfavorable dependency ratios in settings highly populated with orphans will exacerbate poverty and, thus, pose considerable barriers to children’s school enrollment.
2.2 Support for a positive association between the concentration of orphans and children’s school enrollment
It is also possible that the concentration of orphans is positively associated with children’s school enrollment. Such an association could work through two mechanisms: greater access to socioeconomic resources and organizational benefits. Emerging evidence suggests that, in Malawi, communities more densely populated with orphans are wealthier than communities with fewer orphans (Weinreb, Gerland, and Fleming 2008). This implies that families are strategically placing orphans in the most resource-rich communities. The strategic placement of orphans into relatively wealthier settings suggests that children living in communities with higher concentrations of orphans may enjoy a greater likelihood of school enrollment, simply as a function of these settings being socioeconomically, and potentially educationally, more advantaged than those where few orphans reside.
In addition to high orphan communities being wealthier, there is evidence that children in these settings benefit from development projects. Communities with high levels of orphaned children often mobilize the support of local organizations, such as religious congregations, women’s groups, and national and international governmental and nongovernmental organizations (Foster et al. 1996). Community-based organizations (Bahemuka 1983; Kayongo and Onyango 1991; Suda 1997), alongside international programs, effectively provide economic, social, and educational support to orphaned children (Copson 2000; Hunter and Williamson 2000; Reid 1993). Although these programs specifically target orphans, nonorphaned children often benefit. For instance, research shows that nonorphans benefit from community-based orphan programs including childcare centers in Malawi (Beard 2005) and household assistance programs in Tanzania (Ainsworth, Beegle, and Koda 2005). The mobilization of resources to support orphans, which often benefits children more broadly, further promotes a positive association between the concentration of orphans and children’s school enrollment.
2.3 Support for a curvilinear association between the concentration of orphans and children’s school enrollment
fostering documents a “tipping point” at which the intensity of the HIV epidemic (and thus intensity of orphan care) is negatively associated with the likelihood of families fostering nonorphaned children (Grant and Yeatman 2012). In other words, this evidence suggests that the orphan burden is reducing African families’ capacity to care for nonorphaned children, but only in settings most heavily affected by the high orphan population. Extrapolating this finding, it is possible that there is also a “tipping point” at which the need to care for orphaned children will be negatively associated with children’s education more broadly, as evidenced by a curvilinear association.
3. Data and methods
3.1 Data
To document the association between the concentration of orphans and children’s school enrollment, we leverage DHS and MICS data that were collected in 34 sub-Saharan African countries between 2000 and 2010.3 The two surveys use nearly identical multistage stratified random sample designs to select households for participation. The DHS and MICS identify primary sampling units (PSUs) based on sampling frames generated by national statistics offices and then randomly select PSUs with a probability proportional to their population size. Within each PSU, the DHS and MICS randomly select households.4
We restrict our analytic sample in three ways. First, we exclude children in the de facto sample (i.e., individuals who slept in the house the previous night) and include children only from the de jure samples (i.e., usual residents). This restriction allows us to harmonize the data across multiple countries and to ensure that we accurately attribute household characteristics to children who are household members.5 Second, because we are interested in assessing school enrollment, we restrict the sample to school aged children, who we define here as those aged 7 to 14 years.6 Third, we
3
Recent DHS and MICS data are not available for all sub-Saharan African countries. Notably, data are not available for South Africa, one of the most populated countries in sub-Saharan Africa. Furthermore, we exclude some countries (Mauritania, Equatorial Guinea, Burundi, Sudan (North), Angola, and Comoros) from our analyses due to a large percentage of missing data on key study variables.
4 Detailed survey information is available in the survey documentation reports for each country. These are
available at http://www.measuredhs.com/ and http://www.childinfo.org/mics.html.
5 With a few exceptions, the DHS collects a de facto sample and MICS collects a de jure sample.
6 We focus on children who are at least 7 years old to ensure cross-national comparability, as this is a standard
exclude less than 2% of children from the sample who have incomplete information on study variables. This results in a final analytic sample of 383,010 children.
Our contextual unit of focus is subnational provinces. What constitutes a “province” varies across countries. In some instances, these subnational boundaries represent political districts, but in other instances they represent administrative or geographical regions. For ease of interpretation, we uniformly refer to these aggregate units as “provinces”. See Appendix A for a complete listing of the aggregate units that we utilize by region of sub-Saharan Africa and country.
In light of evidence that the concentration of orphaned children and the implications of orphanhood vary across regions of sub-Saharan Africa (Bicego, Rutstein, and Johnson 2003), we conduct all analyses separately by region. Our four analytic subsamples include (1) 184,541 children in 125 provinces in 15 western African countries, (2) 64,302 children in 84 provinces in 6 eastern African countries, (3) 41,102 children in 45 provinces in 5 central African countries, and (4) 93,065 children in 82 provinces in 8 southern African countries. See Appendix B for further information on the countries included in the study.
3.2 Measures
3.2.1 School enrollment
Current school enrollment is the dependent variable. Interviewers ask the primary household respondent whether each child is currently enrolled in school or, in the case of school not being in session, whether each child was enrolled at the end of the most recent school year. Because we rely on cross-sectional data, we focus on current school enrollment as opposed to educational attainment, as the latter depends more heavily on a child’s full school history and investments that occurred before the time of the survey. A limitation of our focus on current school enrollment is that we do not capture the frequency with which a child actually attends school. School absenteeism remains a key educational challenge in low-income contexts, which we do not capture in this study.
3.2.2 Concentration of orphans
To examine the association between the concentration of orphans and children’s school enrollment, we calculate what percentage of children (aged 0–17 years) in each province are single or double orphans. To construct this measure, we first use the primary household respondent’s report of whether each child’s biological mother and father are alive at the time of the survey. We then aggregate this information at the province level to calculate the percentage of children who are orphaned by either one or both of their parents.7 It is important to note that, because our data are household-based, this aggregate construct reflects only the percentage of children orphaned in the household population of each province and does not capture the approximately 5% of orphaned children who do not live in households (Beard 2005; Monasch and Boerma 2004).
3.2.3 Controls
We account for child and household characteristics that may confound the association between the concentration of orphans and children’s school enrollment. Child characteristics include family structure (two-parent family [reference group], single-parent family, single orphan, foster child [child living apart from one or both of his or her living parents], or double orphan)8, gender, and age (7–14 years old).
At the household level, we control for socioeconomic status using the DHS- and MICS-constructed wealth indices. The wealth index has two important limitations. First, although the DHS and MICS wealth indices are ideal for comparing socioeconomic status within countries, they are less meaningful in a multicountry framework. For instance, a household that is in the top wealth quintile in Nigeria is likely to be much wealthier than a household that is in the top wealth quintile in Guinea-Bissau. Although a wealth quintile that is comparable across countries is ideal for multinational research, such an index is difficult to calculate, as the components are based on household items and materials that are incomparable across country contexts. The wealth index is better equipped to compare household socioeconomic status within countries,9 and because our country-level fixed effects approach (described in more
7 In supplementary analyses, we focused on the prevalence of children who were orphaned between age 7 and
14 years to assess whether the associations shown here are replicated when investigating the concentration of orphaned children among the focal age group (i.e., 7 to 14-year-olds). Results from the supplementary models (available upon request) are statistically consistent with those shown here.
8 All children in ‘two-parent families’ and ‘single parent families’ are non-orphans. 9
detail below) generates within-country estimates, the wealth index captures important within-country differences between households. Second, even within countries, the wealth index captures economic differences only in terms of dwelling characteristics and asset ownership, not heterogeneity in access to social services or cash. In light of these limitations, the results must be interpreted with caution.
In addition to the household wealth index, we control for the household’s location in a rural versus urban area and the household head’s educational attainment (i.e., no school, primary, or secondary), gender, and age. We also account for household structure by controlling for the total number of household members, the number of members aged 14 and younger, the number of members older than 64 years, and the child’s relationship to the household head (i.e., biological child [reference group], grandchild, relative, sibling, spouse, self, nonrelative). Furthermore, because we leverage surveys collected across an 11-year period (2000–2010) and because children’s likelihood of school enrollment has increased over time in sub-Saharan Africa, we control for survey year to account for the confounding nature of the date of data collection.
In addition to controlling for child and household characteristics, in order to evaluate whether the observed associations between the concentration of orphans and children’s school enrollment is due to the selection of orphans into communities with particular socioeconomic profiles, we create a series of aggregate-level controls that characterize the 336 provinces in our sample. More specifically, we aggregate information from the household level to the province level to control for (1) the percentage of household heads that have no formal education, (2) the percentage of households that are headed by women, and (3) the average household size in each province.
4. Analytic strategy
We begin our analyses by demonstrating the high variability in the concentration of orphans across the 336 provinces in our sample. These analyses further motivate our focus on explaining the educational implications of variation in the orphan population at the province level. Next, we provide descriptive statistics to highlight the characteristics of the children, households, and provinces in our sample. Finally, to evaluate the association between the concentration of orphans and children’s school enrollment, we estimate a series of multilevel logistic regression models for the odds of 𝑃𝑖𝑗 that child i
Model 1
log�𝑃𝑖𝑗⁄�1− 𝑃𝑖𝑗��=𝑏0+𝑏1𝑆𝑗+𝑏2𝑋𝑖𝑗+𝑏3𝐶𝑗+𝑈𝑗
𝑆𝑗is an indicator for the province level concentration of orphans; 𝑋𝑖𝑗 is a vector of controls for child and household characteristics. 𝐶𝑗 represents country dummies, which allow us to control for unobserved country-level characteristics. 𝑈𝑗 is the level-2 error term, which we allow to vary by province; it reflects the unobserved province level characteristics that are unrelated to the other regressors in the model.
Model 2
log�𝑃𝑖𝑗⁄�1− 𝑃𝑖𝑗��=𝑏0+𝑏1𝑆𝑗+𝑏2𝑆𝑗2+𝑏3𝑿𝑖𝑗+𝑏4𝐶𝑗+𝑈𝑗
Model 2 extends Model 1 by including a squared term of the province level concentration of orphans to determine if there is a curvilinear association between the province level concentration of orphans and children’s school enrollment.
Model 3
log�𝑃𝑖𝑗⁄�1− 𝑃𝑖𝑗��=𝑏0+𝑏1𝑆𝑗+𝑏2𝑆𝑗2+𝑏3𝑿𝑖𝑗+𝑏4𝒀𝑗+𝑏5𝐶𝑗+𝑈𝑗
Model 3 adds 𝒀𝑗, which is a vector of controls for province level characteristics used to determine whether the observed associations are explained by socioeconomic factors.10
5. Results
Figure 1 displays the mean and the distribution of the percentage of the child population that is orphaned in each province within the 34 countries in our sample. As shown, there is considerable variation in the distribution of the orphan population across provinces within each country, particularly in those countries with an overall high concentration of orphans. Beginning with western Africa, the results reveal considerable within-country variability in the concentration of orphans, particularly in Guinea-Bissau, where it ranges from as low as 7% of children orphaned in one province
10 Based on the evidence that the association between the province level concentration of orphans and
Figure 1: The provincial concentration of orphans by country and region of sub-Saharan Africa
Table 1 displays the characteristics of children in western, eastern, central, and southern Africa (estimates are weighted). As shown, the percentage of children enrolled in school varies considerably across the four regions of sub-Saharan Africa. In each region the majority of children (7–14 years old) are enrolled in school; however, enrollment ranges from as low as 63.01% of children in western Africa to as high as 87.78% of children in southern Africa. The descriptive results further show that the characteristics of the provinces vary across regions of sub-Saharan Africa. Whereas 59.88% of household heads lack formal education in the average province in western Africa, this is true for merely 20.46% of household heads in the average province in southern Africa. The concentration of female-headed households also varies from as little as 16.01% in the average province in western Africa to as much as 30.43% in the average province in southern Africa.
0 5 10 15 20 25 30 35 40 Percent Children Orphaned by Province Togo
Sierra LeoneSenegal STP NigeriaNiger Mali Liberia Guinea BissauGuinea Ghana Gambia Cote D'Ivoire Burkina FasoBenin
Western
0 5 10 15 20 25 30 35 40 Percent Children Orphaned by Province Gabon DRC Congo Chad CAR Central
0 5 10 15 20 25 30 35 40 Percent Children Orphaned by Province Uganda Tanzania Somalia Rwanda Kenya Ethiopia Eastern
Table 1: Descriptive statistics for children age 7-14, by region of sub-Saharan Africa
Western1 Eastern2 Central3 Southern4
Currently enrolled (% children 7-14 years old) 63.01 70.27 72.31 87.78
Level 2 - Province
Children orphaned by province (%) 8.14 (3.04) 13.45 (5.43) 10.16 (3.07) 16.89 (7.92)
Household head has no formal education (%) 59.88 (23.31) 37.93 (22.44) 25.97 (20.86) 20.46 (11.46)
Female headed household (%) 16.01 (9.37) 23.87 (7.80) 19.27 (5.06) 30.43 (12.48)
Mean household size 8.84 (2.69) 6.65 (0.74) 7.67 (1.04) 6.36 (0.68)
Level 1 - Individual
Family structure Resides with both parents5
48.15 50.68 42.39 46.73
Single parent 15.42 14.49 20.15 18.08
Single orphan 5.08 9.58 5.85 8.82
Foster child 30.36 22.31 29.82 22.34
Double orphans 0.99 2.94 1.79 4.03
Female 49.37 49.52 49.43 49.95
Age 10.27 (2.31) 10.34 (2.29) 10.32 (2.31) 10.41 (2.29)
Relationship to household head
Parent5 73.25 77.26 70.25 65.39
Grandparent 9.86 10.91 11.78 19.45
Relative 8.02 6.49 9.49 8.18
Sibling 2.42 1.88 2.86 2.23
Spouse 0.30 0.09 0.18 0.28
Child head 0.01 0.03 0.01 0.07
Non-relative 6.14 3.34 5.43 4.40
Education of household head No formal education5
60.84 39.96 26.38 21.37
Primary 18.66 45.09 32.31 53.51
Secondary 20.50 14.95 41.31 25.12
Female headed household 16.77 26.38 20.15 31.93
Age of household head 49.05 (13.06) 45.99 (12.76) 45.36 (12.07) 46.48 (14.14)
Household wealth 2.85 (1.39) 2.94 (1.45) 3.01 (1.44) 2.87 (1.41)
Household size 9.08 (5.18) 6.85 (2.61) 7.88 (3.78) 6.48 (2.65)
Total # household members under age 15 5.02 (3.56) 3.91 (1.89) 4.41 (2.39) 3.67 (1.81)
Total # household members over 64 0.25 (0.53) 0.15 (0.40) 0.15 (0.42) 0.18 (0.45)
Rural household 62.79 80.56 52.00 79.24
Sources: DHS & MICS.
Note: All values are weighted, and values in parentheses are standard deviations.
1
N=184,541 children in 125 provinces in 15 countries.
2
N=64,302 children in 84 provinces in 6 countries.
3
N=41,102 children in 45 provinces in 5 countries.
4
N=93,065 children in 82 provinces in 8 countries.
5
Reference group.
male, and are an average of 45 to 50 years old. In general, children live in large households with several young household members in rural areas.
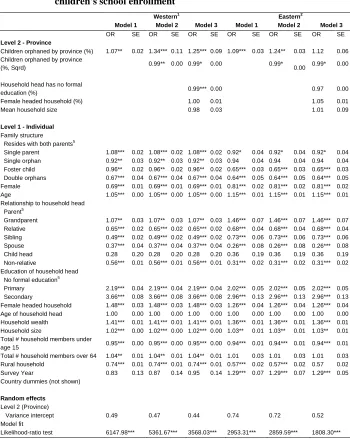
Turning to the multivariate findings, the results in Table 2 (expressed as odds ratios) address our central question of whether the concentration of orphans is associated with children’s school enrollment and, if so, whether the association is positive, negative, or curvilinear. The results show that there are indeed significant associations between the concentration of orphans and children’s school enrollment, and that the nature of the association varies markedly across the four regions. Beginning with the findings from western Africa, Model 1 shows that there is a positive association between the concentration of orphans and children’s school enrollment. That is, each percentage increase in orphans at the province level is associated with a 7% increase in the likelihood that a child is enrolled in school, net of their own orphan status, living arrangements, and sociodemographic controls. Model 2 includes the squared term for the concentration of orphans to test whether there is evidence of a curvilinear association. As shown, the results demonstrate that there is a significant curvilinear association between the concentration of orphans and children’s school enrollment. Although the concentration of orphans is initially positively associated with children’s school enrollment, there is a tipping point. In the western African communities most heavily populated with orphans, children — including nonorphans — experience a lower likelihood of school enrollment.
Model 3 includes the socioeconomic characteristics of the provinces to determine if these factors help to explain the curvilinear association between the concentration of orphans and children’s school enrollment. Although the reduction in the variability across provinces (from 0.47 in Model 2 to 0.44 in Model 3) demonstrates that the inclusion of these characteristics helps to explain differences in school enrollment between provinces, these characteristics do not attenuate the association between the concentration of orphans and children’s school enrollment. The provincial socioeconomic characteristics are independently associated with children’s school enrollment as expected; however, there continues to be a strong curvilinear association between the concentration of orphans and children’s school enrollment.
Table 2: Results of multilevel logistic regression models estimating the association between the contextual prevalence of orphans and children's school enrollment
Western1 Eastern2
Model 1 Model 2 Model 3 Model 1 Model 2 Model 3
OR SE OR SE OR SE OR SE OR SE OR SE
Level 2 - Province
Children orphaned by province (%) 1.07** 0.02 1.34*** 0.11 1.25*** 0.09 1.09*** 0.03 1.24** 0.03 1.12 0.06 Children orphaned by province
(%, Sqrd) 0.99** 0.00 0.99* 0.00 0.99* 0.00 0.99* 0.00
Household head has no formal
education (%) 0.99*** 0.00 0.97 0.00
Female headed household (%) 1.00 0.01 1.05 0.01
Mean household size 0.98 0.03 1.01 0.09
Level 1 - Individual
Family structure Resides with both parents5
Single parent 1.08*** 0.02 1.08*** 0.02 1.08*** 0.02 0.92* 0.04 0.92* 0.04 0.92* 0.04
Single orphan 0.92** 0.03 0.92** 0.03 0.92** 0.03 0.94 0.04 0.94 0.04 0.94 0.04
Foster child 0.96** 0.02 0.96** 0.02 0.96** 0.02 0.65*** 0.03 0.65*** 0.03 0.65*** 0.03
Double orphans 0.67*** 0.04 0.67*** 0.04 0.67*** 0.04 0.64*** 0.05 0.64*** 0.05 0.64*** 0.05
Female 0.69*** 0.01 0.69*** 0.01 0.69*** 0.01 0.81*** 0.02 0.81*** 0.02 0.81*** 0.02
Age 1.05*** 0.00 1.05*** 0.00 1.05*** 0.00 1.15*** 0.01 1.15*** 0.01 1.15*** 0.01
Relationship to household head Parent5
Grandparent 1.07** 0.03 1.07** 0.03 1.07** 0.03 1.46*** 0.07 1.46*** 0.07 1.46*** 0.07
Relative 0.65*** 0.02 0.65*** 0.02 0.65*** 0.02 0.68*** 0.04 0.68*** 0.04 0.68*** 0.04
Sibling 0.49*** 0.02 0.49*** 0.02 0.49*** 0.02 0.73*** 0.06 0.73*** 0.06 0.73*** 0.06
Spouse 0.37*** 0.04 0.37*** 0.04 0.37*** 0.04 0.26*** 0.08 0.26*** 0.08 0.26*** 0.08
Child head 0.28 0.20 0.28 0.20 0.28 0.20 0.36 0.19 0.36 0.19 0.36 0.19
Non-relative 0.56*** 0.01 0.56*** 0.01 0.56*** 0.01 0.31*** 0.02 0.31*** 0.02 0.31*** 0.02
Education of household head No formal education5
Primary 2.19*** 0.04 2.19*** 0.04 2.19*** 0.04 2.02*** 0.05 2.02*** 0.05 2.02*** 0.05
Secondary 3.66*** 0.08 3.66*** 0.08 3.66*** 0.08 2.96*** 0.13 2.96*** 0.13 2.96*** 0.13
Female headed household 1.48*** 0.03 1.48*** 0.03 1.48*** 0.03 1.26*** 0.04 1.26*** 0.04 1.26*** 0.04
Age of household head 1.00 0.00 1.00 0.00 1.00 0.00 1.00 0.00 1.00 0.00 1.00 0.00
Household wealth 1.41*** 0.01 1.41*** 0.01 1.41*** 0.01 1.36*** 0.01 1.36*** 0.01 1.36*** 0.01
Household size 1.02*** 0.00 1.02*** 0.00 1.02*** 0.00 1.03** 0.01 1.03** 0.01 1.03** 0.01
Total # household members under
age 15 0.95*** 0.00 0.95*** 0.00 0.95*** 0.00 0.94*** 0.01 0.94*** 0.01 0.94*** 0.01
Total # household members over 64 1.04** 0.01 1.04** 0.01 1.04** 0.01 1.01 0.03 1.01 0.03 1.01 0.03
Rural household 0.74*** 0.01 0.74*** 0.01 0.74*** 0.01 0.57*** 0.02 0.57*** 0.02 0.57 0.02
Survey Year 0.83 0.13 0.87 0.14 0.95 0.14 1.29*** 0.07 1.29*** 0.07 1.29*** 0.05
Country dummies (not shown)
Random effects
Level 2 (Province)
Variance intercept 0.49 0.47 0.44 0.74 0.72 0.52
Model fit
Table 2: (Continued)
Central3 Southern4
Model 1 Model 2 Model 3 Model 1 Model 2 Model 3
Level 2 - Province
Children orphaned by
province (%) 1.08** 0.03 1.31* 0.14 1.05 0.03 1.06*** 0.01 1.12** 0.04 1.04** 0.01
Children orphaned by
province (%, Sqrd) 0.99 0.01 1.00 0.00
Household head has no
formal education (%) 0.98** 0.01 0.98*** 0.00
Female headed household
(%) 1.00 0.01 1.02** 0.01
Mean household size 0.99 0.09 1.10 0.11
Level 1 - Individual
Family structure Resides with both parents5
Single parent 0.89** 0.04 0.89** 0.04 0.89** 0.04 0.73*** 0.03 0.73*** 0.03 0.73*** 0.03
Single orphan 0.73*** 0.04 0.73*** 0.04 0.73*** 0.04 0.75*** 0.04 0.75*** 0.04 0.75*** 0.04
Foster child 0.95 0.04 0.95 0.04 0.95 0.04 0.46*** 0.03 0.46*** 0.03 0.46*** 0.03
Double orphans 0.69*** 0.07 0.69*** 0.07 0.69*** 0.07 0.48*** 0.04 0.48*** 0.04 0.48*** 0.04
Female 0.61*** 0.02 0.61*** 0.02 0.61*** 0.02 1.19*** 0.03 1.19*** 0.03 1.19*** 0.03
Age 1.10*** 0.01 1.10*** 0.01 1.10*** 0.01 1.03*** 0.00 1.03*** 0.00 1.03*** 0.00
Relationship to household head
Parent5
Grandparent 1.08 0.06 1.08 0.06 1.08 0.06 1.84*** 0.11 1.84*** 0.11 1.84*** 0.11
Relative 0.60*** 0.03 0.60*** 0.03 0.60*** 0.03 1.05 0.07 1.05 0.07 1.05 0.06
Sibling 0.66*** 0.05 0.66*** 0.05 0.66*** 0.05 1.15 0.10 1.15 0.10 1.15 0.10
Spouse 0.38*** 0.10 0.38*** 0.10 0.38*** 0.10 0.85 0.16 0.85 0.16 0.85 0.16
Child head 1.09 1.41 1.09 1.41 1.09 1.40 0.79 0.29 0.79 0.29 0.79 0.29
Non-relative 0.65*** 0.04 0.65*** 0.04 0.65*** 0.04 0.56*** 0.03 0.56*** 0.03 0.56*** 0.03
Education of household head No formal education5
Primary 1.86*** 0.07 1.86*** 0.07 1.86*** 0.07 1.83*** 0.05 1.83*** 0.05 1.83*** 0.05
Secondary 3.76*** 0.16 3.76*** 0.16 3.76*** 0.16 3.31*** 0.13 3.31*** 0.13 3.31*** 0.13
Female headed household 1.47*** 0.06 1.47*** 0.06 1.47*** 0.06 1.35*** 0.04 1.35*** 0.04 1.35*** 0.04
Age of household head 1.00 0.00 1.00 0.00 1.00 0.00 0.99** 0.00 0.99** 0.00 0.99** 0.00
Household wealth 1.44*** 0.02 1.44*** 0.02 1.44*** 0.02 1.37*** 0.02 1.37*** 0.02 1.37*** 0.02
Household size 1.03** 0.01 1.03** 0.01 1.03** 0.01 1.04*** 0.01 1.04*** 0.01 1.04*** 0.01
Total # household members
under age 15 0.96** 0.01 0.96** 0.01 0.96** 0.01 0.94*** 0.01 0.94*** 0.01 0.94*** 0.01
Total # household members
over 64 1.05 0.04 1.05 0.04 1.05 0.04 1.03 0.03 1.03 0.03 1.03 0.03
Rural household 0.79*** 0.03 0.79*** 0.03 0.79*** 0.03 0.84*** 0.03 0.84*** 0.03 0.85*** 0.03
Country dummies (not shown)
Table 2: (Continued)
Central3 Southern4
Model 1 Model 2 Model 3 Model 1 Model 2 Model 3
Random effects
Level 2 (Province)
Variance intercept 0.38 0.37 0.33 0.42 0.42 0.34
Model fit
Likelihood-ratio test 501.67*** 439.24*** 282.73*** 1016.45*** 562.28***
Sources: DHS & MICS.
Note: 1
N=184,541 children in 125 provinces in 15 countries.
2
N=64,302 children in 84 provinces in 6 countries.
3
N=41,102 children in 45 provinces in 5 countries.
4
N=93,065 children in 82 provinces in 8 countries.
5
Reference group.
* p < .05, ** p < .01, *** p < .001.
Model 3 extends Model 2 to determine whether the socioeconomic characteristics of the provinces help to explain the curvilinear association between the concentration of orphans and children’s school enrollment. Paralleling the findings for western Africa, Model 3 shows that the inclusion of province level characteristics does not help to explain the association between the concentration of orphans and children’s school enrollment in eastern Africa. Net of these factors, the concentration of orphans is independently associated with children’s school enrollment.
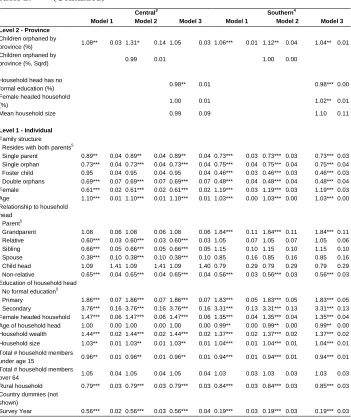
When shifting to the results for central and southern Africa, a different story emerges. Beginning with central Africa, Model 1 shows a strong positive association between the concentration of orphans and children’s school enrollment. Model 2 shows that, unlike in western and eastern Africa, there is no evidence of a curvilinear association between the concentration of orphans and children’s school enrollment. Instead, there is a positive linear association. Because Model 2 provides no evidence of a nonlinear association between the concentration of orphans and children’s school enrollment, we omit the squared term for the concentration of orphans from Model 3 and include province level socioeconomic characteristics to determine if these factors help account for the positive linear association shown in Model 1.11 The results show that including the province level socioeconomic characteristics reduces the association between the concentration of orphans and children’s school enrollment to nonsignificance. This demonstrates that central African provinces with a higher concentration of orphans are socioeconomically advantaged communities, which fully
explains why children in these settings have a greater likelihood of school enrollment.
11 In supplementary analyses, we included the squared term in Model 3 to test whether the nonlinear
The results in southern Africa are strikingly similar to the findings for central Africa. Model 1 demonstrates a strong positive association: each percentage increase in orphans is associated with a 6% increase in children’s likelihood of school enrollment. Model 2 extends Model 1 to determine whether the association is curvilinear. As shown, there is no evidence of a curvilinear relationship between the concentration of orphans and children’s likelihood of school enrollment. Similar to our approach for central Africa, because there is no evidence of a curvilinear association in Model 2, we omit the squared term for the concentration of orphans from Model 3.12 In Model 3 we include socioeconomic controls at the province level to determine whether these characteristics help account for the positive linear association in Model 1. The inclusion of the socioeconomic controls significantly reduces the size of the association by two-thirds. This finding suggests that, as in central Africa, living in a province with a higher concentration of orphans in southern Africa is positively associated with children’s school enrollment as a result of these settings being socioeconomically advantaged.
Because these analyses are based on the full sample of children, including orphans and nonorphans, the observed associations could be driven by the orphaned children in the sample. In other words, the concentration of orphans may be associated with the school enrollment only of children who are themselves orphaned. To analyze the robustness of our findings among the nonorphaned child population, we performed each set of analyses among the subsample of nonorphans (see Appendix C). As shown, the results are statistically similar to those for the full sample. That is, in western and eastern Africa, there is a negative association between the concentration of orphans and nonorphaned children’s school enrollment in the most heavily affected provinces. Conversely, in central and southern Africa, there is a positive linear association between the concentration of orphans and nonorphaned children’s school enrollment.
To summarize, the results demonstrate that the concentration of orphans varies considerably between subnational provinces in sub-Saharan Africa. Corroborating prior studies, the concentration of orphans is generally higher in eastern and southern Africa than in western and central Africa; however, there is striking variation in the prevalence of orphans across provinces both within these regions and within individual sub-Saharan African countries. Utilizing the variation in the concentration of orphans across subnational provinces, we demonstrate that living among a greater concentration of orphans is associated with children’s school enrollment and, therefore, their acquisition of human capital. Our findings show that in western and eastern Africa, the concentration of orphans and children’s (including nonorphans’) school enrollment are
12 We also performed supplementary analyses that included the squared term in Model 3 among the southern
negatively associated in settings with the highest levels of orphans. Conversely, in central and southern Africa, the concentration of orphans and children’s (including nonorphans’) school enrollment is positively associated, which is largely explained by these areas having more favorable socioeconomic profiles than provinces with fewer orphaned children.
6. Summary and conclusions
For decades scholars have concluded that the high concentration of orphans in sub-Saharan Africa is placing great strain on African communities (Caldwell 1997; Foster, Makufa, Drew, Mashumba, and Kambeu 1997). However, although considerable research highlights the negative implications of orphanhood for the affected children, it remains unknown whether the concentration of orphans interferes with other children’s well-being. To better understand the broader social implications of widespread orphanhood, we investigate, for the first time, how living among a higher concentration of orphans is associated with children’s education.
In line with the perspective that the concentration of orphans has negative social consequences, we find that in western and eastern Africa both orphaned and nonorphaned children in communities highly populated with orphans are less likely to be enrolled in school than their peers in communities less populated with orphans. That is, children in these settings are less likely either to ever enroll or to remain enrolled in school.
Conversely, although orphans themselves are educationally disadvantaged by their parental loss, we find no evidence in central and southern Africa that living in a setting more highly populated with orphans is negatively associated with children’s school enrollment. In fact, our results demonstrate that living in a central or southern African province with a higher concentration of orphans is positivelyassociated with children’s school enrollment due to these provinces’ more favorable socioeconomic profiles.
Before discussing the implications of these findings, we first highlight three notable study limitations. First, the study focuses on one dimension of children’s education: current school enrollment. Although school enrollment provides a useful snapshot of a child’s opportunity to acquire human capital, it reflects only one dimension of educational progress. Further research is needed to identify how the concentration of orphans is associated with additional aspects of children’s education (e.g., frequency of school attendance, academic performance, and educational attainment).
may influence the results, at the province level we only account for socioeconomic characteristics. These characteristics are insightful, as they help to explain between-province variance in school enrollment and the positive association between the concentration of orphans and children’s school enrollment in central and southern Africa. However, the measures do not capture important province level factors, such as educational policies or access to school resources, which may further explain the relationships shown here.
Third, and most notably, the study relies on cross-sectional data. The absence of longitudinal data prohibits us from gaining a causal understanding of the associations shown here. For instance, although we find that living in a setting with a greater concentration of orphans is associated with lower school enrollment in western and eastern Africa, it is unclear whether this is due to the orphan disadvantage spilling over or whether the association is a byproduct of these provinces being socioeconomically and educationally disadvantaged. Similarly, we find clear evidence that the positive association between the concentration of orphans and children’s school enrollment in central and southern Africa is driven by the fact that such areas are wealthier and relatively educationally advantaged: socioeconomic characteristics explain the entire
positive association in central Africa and two-thirds of it in southern Africa. Thus, although the need to understand whether the high prevalence of orphans is associated with educational disadvantage merits the careful analysis of cross-sectional data, future longitudinal studies that address the problem of time-ordering and selection are needed to better understand the nature of the associations.
donors have also generously supported efforts to assist “AIDS orphans.” Future research should consider the possibility that the differing circumstances driving the concentrated pockets of orphans across sub-Saharan Africa may result in distinct experiences for children in highly affected areas.
Although more sophisticated data are needed to gain a better understanding of the associations shown here, these findings are relevant to policies aimed at increasing children’s school enrollment in sub-Saharan Africa. First, the results demonstrate that there is a need for more resources in orphan-dense settings in western and eastern Africa. In these settings, policies and programs should broadly define “vulnerable children” to encompass the nonorphaned children living in these educationally disadvantaged, orphan-dense areas. In other words, rather than targeting beneficiaries by parents’ vital status, policies identifying children’s vulnerability as a function of where they live have the potential to benefit a large number of vulnerable children.
Second, the results show that orphaned children have poorer educational outcomes than their nonorphaned peers in all regions of sub-Saharan Africa. This suggests that, although community-based approaches will identify a broader swath of educationally vulnerable children in western and eastern Africa, programs targeting orphans specifically are needed across the entire subcontinent.
In sum, this study provides a valuable first look at the broader social implications of the high concentration of orphans in sub-Saharan Africa. Lending preliminary support to both the perspective that the negative ramifications of orphanhood extend beyond orphans themselves, and the perspective that African communities are coping with the challenges associated with orphan care, the results highlight the need for future research to better understand these complex and varied associations. By extending beyond the traditional focus on orphaned children, the study lays the groundwork for a new body of research focused on understanding the broader social implications of widespread orphanhood in sub-Saharan Africa.
7. Acknowledgements
References
Ainsworth, M., Beegle, K., and Koda, G. (2005). The impact of adult mortality and parental deaths on primary schooling in North-Western Tanzania. The Journal of Development Studies 41(3): 412-439. doi:10.1080/0022038042000313318. Ainsworth, M. and Filmer, D. (2006). Inequalities in children's schooling: AIDS,
orphanhood, poverty, and gender. World Development 34(6): 1099-1128.
doi:10.1016/j.worlddev.2005.11.007.
Bahemuka, J.M. (1983). Our religious heritage. Nairobi, Kenya: Thomas Nelson and Sons.
Beard, B.J. (2005). Orphan care in Malawi: Current practices. Journal of community health nursing 22(2): 105-115. doi:10.1207/s15327655jchn2202_4.
Bicego, G., Rutstein, S., and Johnson, K. (2003). Dimensions of the emerging orphan crisis in sub-Saharan Africa. Social Science & Medicine 56(6): 1235-1247.
doi:10.1016/S0277-9536(02)00125-9.
Bollen, K.A., Glanville, J.L., and Stecklov, G. (2007). Socio-economic status, permanent income, and fertility: A latent-variable approach. Population Studies
61(1): 15-34. doi:10.1080/00324720601103866.
Caldwell, J.C. (1997). The impact of the African AIDS epidemic. Health Transition Review 7: 169-188.
Copson, R.W. (2000). AIDS in Africa. Washington, D.C.: Defence. and Trade Division, Foreign Affairs, Congressional Research Service, Library of Congress.
Eastwood, R. and Lipton, M. (2011). Demographic transition in sub-Saharan Africa: How big will the economic dividend be? Population Studies 65(1): 9-35.
doi:10.1080/00324728.2010.547946.
Foster, G. and Germann, S. (2002). The orphan crisis. In: AIDS in Africa. Washington, D.C.: Defence. and Trade Division, Foreign Affairs, Congressional Research Service, Library of Congress: 664-675.
Foster, G., Makufa, C., Drew, R., Kambeu, S., and Saurombe, K. (1996). Supporting children in need through a community-based orphan visiting programme. AIDS care 8(4): 389-404. doi:10.1080/09540129650125597.
Grant, M.J. and Yeatman, S. (2012). The relationship between orphanhood and child fostering in sub-Saharan Africa, 1990s–2000s. Population Studies 66(3): 279-295. doi:10.1080/00324728.2012.681682.
Grassly, N.C., Desai, K., Pegurri, E., Sikazwe, A., Malambo, I., Siamatowe, C., and Bundy, D. (2003). The economic impact of HIV/AIDS on the education sector in Zambia. AIDS 17(7): 1039-1044. doi:10.1097/00002030-200305020-00013. Hunter, S. and Williamson, J. (2000). Children on the brink: Executive summary.
Washington, D.C.: USAID.
Kayongo, M.D. and Onyango, P. (1991). The sociology of the African family. New York: Longman Inc.
Mason, A. and Khandker, S. (1997). Household schooling decisions in Tanzania. Washington, D.C.: W. Bank.
Monasch, R. and Boerma, J. (2004). Orphanhood and childcare patterns in sub-Saharan Africa: An analysis of national surveys from 40 countries. AIDS 18: S55-S65.
doi:10.1097/00002030-200406002-00007.
Ntozi, J.P.M. and Mukiza-Gapere, J. (1995). Care for AIDS orphans in Uganda: Findings from focus group discussions. Health Transition Review 5: 245-252. Reid, E. (1993). Children in families affected by the HIV epidemic: A strategic
approach. New York: U. H. a. D. Programme.
Rugalema, G. (2000). Coping or struggling? A journey into the impact of HIV/AIDS in Southern Africa. Review of African Political Economy 27(86): 537-545.
doi:10.1080/03056240008704488.
Suda, C. (1997). Street children in Nairobi and the African cultural ideology of kin‐ based support system. Change and challenge. Child Abuse Review 6(3): 199-217.
doi:10.1002/(SICI)1099-0852(199708)6:3<199::AID-CAR306>3.0.CO;2-D. The United Nations Children's Fund (2006). Africa's orphaned and vulnerable
generations: Children affected by AIDS. Unicef.
Urassa, M., Boerma, J.T., Ng'weshemi, J.Z.L., Isingo, R., Schapink, D., and Kumogola, Y. (1997). Orphanhood, child fostering and the AIDS epidemic in rural Tanzania. Health Transition Review 7: 141-154.
Weinreb, A., Gerland, P., and Fleming, P. (2008). Hotspots and coldspots: Household and village-level variation in orphanhood prevalence in rural Malawi.
Appendices
Appendix A: Aggregate units included in the study (N=336), by region and country
Western Africa (N=125)
Benin (12)
Alibori, Atacora, Atlantique, Borgou, Collines, Couffo, Donga, Littoral, Mono, Quémé, Plateau, Zou
Burkina Faso (13)
Centre, Boucle de Mouhoun, Centre-Sud, Plateau Central, Centre-East, Centre-Nord, Centre-Ouest, Est, Nord, Cascade, Hauts Bassins, Sahel, Sud-Ouest
Cote d’Ivoire (11)
Centre, Centre-Nord, Nord-Est, Centre-Est, Sud (excluding Abidjan), Sud-Ouest, Centre-Ouest, Ouest, Nord-Ouest, Nord, City of Abidjan
Gambia (8)
Banjul, Kanifing, Brikama, Mansakonko, Kerewan, Kuntaur, Janjanburay, Basse
Ghana (10)
Western, Central, Greater Accra, Volta, Eastern, Ashanti, Brong Ahafo, Northern, Upper West, Upper East
Guinea (8)
Boké, Conakry, Faranah, Kankan, Kindia, Labé, Mamou, N’Zérékoré
Guinea Bissau (9)
Autonomous Sector of Bissau, Bafata, Gabu, Biombo, Cacheu, Oio, Tombali, Quinara, Bolama
Liberia (6)
Monrovia, North Western, South Central, South Eastern (a), South Eastern (b), North Central
Mali (9)
Niger (8)
Agadez, Diffa, Dosso, Maradi, Tahoua, Tillaberi, Zinder, Niamey
Nigeria (6)
North Central, North East, North West, South East, South West, South South
Senegal (11)
Dakar, Diourbel, Fatick, Kaolack, Kolda, Louga, Matam, Saint-Louis, Tambacounda, Thiés, Zuguinchor
Sierra Leone (4)
Eastern, Northern, Southern, Western
Sao Tome and Principe (4)
Regiao Centro, Regiao Sul, Regiao Norte, Regaio de Principe
Togo (6)
Lome, Maritime (excluding Lome), Plateaux, Centrale, Kara, Savanes
Eastern Africa (N=84)
Ethiopia (11)
Tigray, Afar, Amhara, Oromiya, Somali, Ben-Gumz, Southern Nations Nationalities and People’s Region, Gambela, Harari, Addis Abeba, Dire Dawa
Kenya (8)
Nairobi, Central, Coast, Eastern, Nyanza, Rift Valley, Western, North Eastern
Rwanda (12)
City of Kigali, Kigali Ngali, Gitarama, Butare, Gikongoro, Cyangugu, Kibuye, Gisenyi, Ruhengeri, Byumba, Umutara, Kibungo
Somalia (18)
Tanzania (26)
Dodoma, Arusha, Kilimanjaro, Tanga, Morogoro, Pwani, Dar es Salam, Lindi, Mtwara, Ruvuma, Iringa, Mbeya, Singida, Tabora, Rukwa, Kigoma, Shinyanga, Kagera, Mwanza, Mara, Manyara, Zanzibar North, Zanzibar South, Town West, Pemba North, Pemba South
Uganda (9)
Central 1, Central 2, Kampala, East Central, Eastern, North, West Nile, Western, Southwest
Central Africa (N=45)
Central African Republic (16)
Ombella Mpoko, Nana Mambere, Haute Kotto, Lobaye, Mambere Kadei, Sangha Mbaere, Nana Mambere, Ouham, Ouham Pende, Ouaka, Baminigui Bangoran, Haute Kotto, Mbomou, Basse Kotto, Haut Mbomou, Bangui
Chad (9)
Bar Azoum, Borkou-Ennedi-Tibesti, Centre East, Chari Baguirmi, Logone Occidental, Mayo Kebbi, Moyen Chari, Ouaddai Est N’Djaména
Congo(Brazzaville) (4)
Brazzaville, Pointe Noire, Sud, Nord
Democratic Republic of the Congo (11)
Kinshasa, Bas-Congo, Bandundu, Equateur, Orientale, Nord-Kivu, Maniema, Sud-Kivu, Katanga, Kasai Oriental, Kasai Occident
Gabon (5)
Libreville (Port-Gentil), North, East, West, South
Southern Africa (N=82)
Lesotho (10)
Madagascar (22)
Analamanga, Vakinankaratra, Itasy, Bongolava, Haute Matsiatra, Anamoroni’I Mania, Vatovavy Fitovinany, Ihorombe, Atsimo Atsinanana, Atsinanana, Analanjirofo, Alaotra Mongoro, Boeny, Sofia, Betsiboka, Melaky, Atsimo Andrefana, Androy, Anosy, Menabe, Diana, Sava
Malawi (3)
Northern, Central, Southern
Mozambique (11)
Niassa, Cabo, Delgado, Nampula, Zambezia, Tete, Manica, Sofala, Inhambane, Gaza, Maputo Province, Maputo City
Namibia (13)
Caprivi, Erongo, Hardap, Kara, Kavango, Khomas, Kunene, Ohangwena, Omaheke, Omusati, Oshana, Oshikoto, Otjozondjupa
Swaziland (4)
HHohho, Manzini, Shiselweni, Lubombo
Zambia (9)
Central, Copperbelt, Eastern, Luapula, Lusaka, Northern, North Western, Southern, Western
Zimbabwe (10)
Appendix B: Data source and sample characteristics, by country Data source Survey year Complete sample of children age 7-14 Incomplete Cases (%) Final sample of children age 7-14 Portion of final analytic sample (%) Provinces (#) Western Africa
Benin DHS 2006 20,953 1.63 20,611 11.17 12
Burkina Faso MICS 2006 9,452 2.29 9,236 5.00 13
Cote d'Ivoire MICS 2006 12,359 1.34 12,194 6.61 11
Gambia MICS 2006 10,545 0.60 10,482 5.68 8
Ghana DHS 2008 10,099 0.40 10,059 5.45 10
Guinea DHS 2005 9,516 0.76 9,444 5.12 8
Guinea Bissau MICS 2006 8,751 4.25 8,379 4.54 9
Liberia DHS 2007 7,792 1.75 7,656 4.15 6
Mali DHS 2006 16,887 1.79 16,584 8.99 9
Niger DHS 2006 11,993 1.38 11,828 6.41 8
Nigeria DHS 2008 33,386 2.61 32,516 17.62 6
Senegal DHS 2005 15,004 2.14 14,683 7.96 11
Sierra Leone DHS 2008 10,453 1.85 10,260 5.56 4
Sao Tome Principe (STP) DHS 2008 2,985 0.27 2,977 1.61 4
Togo MICS 2006 7,750 1.52 7,632 4.14 6
Total 1.64 184,541 100 125
Eastern Africa
Ethiopia DHS 2005 16,258 0.66 16,150 25.12 11
Kenya DHS 2003 8,041 0.96 7,964 12.39 8
Rwanda DHS 2005 10,572 0.67 10,501 16.33 12
Somalia MICS 2006 7,518 8.91 6,848 10.65 18
Tanzania DHS 2010 11,363 0.89 11,262 17.51 26
Uganda DHS 2006 11,721 1.23 11,577 18.00 9
Total 2.22 64,302 100 84
Central Africa
Central African Republic (CAR) MICS 2006 10,979 2.23 10,734 26.12 16
Chad DHS 2004 6,968 0.95 6,902 16.79 9
Congo DHS 2005 6,568 2.74 6,388 15.54 4
Democratic Republic of the Congo (DRC) DHS 2007 10,775 1.01 10,666 25.95 11
Gabon DHS 2000 6,620 3.14 6,412 15.60 5
Total 2.01 41,102 100 45
Southern Africa
Lesotho DHS 2009 8,488 2.33 8,290 8.91 10
Madagascar DHS 2009 20,597 3.22 19,934 21.42 22
Malawi DHS 2010 29,067 4.06 27,886 29.96 3
Mozambique DHS 2009 6,099 10.12 5,482 5.89 11
Namibia DHS 2007 8,640 4.27 8,271 8.89 13
Swaziland DHS 2006 5,004 1.80 4,914 5.28 4
Zambia DHS 2007 8,628 0.82 8,557 9.19 9
Zimbabwe DHS 2005 9,855 1.26 9,731 10.46 10
Total 3.49 93,065 100 82
Appendix C: Results of multilevel logistic regression models estimating the association between the contextual prevalence of orphans and non-orphaned children's school enrollment
Western1 Eastern2
Model 1 Model 2 Model 3 Model 1 Model 2 Model 3
OR SE OR SE OR SE OR SE OR SE OR SE
Level 2 - Province
Children orphaned by province (%) 1.08** 0.03 1.33* 0.15 1.17 0.12 1.10*** 0.03 1.26** 0.10 1.12 0.07 Children orphaned by province (%,
Sqrd) 0.99* 0.00 0.99 0.02 0.99* 0.00 0.99* 0.00
Household head has no formal
education (%) 0.98*** 0.00 0.97*** 0.00
Female headed household (%) 1.01 0.01 1.05*** 0.01
Mean household size 1.06* 0.03 1.00 0.09
Level 1 - Individual
Female 0.69*** 0.01 0.69*** 0.01 0.69*** 0.01 0.81*** 0.02 0.81*** 0.02 0.81*** 0.02
Age 1.06*** 0.00 1.06*** 0.00 1.06*** 0.00 1.18*** 0.01 1.18*** 0.01 1.18*** 0.01
Relationship to household head Parent5
Grandparent 1.05 0.03 1.05 0.03 1.05 0.03 1.15** 0.06 1.15** 0.06 1.15** 0.06
Relative 0.63*** 0.02 0.63*** 0.02 0.63*** 0.02 0.49*** 0.03 0.49*** 0.03 0.49*** 0.03
Sibling 0.46*** 0.02 0.46*** 0.02 0.46*** 0.02 0.75* 0.09 0.75* 0.09 0.75* 0.09
Spouse 0.42*** 0.05 0.42*** 0.05 0.42*** 0.05 0.19*** 0.08 0.19*** 0.08 0.20*** 0.08
Child head 1.24 1.48 1.24 1.48 1.25 1.48 1.84 1.84 1.84
Non-relative 0.54*** 0.02 0.54*** 0.02 0.54*** 0.02 0.25*** 0.02 0.25*** 0.02 0.25*** 0.02
Education of household head No formal education5
Primary 2.23*** 0.04 2.23*** 0.04 2.23*** 0.04 2.04*** 0.06 2.04*** 0.06 2.03*** 0.06
Secondary 3.81*** 0.08 3.81*** 0.08 3.79*** 0.08 3.07*** 0.15 3.07*** 0.15 3.05*** 0.15
Female headed household 1.54*** 0.03 1.54*** 0.03 1.54*** 0.03 1.21*** 0.04 1.21*** 0.04 1.21*** 0.04
Age of household head 1.00 0.00 0.99*** 0.00 0.99*** 0.00 0.99* 0.00 0.99* 0.00 0.99* 0.00
Household wealth 1.42*** 0.01 1.42*** 0.01 1.42*** 0.01 1.38*** 0.02 1.38*** 0.02 1.38*** 0.02
Household size 1.02*** 0.00 1.02*** 0.00 1.02*** 0.00 1.02* 0.01 1.02* 0.01 1.02* 0.01
Total # household members under
age 15 0.96*** 0.00 0.96*** 0.00 0.96*** 0.00 0.95*** 0.01 0.95*** 0.01 0.95*** 0.01
Total # household members over 64 1.06*** 0.01 1.06*** 0.01 1.06*** 0.01 1.02 0.04 1.02 0.04 1.02 0.04
Rural household 0.74*** 0.01 0.74*** 0.01 0.74*** 0.01 0.55*** 0.03 0.55*** 0.03 0.55*** 0.03
Country dummies (not shown)
Survey Year 1.52*** 0.13 1.55*** 0.13 1.28* 0.13 1.37*** 0.08 1.37*** 0.08 1.37*** 0.06
Random effects
Level 2 (Province)
Variance intercept 0.81 0.80 0.70 0.82 0.80 0.58
Model fit
Appendix C: (Continued)
Central3 Southern4
Model 1 Model 2 Model 3 Model 1 Model 2 Model 3
Level 2 - Province
Children orphaned by province (%)
1.08** 0.03 1.28* 0.14 1.05* 0.02 1.07*** 0.01 1.12** 0.05 1.04** 0.01
Children orphaned by province (%, Sqrd)
0.99 0.00 1.00 0.00
Household head has no formal education (%)
0.98** 0.01 0.98*** 0.00
Female headed household (%) 1.00 0.01 1.03** 0.01
Mean household size 0.99 0.09 1.16 0.12
Level 1 - Individual
Female 0.61*** 0.02 0.606*** 0.02 0.606*** 0.02 1.18*** 0.03 1.18*** 0.03 1.18*** 0.03
Age 1.12*** 0.01 1.12*** 0.01 1.12*** 0.01 1.03*** 0.01 1.03*** 0.01 1.03*** 0.01
Relationship to household head Parent5
Grandparent 1.05 0.06 1.05 0.06 1.05 0.06 1.08 0.05 1.08 0.05 1.08 0.05
Relative 0.57*** 0.03 0.57*** 0.03 0.57*** 0.03 0.55*** 0.03 0.55*** 0.03 0.55*** 0.03
Sibling 0.64*** 0.06 0.64*** 0.06 0.64*** 0.06 0.61 0.06 0.61 0.06 0.61 0.06
Spouse 0.53* 0.17 0.53* 0.17 0.53* 0.17 0.37*** 0.08 0.37*** 0.08 0.37*** 0.08
Child head 1.01 1.30 1.01 1.30 1.01 1.29 0.62 0.31 0.62 0.31 0.62 0.31
Non-relative 0.65*** 0.05 0.65*** 0.05 0.65*** 0.05 0.36*** 0.02 0.36*** 0.02 0.36*** 0.02
Education of household head No formal education5
Primary 1.84*** 0.07 1.84*** 0.07 1.84*** 0.07 1.88*** 0.05 1.88*** 0.05 1.88*** 0.05
Secondary 3.73*** 0.17 3.73*** 0.17 3.73*** 0.17 3.35*** 0.15 3.35*** 0.15 3.35*** 0.15
Female headed household 1.42*** 0.06 1.42*** 0.06 1.42*** 0.06 1.18*** 0.04 1.18*** 0.04 1.18*** 0.04
Age of household head 1.00 0.00 1.00 0.00 1.00 0.00 0.99*** 0.00 0.99*** 0.00 0.99*** 0.00
Household wealth 1.46*** 0.02 1.46*** 0.02 1.46*** 0.02 1.39*** 0.02 1.39*** 0.02 1.39*** 0.02
Household size 1.03** 0.01 1.03** 0.01 1.03** 0.01 1.07*** 0.01 1.07*** 0.01 1.07*** 0.01
Total # household members under age 15
0.96** 0.01 0.96** 0.01 0.96** 0.01 0.91*** 0.01 0.91*** 0.01 0.91*** 0.01
Total # household members over 64
1.07 0.05 1.07 0.05 1.07 0.05 1.06*** 0.04 1.06*** 0.04 1.06*** 0.04
Rural household 0.79*** 0.03 0.79*** 0.03 0.79*** 0.03 0.79*** 0.04 0.79*** 0.04 0.79*** 0.04
Country dummies (not shown)
Survey Year 0.55*** 0.02 0.55*** 0.03 0.55*** 0.04 0.18*** 0.04 0.18*** 0.04 0.18*** 0.03
Random effects
Level 2 (Province)
Variance intercept 0.36 0.35 0.31 0.42 0.42 0.33
Model fit
Likelihood-ratio test 392.83*** 347.75*** 195.22*** 817.4*** 817.03*** 430.04***
Sources: DHS & MICS.
Note:1
N=166,173 non-orphaned children in 125 provinces in 15 countries.
2
N=52,915 non-orphaned children in 84 provinces in 6 countries.
3
N=35,921 non-orphaned children in 45 provinces in 5 countries.
4
N=74,747 non-orphaned children in 82 provinces in 8 countries.
5