© 2017 Prabaningdyah et al. This is an open access article distributed under the terms of the Creative Commons Attribution License -NonCommercial-ShareAlikeUnported License (http://creativecommons.org/licenses/by-nc-sa/3.0/).
Journal of Applied Pharmaceutical Science Vol. 7 (12), pp. 058-064, December, 2017 Available online at http://www.japsonline.com
DOI: 10.7324/JAPS.2017.71207 ISSN 2231-3354
Application of HPLC and response surface methodology for
simultaneous determination of curcumin and desmethoxy
curcumin in Curcuma syrup formulation
Niken K. Prabaningdyah
1,2, Sugeng Riyanto
1, Abdul Rohman
1,3*, Chairany Siregar
1,4 1Department of Pharmaceutical Chemistry, Faculty of Pharmacy, Gadjah Mada University, Yogyakarta, 55281, Indonesia 2
The National Agency of Drug and Food Control, District of Yogyakarta, Republic of Indonesia. 3
Research Center of Halal Products, Gadjah Mada University, Yogyakarta, 55281, Indonesia. 4
The National Agency of Drug and Food Control, District of Samarinda, West Kalimantan, Republic of Indonesia.
ARTICLE INFO ABSTRACT
Article history: Received on: 04/09/2017 Accepted on: 26/10/2017 Available online: 30/12/2017
The effectiveness of herbal medicine containing Curcuma extract depends on the active compounds of curcumin (CUK) and desmethoxycurcumin (DMCUR) present in formulation. The objective of this study was to optimize HPLC condition using experimental design of Box-Behnken design (BBD) for simultaneous determination of C and DMC in syrup containing curcuma extract. The column used was RP 18 Waters® X-Bridge (250 x 4.6 mm i.d.; 5 µm). Four variables namely column temperature, flow rate, solvent ratio of acetonitrile-acetic acid, and % acetic acid were used and subjected to RSM in order to get optimum condition. The predicted optimum assay condition consisted of mobile phase acetonitrile-acetic acid 4.08% (49: 51) delivered isocratically at flow rate 1.04 mL/min with column temperature of 40o
C. Using this optimum condition, baseline separation of both compounds was achieved with good resolution. The optimized HPLC assay condition was validated according to International conference on Harmonization (ICH) guidelines by assessing several parameters such as specificity, linearity, accuracy, sensitivity and precision.
Key words:
Curcuma xanthorriza Linn, curcuminoid, curcumin, desmethoxycurcumin, Box-Behnken design.
INTRODUCTION
The use of temula wak, also known as Java turmeric,
with scientific name Curcuma xanthorriza as raw material in
herbal medicines and food is increased 5.4% annually, which make high demand on this rhizome in herbal industries (Nihayati
et al., 2013). Some pharmaceutical formulations such as syrup
and tablet contain rhizome of temula wak intended to increase
appetite (Oon et al., 2015). Several biological activities have
been reported in C. xanthorriza for treatment of hepatitis, liver
complaints, diabetes, cancer, rheumatism, hypertension,
antioxidant, diuretic, and hepatoprotective effects (Devaraj et al.,
2014). In addition, this rhizome was also used for anti-
.
* Corresponding Author
Email: abdul_kimfar @ ugm.ac.id, Phone: +62274-543120
inflammatory, antibacterial, and antifungal effects (Hwang et al.,
2000a; Hwang et al., 2000b; Rukayadi et al., 2013). The main
component present in rhizome of C. xanthorriza is curcuminoid
(mainly curcumin and desmethoxycurcumin), believed to be responsible for those biological activities, therefore, it is important to determine the levels of compounds or groups of compounds responsible for biological activities. Indeed, analytical techniques capable of quantifying curcuminoid (total and individual) should be developed. Several analytical methods have been developed and used for routine analysis of curcuminoid, namely Fourier transform
infrared spectroscopy (Tanaka et al., 2008; Rohman et al., 2015),
thin layer chromatography-densitometry (Péret-Almeida et al.,
2005), high performance liquid chromatography using UV-visible
detector and electrochemistry detector (Inoue et al., 2008; Syed et
al., 2015), high performance liquid chromatography using
.
photodiode array detector (Korany et al., 2013), liquid chromatography-mass spectrometry (Asai and Miyazawa, 2000),
and capillary Electrophoresis (Jiang et al., 2006). HPLC is
method of choice for separation of curcuminoid in plant materials. Several parameters such as stationary phase, mobile phase composition, pH and flow rate of mobile phase, and organic
modifiers contribute to HPLC separation (Snyder et al., 2010).
Some authors use one variable of one time (OVAT) approach for HPLC separation which is ineffective due to elimination of interaction among variables, thus, the experimental design for identification of such interaction is needed. In our best knowledge, there is no report related to use of experimental design of Box-Behnken design (BBD) for simultaneous determination of CUR and DMCUR in syrup containing curcuma extract. Therefore, the objective of this study was to use BBD using four variables of column temperature, flow rate, solvent ratio of acetonitrile-acetic acid, and % acetic acid to get optimum HPLC condition for analysis of CUR and DMCUR in syrup formulation.
MATERIALS AND METHODS
Materials
Curcuminoid was purchased from E. Merck (Darmstadt,
Germany). The standards of curcumin (CUR) and
desmethoxycurcumin (DMCUR) were isolated from curcuminoid
using column chromatography according to Péret-Almeida et al.
(2005). The purity of CUR and DMCUR was checked using thin
layer chromatography and high performance liquid
chromatography. The solvents used for HPLC was indeed HPLC grade. The other solvents and reagents were of pro-analytical grade, unless otherwise specified. The syrup samples with batch number 17A0159 were claimed containing curcuminoid 2 mg from
C. Xanthorriza were obtained around Yogyakarta, Indonesia.
Instrumentation and Software
A Shimadzu HPLC instrument- LC-20AD (Japan) equipped with Rheodyne 7725i injection valve with a 20 µL loop volume and Binary gradient pump was used. The system also includes detector of photodiode array (Shimadzu, SPD-M20A) operated at a wavelength of 425 nm. Data were acquired and processed by using LC-solution software. Chromatographic
separation was performed using RP 18 Waters® X-Bridge (250 x
4.6 mm i.d.; 5 µm).The experimental design of Box-Behnken design and data analysis calculations were performed by using Design-Expert version 7.1.5.
Preparation of standard solution
An accurate weight of 5.075 mg of CUR and 3.270 mg of DMCUR were transferred into 100 mL and 50 mL for CUR and DMCUR respectively. The contents of the volumetric flask were dissolved in mobile phase to get 0.05 mg/mL of CUR and 0.06 mg/mL DMCUR. The working standard solution was obtained by diluting the standard stock solution with mobile phase during the analysis time. The stock solution and working standard solution were protected from light during analysis.
HPLC procedure
The condition of HPLC was optimized based on
Wichitnithad et al. (2009) to get the best separation C and DMC.
The Chromatographic separations were performed on Waters®
X-bridge (250 mm x 4.6 mm i.d; 5 μm). A mixture of acetonitrile: acetic acid in aquadest was used as the mobile phase. The wavelength of detector PDA was set at 425 nm in which both compounds gave good response.Volume of injection was 20 uL.
Experimental design
The experimental design approach is useful for optimizing the chromatographic separation and helping out in the development of better understanding of the interaction of several
chromatographic factors on separation quality (Karaliya et al.,
2017). The mobile phase comprising mixture of acetonitrile-acetic acid (50: 50 v/v) with flow rate of 1 mL/min was selected in preliminary studies. The acetic acid concentration (X1), acetonitrile ratio (X2), flow rate (X3), and column temperature (X4) were selected as independent variable during Respon surface- Box-Behnken design, whereas peak area, retention time, tailing factor and resolution were chosen as response variable.
Validation of HPLC analysis
Before validation of HPLC, the system suitability test by injecting six replicate of analytes at a concentration of 3 µg/mL was performed. The acceptance criteria considered for the system suitability was taken as ±2% for the percent coefficient of variation
(%CV) of the peak area and retention time (Khan et al., 2016).The
validation of HPLC method was performed according to International Conference Harmonization (ICH, 2005) by assessing several parameters namely selectivity, linearity and range, limit of Detection (LoD), limit of quantification, precision, and accuracy.
Analysis of syrup formulation
A syrup sample equivalent to 5.0 mL syrup containing curcuma extract was accurately weighed into volumetric flask 100 mL. The sample was added with 50 mL mobile phase, shaken vigorously and made until volume with mobile phase. A-4.0 mL of this solution was taken and diluted until 20 mL, filtered using 0.45 µm filter, and injected into HPLC system.
RESULTS AND DISCUSSION
Experimental design optimization
employed to analyze the effect of independent variables on the
responses (Singh et al., 2005).
Using ANOVA results, the equation obtained using X1, X2, X3, and X4 as independent variables with retention time (Y1) as response was:
Log Y1 = 0.88 – 0.022X1 – 0.23X2 – 0.020X3 – 0.29X4 + 5. 976 x
10-6X1X2 + 1.026 x 10
-4
X1X3 + 0.017X1X4 – 2.049 x 10
-4
X2X3 –
3.196 x 10-3X2X4 + 0.01X3X4 – 2.401 x 10
-3
X1
2
+ 0.062X2
2
+ 5.882
x 10-4X3
2
+ 0. 087X4
2
(adjusted R2 of 0.9999)
The statistical results revealed that adjusted coefficient of
determination (Adj. R2) obtained was > 0.8 was well within the
acceptable limits (R2> 0.8) that showed experimental model was
good fit using polynomial equations (Karaliya et al., 2017). Based
on ANOVA results, the variables of X1, X2, X3 and X4 as well as interaction between X1 and X4, X3 and X4 and quadratic form of X2 and X4 contributed significantly for response of Y1 (P < 0.05). Similarly, the equations for Y2, Y3, and Y4 were:
= 1.904 x 10
-3
+ 1.627 x 10-5X1 + 4.596 x 10
-4
X2 + 2.697 x10
-5
X3
– 5.058 x 10-5
X4 – 3.297 x 10
-6
X1X2 + 7.844 x 10
-6
X1X3 – 4.299 x
10-6X1X4 – 1.176 x 10
-5
X2X3 + 1.36 x 10
-5
X2X4 – 2.43 x10
-5
X3X4 +
1.988 x 10-5X1
2 – 6. 028 x 10-5
X2
2
+ 6.99 x 10-6X3
2
+ 4.268 x 10
-5
X4
2
(adjusted R2 of 0.9992)
The variables of X2, X3, and X4 as well as quadratic form of X2 and X4 contributed significantly for response of Y2 (P < 0.05).
= 0.62 + 4.861 x 10
-3
X1 + 0.031X2 – 0.017X3 + 0.15X4 + 1.091
x 10-3X1X2 + 2.394 x 10
-3
X1X3 + 3.038 x 10
-3
X1X4 – 1.445 x10
-3
X2X3 + 0.014X2X4 + 4.066 x 10
-3
X3X4 + 4.7 x 10
-3
X1
2
+ 2.548 x
10-3X2
2
+ 3.087 x 10-3X3
2
+ 0.027X4
2
(adjusted R2 of 0.99997).
The variables of X1, X2, X3 and X4 as well as interaction between X2 and X4 and quadratic form of X4 contributed significantly for response of Y3 (P < 0.05).
Y4 = 1,19 – 0,017X1 – 1,583.10
-3
X2 + 2,25.10
-3
X3 + 0,092X4 +
0,010X1X2 – 2,75.10
-3
X1X3 + 8,75.10 -3
X1X4 + 4,75.10
-3
X2X3 +
0,012X2X4 + 6,75.10
-3
X3X4 + 7,258.10
-3
X1
2
+ 2,008.10-3X2
2
+
2,583.10-4X3
2
+ 0,01X4
2
(adjusted R2 of 0.9944).
Only variable X4 contributed significantly toward response of Y4 (P < 0.05). The complete results of response values of Y1, Y2, Y3 and Y4 using independent variables of X1, X2, X3 and X4 were compiled in Table 1.
Based on selected parameters, namely minimum values of retention time and tailing factor and maximum values of peak area and resolution, finally, HPLC optimum condition selected for prediction of CUR and DMCUR consisted of mobile phase composition of acetonitrile-acetic acid 4.08% (49: 51) delivered isocratically at flow rate 1.04 mL/min with column temperature of
40oC. Figure 1 exhibited HPLC chromatogram of CUR and
DMCUR using optimized condition. This condition was used for system suitability test and method validation.
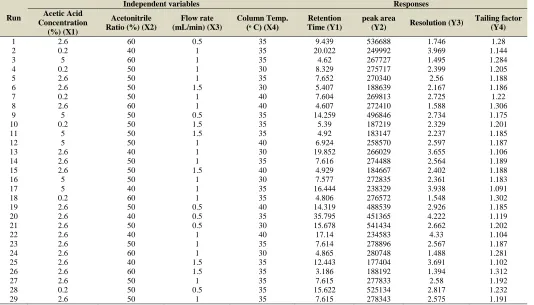
Table 1: Design of experiment based Box-Behnken design using dependent variables of acetic acid concentration (X1), acetonitrile ratio (X2), flow rate (X3) and column temperature (X4) with response variables of retention time (Y1), peak area (Y2), resolution (Y3) and tailing factor (Y4) used in HPLC method development for analysis of curcumin and desmethoxycurcumin.
Run
Independent variables Responses
Acetic Acid Concentration
(%) (X1)
Acetonitrile Ratio (%) (X2)
Flow rate (mL/min) (X3)
Column Temp.
(ᵒ C) (X4) Time (Y1) Retention
peak area
(Y2) Resolution (Y3)
Tailing factor (Y4)
1 2.6 60 0.5 35 9.439 536688 1.746 1.28
2 0.2 40 1 35 20.022 249992 3.969 1.144
3 5 60 1 35 4.62 267727 1.495 1.284
4 0.2 50 1 30 8.329 275717 2.399 1.205
5 2.6 50 1 35 7.652 270340 2.56 1.188
6 2.6 50 1.5 30 5.407 188639 2.167 1.186
7 0.2 50 1 40 7.604 269813 2.725 1.22
8 2.6 60 1 40 4.607 272410 1.588 1.306
9 5 50 0.5 35 14.259 496846 2.734 1.175
10 0.2 50 1.5 35 5.39 187219 2.329 1.201
11 5 50 1.5 35 4.92 183147 2.237 1.185
12 5 50 1 40 6.924 258570 2.597 1.187
13 2.6 40 1 30 19.852 266029 3.655 1.106
14 2.6 50 1 35 7.616 274488 2.564 1.189
15 2.6 50 1.5 40 4.929 184667 2.402 1.188
16 5 50 1 30 7.577 272835 2.361 1.183
17 5 40 1 35 16.444 238329 3.938 1.091
18 0.2 60 1 35 4.806 276572 1.548 1.302
19 2.6 50 0.5 40 14.319 488539 2.926 1.185
20 2.6 40 0.5 35 35.795 451365 4.222 1.119
21 2.6 50 0.5 30 15.678 541434 2.662 1.202
22 2.6 40 1 40 17.14 234583 4.33 1.104
23 2.6 50 1 35 7.614 278896 2.567 1.187
24 2.6 60 1 30 4.865 280748 1.488 1.281
25 2.6 40 1.5 35 12.443 177404 3.691 1.102
26 2.6 60 1.5 35 3.186 188192 1.394 1.312
27 2.6 50 1 35 7.615 277833 2.58 1.192
28 0.2 50 0.5 35 15.622 525134 2.817 1.232
Method validation
During system suitability test, the % relative standard deviation (RSD) of peak area and retention time was evaluated. RSD values were found to be less than 2%, i.e. 0.16% and 0.12% for peak area of CUR and DMCUR, respectively; and 0.07% and 0.06% for retention time of CUR and DMCUR, respectively indicating the suitability of HPLC system. The number of theoretical plates (N) and USP tailing factor (TF) for the six replicate injections were found to be 11121.8 and 1.24 for CUR, as well as 11935 and 1.214 for DMCUR, indicating the acceptable criteria for parameters of N and TF. HPLC which indicated system suitability was validated by determining several parameters namely
Selectivity
The selectivity of HPLC method was evaluated after injecting mobile phase, CUR at concentration 3.5 µg/mL, DMCUR at 0.22 µg/mL, and the mixture of CUR and DMCUR. Resolution (Rs) of ≥ 2.0 during chromatographic separation was
used as acceptance criteria. Rs value obtained was > 2.0 indicating that HPLC was selective enough for analysis of CUR and DMCUR.
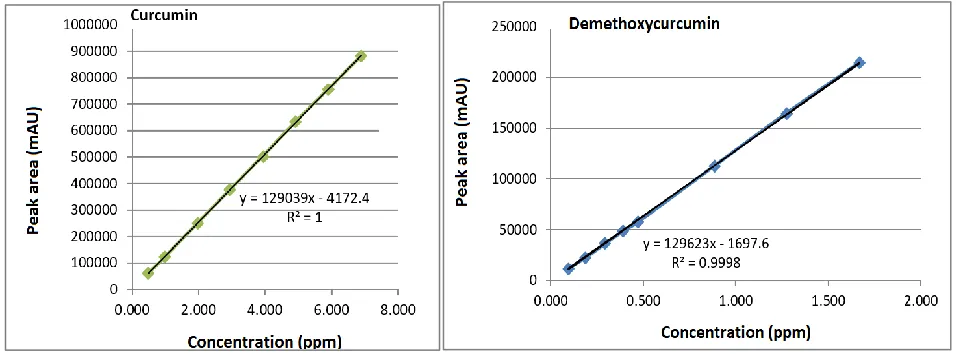
Linearity and range
The linearity of CUR and DMCUR was evaluated from coefficient of correlation (r-value) and intercept of linear regression describing the relationship between concentration of analytes (x-axis) and peak area (y). The concentration range used were 0.492-6.890 µg/mL for CUR and 0.094-2.452 µg/mL for DMCUR (Figure 2). The calibration plot demonstrated a good relationship with r-value of 0.9999 (CUR) and 0.998 (DMCUR). From linear regression, limit of detection (LoD) and limit of quantification (LoQ) were determined as:
where
LoD and LoQ values obtained were 0.056 and 0.169 µg/mL for CUR, and 0.031 and 0.095 µg/mL for DMCUR, respectively.
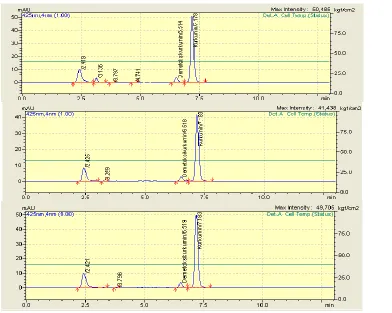
Fig. 1: HPLC chromatogram obtained during optimization using Box-Behnken design for analysis of curcumin and desmethoxycurcumin
(see text for HPLC condition).
Fig. 2: The calibration plot for relationship between concentration of curcumin and desmethoxycurcumin (x-axis) and peak area (y-axis) along
Precision
The precision of HPLC was evaluated by repeatability test (intra-day precision) and intermediate precision (inter-day precision) by analysis of eight replicates of homogenous syrup sample at concentration level of 1.827 mgCUR and 0.119 mgDMCUR in 5 mL syrup each. The intra-day RSD values obtained were 1.74% and 2.16% for CUR and DMCUR, respectively. While, inter-day RSD values of CUR and DMCUR were 1.73% and 2.15%, respectively. These RSD values were lower than those requested by Horwitz function (i.e. 4%) at concentration level of 1% of target analytes (Gonzalez and Herrador, 2007), indicating that HPLC at optimized condition was precise for simultaneous determination of CUR and DMCUR in syrup samples.
Accuracy
The accuracy of HPLC method was evaluated by standard addition method in which syrup samples were spiked with standard solution of CUR and DMCUR at 60, 80, 100, 120 and 140% from analyte concentration target and the recovery was calculated. The average recovery percentages for CUR and DMCUR were 97.04 and 100.51%, respectively. These values were in agreement with those specified in the Association of
Official Analytical Chemists, as reported by Gonzalez and Herrador (2007). This indicated that HPLC method was accurate and systematic error could be negligible.
Analysis of CUR and DMCUR in syrup samples
The optimized and validated HPLC method was further used for simultaneous analysis of CUR and DMCUR in syrup samples. Figure 4 was an example of HPLC chromatogram obtained during analysis, which indicated selective separation. Table 2 compiled the analytical results of CUR and DMCUR in syrup samples. The concentration of CUR and DMCUR in 8 samples evaluated were in the range of 1.786-1.868 mg/5 mL syrup and 0.116-0.123 mg/5 mL syrup, respectively.
Table 2: The contents of curcumin (CUR) and demethoxycurcumin (DMCUR) in syrup samples containing curcuma extract.
Samples Concentration (mg/5 mL syrup)
CUR DMCUR
Sample 1 1.840 0.121
Sample 2 1.786 0.116
Sample 3 1.868 0.123
Sample 4 1.853 0.121
Sample 5 1.838 0.120
Sample 6 1.846 0.120
Sample 7 1.794 0.118
Sample 8 1.791 0.116
Fig. 3: The example of HPLC chromatogram of syrup samples using optimized condition.
CONCLUSION
The experimental design of Box-Behnken has been used successfully to optimize HPLC condition for simultaneous determination of CUR and DMCUR in syrup containing curcuma extract. The mobile phase of acetonitrile-acetic acid 4.08% (49: 51 v/v) delivered isocratically at flow rate 1.04 mL/min with column
temperature of 40oC was obtained during optimization. Using this
optimum condition, the developed method was valid as appeared from acceptable criteria of validation parameters.
ACKNOWLEDGEMENTS
Financial support and sponsorship: The author thanks to Ministry of Research and Higher Education for financial support during this research via scheme Penelitian Unggulan Perguruan Tinggi 2017 with contract number 807/UN1-P.III/LT/DIT-LIT/2017.
Conflict of Interests: There are no conflicts of interest.
REFERENCES
Asai A, Miyazawa. T. Occurrence of orally administered curcuminoid as glucuronide and glucuronide/sulfate conjugates in rat plasma. Life Sci., 2000;67: 2785–2793.
Devaraj S, Ismail S, Ramanathan S, Yam MF. Investigation of Antioxidant and Hepatoprotective Activity of Standardized Curcuma xanthorrhiza Rhizome in Carbon Tetrachloride-Induced Hepatic Damaged Rats. The Sci. World J., Volume 2014; Article ID 353128. 8 pages. http://dx.doi.org/10.1155/2014/353128
González AG, Herrador MÁ. A practical guide to analytical method validation, including measurement uncertainty and accuracy profiles. TrAC Trends. Anal. Chem., 2007;26: 227–238.
Hwang JK, Shim JS, Pyun YR. Antibacterial activity of xanthorrhizol from Curcuma xanthorrhiza against oral pathogens. Fitoterapia. 2000b; 71:321–333.
Hwang JK, Shim JS, Baek NI, Pyun YR. Xanthorrhizol: a potential antibacterial agent from Curcuma xanthorrhiza against Streptococcus mutans. Planta Med. 2000a; 66:196–7.
Inoue K, Nomura C, Ito S, Nagatsu A, Hino T, Oka H. Purification of curcumin, demethoxycurcumin. and bisdemethoxy-curcumin by high-speed countercurrent chromatography. J. Agric. Food Chem., 2008; 56: 9328–9336.
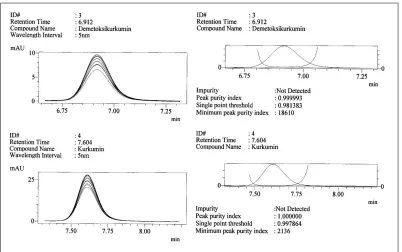
Fig. 4: one of peak purity data during optimization condition (acetic acid 0.2%, 1mL/min flow rate, 40 °C column temperature and 50 % acetonitril ratio to acetic acid.
Table 3: The composition of syrup formulation containing curcuminoid stated in label claim.
Composition Each of 5 mL syrup contain :
Curcuminoid 2 mg
Vitamin B1 3 mg
Vitamin B2 2 mg
Vitamin B6 5 mg
Vitamin B12 5 mcg
Betacaroten 10% 4 mg
Dexpanthenol 3 mg
International Conference on Harmonisation. Validation of Analytical Procedures: Text and Methodology, 2005.
Jiang H, Somogyi A,Jacobsen NE, Timmermann BN, Gang DR. Analysis of curcuminoids by positive and negative electrospray ionization and tandem mass spectrometry. Rapid Comm. Mass spectrom., 2006;20: 1001–1012.
Kalariya PD, Namdev D, Srinivas R, Gananadhamu S. Application of experimental design and response surface technique for selecting the optimumRP-HPLC conditions for the determination of moxifloxacin HCl and ketorolac tromethamine in eye drops. J. Saudi Chem. Soc., 2017;21: S373-383.
Korany, M.A., Haggag, R.S., Ragab, M.A.A., dan Elmallah, O.A.. A validated stability-indicating HPLC method for simultaneous determination of Silymarin and Curcumin in various dosage forms. Arabian Journal of Chemistry Volume 10, Supplement 2, May 2017; S1711-S1725
Nihayati E, Wardiyati T, Retnowati R, Soemarno. The curcumin content of temula wak(Curcuma xanthorriza Roxb.) rhizome as affected by N. K and micronutrients B. Fe. Zn. Agrivita, 2013;35(3): 218-226.
Oon SF, Nallappan M, Tee TT, Shohaimi S, Kassim NK, Sa’ariwijaya MS, Cheah YH. Xanthorrhizol: a review of its pharmacological activities and anticancer properties. Cancer Cell Int., 2015;15:100-104.
Péret-Almeida L, Cherubino APF, Alves RJ, Dufossé L, Glória MBA. Separation and determination of the physico-chemical characteristics of curcumin. demethoxycurcumin and bisdemethoxycurcumin. Food Res. Int., 2005; 38: 1039–1044
Rohman A, Sudjadi, Ramadhani D, Nugroho A. Analysis of Curcumin in Curcuma longa and Curcuma xanthorriza Using FTIR Spectroscopy and Chemometrics. Res. J. Med. Plant, 2015;9: 179–186.
Rukayadi Y, Hwang JK. In vitro activity of xanthorrhizol isolated from the rhizome of Javanese turmeric (Curcuma xanthorrhiza Roxb.) against Candida albicans biofilms. Phytother Res., 2013;27:1061– 1066.
Singh B, Kumar R, Ahuja N. Optimizing drug delivery system using systematic “design of experiments.” Part I: fundamental ASPECTS. Crit. Rev. Ther. Drug Carrier Syst. 2005; 1(22):27–105.
Syed HK, Liew KB, Loh GOK, Peh KK. Stability indicating HPLC–UV method for detection of curcumin in Curcuma longa extract and emulsion formulation. Food Chem., 2015;170: 321–326.
Tanaka K, Kuba Y, Sasaki T, Hiwatashi F, Komatsu K. Quantitation of curcuminoids in curcuma rhizome by near-infrared spectroscopic analysis. J. Agric. Food Chem.,2008;56: 8787–8792.
Wichitnithad W, Jongaroonngamsang N, Pummangura S, Rojsitthisak P. A simple isocratic HPLC method for the simultaneous determination of curcuminoids in commercial turmeric extracts. Phytochem.Anal., 2009; 20: 314–319.
How to cite this article: