The Effect of Visual Feedback on Learnability and Usability
of Design Methods
Ronald Poelman1,* - Zoltán Rusák2 - Alexander Verbraeck1 - Leire Sorasu Alcubilla1 1 Faculty Technology, Policy and Management, Department of Systems Engineering
Delft University of Technology, the Netherlands
2 Faculty Industrial Design Engineering, Computer Aided Design & Engineering
Delft University of Technology, the Netherlands
Currently 2D displays are used for the majority of design tasks, but 3D successors are slowly being introduced as a promising alternative. Understanding how the dimensionality of displayed images influences the effectiveness and efficiency of designers working with virtual reality design environments is therefore of great interest. This paper presents the results of a comparative usability study, which focuses on assessing the influence of different types of displays on learnability and usability. In our study, we carried out an experiment to compare 2D screen and 3D displays. Users were asked to design free form shapes in each of the three types of environments using a prescribed human-computer interaction process. This research shows that there are significant differences between the preferences of different user groups. Gender and level of expertise in using advanced visualization technologies had a significant influence on the usability and learnability of the design methods for each of the three display types.
©2010 Journal of Mechanical Engineering. All rights reserved.
Keywords: virtual reality, dimensionality, display, design, usability, learnability
0 INTRODUCTION
The use of 3D virtual reality technologies for various design activities (e.g. product modeling, evaluation of production processes, user evaluations of new product concepts) has been proliferating in the aerospace and automotive industry. The technology was, however, adopted on a much smaller scale in consumer product design. There are several explanations for this difference such as: (a) the relatively high cost of hardware and software for virtual reality design environments, (b) a lack of dedicated design methods that support the use of 3D virtual reality tools for design activities, and (c) an undefined cost-benefit ratio of applying 3D virtual reality for consumer products design. On the other hand, with the introduction of desktop virtual reality investment in hardware and software have been significantly reduced. Potentially, effectiveness and efficiency can be improved by using higher dimensionalities than the standard 2D when designing. Small design offices might weigh the investment costs of the virtual reality solutions and the costs of training users for these new solutions against the expected improvement of effectiveness and efficiency of the design process. The costs of hardware and user training can be clearly defined but the
benefits of using higher dimensionality environments on the efficiency and effectiveness of the design processes is more difficult to assess. Literature indicates that effectiveness and efficiency of the user and his/her performance of a task can be assessed as the usability of an interface, product or system [1]. In this paper we investigate the effect of a dimensional degree of visual feedback on the learnability and usability of new virtual reality based design methods.
The paper presents the results of a comparative study, which focuses on assessing the influence of different types of displays on learnability and usability. In our study, we compared the effectiveness of 2D and 3D output devices for human-computer interaction in designing free form shapes. We define that 2D works with perspective and occlusion to indicate depth and 3D is surface independent to create 3D imagery. The goal of the study was to identify and understand relationships between the dimensionality degree of visual feedback and the learnability and usability of new virtual reality based design methods.
and the learnability, which was measured according to the Technology Acceptance Model (TAM) [2], illustrated in Fig. 1. TAM defines usability or the ease of use as “the degree to which an individual believes that using a particular system or device would be free of physical and mental effort” [3]. Learnability is defined by Santos and Badre as “the effort required for a typical user to be able to perform a set of tasks using an interactive system with a predefined level of proficiency” [4]. The variables have been measured using a questionnaire.
Fig. 1. Technology acceptance model (TAM) [2]
In this questionnaire more parameters than the learnability and the usability were measured such as the helpfulness and the efficiency, the user’s satisfaction, the desirability the user feels towards interacting with the device/system and the frequency the user expects the device/system to be used in a design company in a near future.
The results of our study are presented according to the following structure. First we discuss the state-of-the-art in visualization techniques, followed by a discussion of the usability and learnability of design tools. In the second section, we present the setup of our experiments (i.e. the research apparatus, participants, and the procedure). The results and the data analysis are discussed in section three.
Interpretation of the data is presented in section four, and the paper ends with conclusions.
1 STATE OF THE ART
Although 3D design software solutions are common nowadays, the interface of software applications has remained the same over the past 20 years. This might be a result of the fact that 3D designing software is still unable to provide the user the five required design tasks [5]: (i) 3D sketching and structuring, (ii) rapid experimentation within the design space, (iii) working with multiple design ideas in parallel, (iv) collaboration, (v) reflection and “anywhere” refinement. These are likely some of the reasons for new types of technologies to arise, which enable new ways of working with more parameters than the current design environments. In fact, major leaps are established in tracking technology, display technology, motion sensors (MEMS) and 3D rendering which enable new and more options for human computer interaction.
where empirical evaluation has been carried out, but where just one or two immersion degrees of display types have been tested (e.g. [9] to [14]). In this paper the three different immersion levels of display and additional variables such as the usability and learnability are compared. As shown, human computer interaction is commonly studied but without the goals provided in this research.
By testing the usability we hope to acquire insight into the weakest and strongest parts of a particular technology. We interpret usability as the level of ease (effort) in which people can employ a particular tool in order to achieve a particular goal. In broader sense usability also refers to the methods used for measuring usability itself as well as to the study of the principles behind a product's perceived efficiency or elegance. We have also investigated learnability, which is the capability of a software product (also in combination with hardware) to enable the user to learn how to use it. Learnability also may be considered as an aspect of usability and it is of major concern in the design of complex software applications.
2 SETUP OF THE EXPERIMENT
2.1 Research
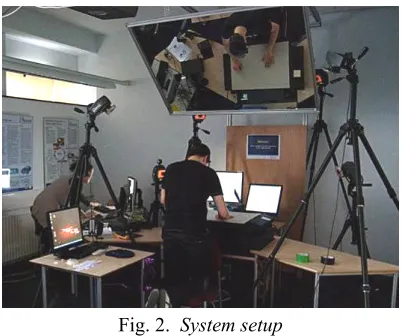
In order to be able to measure the effect of dimensionality of the visual feedback on learnability and usability, the hardware/software should facilitate visual perceptions of 3D images on one 2D and two 3D displays as well as different grades of immersion. With this in mind the following hardware was chosen for the experiments: a) 19” LCD monitor as 2D display, b) holographic display (HoloVizio 128WLD), which has horizontal parallax, and c) head mounted display (eMagin Z800 3D Visor), which provides full immersion of the user in a virtual environment.
So as to perform the design tasks, the hand motion of the users have been captured by a Vicon optical motion tracking system with 6 Hawk Digital Cameras, the EagleHub, and EvaRT v.5.0 software.
To process the capture data and visualize the data on the displays, three workstations have been used with 4 graphics cards. The setup of the experiment is illustrated in Fig. 2.
Fig. 2. System setup
The software application for designing free form surfaces has been developed in house. It consists of: (i) a module for hand motion based modeling, (ii) a geometric modeling module, which supports creation and manipulation of surfaces, (iii) a module that renders the virtual scene for 2D or 3D devices.
2.2 Participants
24 participants took part in the experiment. They were mostly university students, aged between 19 to 26 years; with different backgrounds in design and engineering (e.g. industrial design, architecture, mechanical engineering). Their experience with computer devices, CAD software, and virtual reality technologies varied between novice, advanced and expert users. The users were asked to perform the same design task three times, with different visual feedback. To avoid effects caused by the first used technique, the participants were divided into three groups: the participants who belong to group A interacted first with the system which includes the holographic display; the ones who belong to group B interacted first with the HMD; and the ones who interacted first with the 2D Screen belong to group C. With each group we tested the learnability of a design method with a different display. Learnability of the method has been tested in the first task, while usability of the method has been measured in all three experiments.
user interaction is referred to as system 3 (system 6), and head mounted display without (with) user interaction is denoted as system 4 (system 7). Fig. 3 shows the different systems graphically.
Fig. 3. Organization of the different systems to be studied
2.3 Procedure
First, the setup and research apparatus were introduced to participants followed by an explanation of the goal of the research, the design tasks, and the sequence of interaction. In addition, the purpose of the pre-test questionnaire and three different post-test questionnaires (one for each interaction) was presented to the participants.
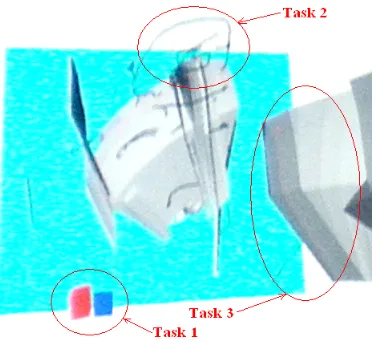
During the experiments, each participant had to interact with all visualization devices in a different order. The order of interaction is shown in Fig. 4. We have taken into account that some of these devices are under development, and therefore, only simple design tasks had to be performed by the users. These simple tasks were: (i) moving a red cube towards a blue square which is randomly situated in the 3D space, Fig. 5; (ii) drawing a planar circle with 10 cm of diameter in XZ plane; (iii) drawing a single surface with the palm.
Before each test, the participants had to fill in the pre-test questionnaire which contained information about their background. After each test, the participants had to fill in three different post-test questionnaires. The post-test
questionnaires were answered using a Likert scale of 5 points where respondents could indicate to what extent he or she agrees with the statements.
Fig. 4. Order of the interactions depending on the type of group the users belong
The variables that were measured are shown in Fig. 1. In the questionnaires, the measured variables are only the independent ones, such as: helpfulness, efficiency, control dimension, learnability, satisfaction and frequency. Then, the arithmetic mean of the helpfulness and the efficiency represents the usefulness, whereas the mean of the control dimension and the learnability represents the ease of use or usability.
Fig. 5. Results of the different task by a participant
the participants towards the devices/systems they have just interacted with. Furthermore, these questions were also used to rate the variables such as the desirability and the frequency.
3 RESULTS AND DATA ANALYSIS
First, we analyzed the results of our study for each device or system separately. The following tables refer to the participants’ results towards each device or system. As explained in Section 2.2, a system is a combination of two complementary devices.
Table 1. Questions from the post-test questionnaire referring only to the display
Question Independent
variable
Dependent variable
1 Learnability EASE OF USE
2 Helpfulness USEFULNESS
3 Efficiency USEFULNESS
4 Affect SATISFACTION
5 Efficiency USEFULNESS
6 Control Dimension EASE OF USE
7 Learnability EASE OF USE
8 Affect SATISFACTION
9 Learnability EASE OF USE
Table 2. Questions from the post-test questionnaire
Questio n
Independent variable
Dependent variable
1 Affect SATISFACTIO
2 Affect SATISFACTIO
3 Control Dimension EASE OF USE
4 Helpfulness USEFULNESS
5 Learnability EASE OF USE
6 Control Dimension EASE OF USE
7 Efficiency USEFULNESS
8 Affect SATISFACTIO
9 Affect SATISFACTIO
Table 3. Questions from the post-test questionnaire referring to the frequency of the whole system
Question Independent Variable
1 Frequency 2 Frequency
Each question from the questionnaires refers to a specific variable as shown in Tables 1
to 3, where the colors indicate the parameters of interest.
The results from the questionnaires are shown in Tables 4 to 9, where the mean value, the standard deviation and the maximum and minimum data referring to each variable is presented.
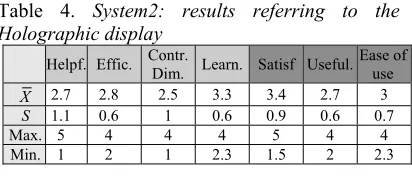
Table 4. System2: results referring to the Holographic display
Helpf. Effic. Contr. Dim. Learn. Satisf Useful. Ease of use
X 2.7 2.8 2.5 3.3 3.4 2.7 3
S 1.1 0.6 1 0.6 0.9 0.6 0.7 Max. 5 4 4 4 5 4 4 Min. 1 2 1 2.3 1.5 2 2.3
Table 5. System 5: results referring to the whole system with the holographic display as output device
Hel. Effic. Contr.Dim Learn Satis Usef Ease use Desir Freq 2.8 2.5 2.3 2.9 3.1 2.7 2.6 2.7 2.4 1.1 1.0 0.9 1.1 0.7 0.8 0.6 0.9 0.6
5 4 4 5 4.3 4 3.5 3.6 4
1 1 1 2 1.5 1.5 1.5 1.2 1.5
Table 6. System 3: results referring to the HMD
Helpful Effic. Contr. Dim. Learn. Satisf Useful. Ease of use 3.0 3.0 2.7 3.5 3.8 3.0 3.1 0.1 0.7 1 0.4 0.7 0.7 0.8 4 4.5 5 4 5 4.3 4
1 2 1 3 2.5 2 2.2
Table 7. System 6: results referring to the whole system with the HMD as output device
Hel. Effic. ContrDim Learn Satis Usef Ease Use Desir. Freq 3.1 2.7 2.8 3.3 3.4 2.9 3.1 3.3 2.8 0.9 1 1 1.0 0.8 0.6 0.9 0.5 0.9
5 4 4 4 4.5 4.5 4 4.1 4.5 2 1 1 1 2 1.5 1.5 2.6 1
Table 8. System 4: results referring to the 2D Screen
Helpful Effic. Contr. Dim. Learn. Satisf Useful Ease of Use 3 3.0 2.8 4 3.5 3.0 3.1
1.0 0.7 1.1 0.5 0.7 0.6 0.4
Although each system is studied individually as shown in the figures, there are also comparisons between different systems. However, all the systems cannot be compared due to incompatibility; only the systems 2 to 4 can be compared and only the displays will be taken into account, whereas the comparison among the systems 5 to 7 refer to systems as a whole.
Table 9. System 7: results referring to the whole system with the 2D Screen as output device
Hel. Effic. Contr Dim Learn Satis Usef Ease Use Desir. Freq 2.9 2.8 2.8 3.5 3.4 2.8 2.9 3.6 2.7 0.8 0.9 1.1 1.1 0.7 0.6 0.6 0.7 0.9 4 4 4 5 4.5 4 4 4.8 4 2 1 1 2 1.8 1.5 2 2.8 1
Table 10. Results of the participants with “design and architecture” background in system 5 (the whole system with the holographic display as output device)
Hel. Effic. Contr Dim Learn Satis Usef EaseUse Desir. Freq 3.2 2.8 2.3 3 3.0 2.7 2 3.5 2.1 1.0 0.8 1.1 - 0.7 0.7 - - 0.5 5 4 4 3 4 4 2 3.5 4 2 1 1 3 1.5 1.5 2 3.5 1
Table 11. Results of the participants who do not have a “design and architecture” background in system 5 (the whole system with the holographic display as output device)
Hel. Effic. Contr Dim Learn Satis Usef Ease Use Desir. Freq 2.9 3.3 2.4 2.6 3.5 3.1 2.6 2.5 2.8 1.1 1.1 1 0.6 0.7 0.9 0.6 0.9 0.7 4 4 3 3.5 4.3 4 3.5 3.6 4 2 1 1 1.5 2.3 1.5 1.5 1.2 2
Secondly, we studied the influence of the background of the participants on the dependent variables (i.e. usefulness, ease of use, satisfaction, desirability and frequency). For the analysis, the participants were divided into two groups: 1) participants with a “design and architecture” background and 2) participants with a non-design background. Another aspect for evaluation was their experience with modeling and CAD tools. There were 7 participants, who had extensive experience with 3D modeling programs and 6 out of the 24 users considered themselves as expert users of 3D displays. The data of these categorizations is shown in the next Tables 10 to
13. For system 5 the whole system is taken into account, with the holographic display as output device. The rest of the systems are evaluated in the same manner.
The comparisons have also been done for participants with common characteristics for different systems.
Fig. 6. Comparisons made in each system individually; the participants who interact first with system 5 belong to group A whereas group B
has interacted first with the HMD and group C with the 2D Screen
system. Fig. 6 shows the comparisons done among the variables for system 5 (where system 5 refers to the whole system with the holographic display as output device). The figure clearly shows that for the participants who belong to group A (starting with system 5) more variables in this first interaction are measured. The lines which contain a number 1 are the comparisons made among the same participants with different variables whereas the lines with number 3 are comparisons made for different people but about the same system.
Table 12. Results of the participants who have had extensive experience with 3D modeling programs on system 5 (the whole system with the holographic display as output device)
Hel. Effic. Contr Dim Learn Satis Usef Ease Use Desir. Freq 3 2 2.2 2 2.9 2.5 1.5 1.2 2.2 1.6 0.6 1 - 0.7 1 - - 0.4
5 3 4 2 4 4 1.5 1.2 2.5
1 1 1 2 2.3 1.5 1.5 1.2 1.5
Table 13. Results of the participants who considered themselves experts users of 2D, 2.5D and 3D displays on system 5 (the whole system with the holographic display as output device)
Hel. Effic. Contr Dim Learn Satis Usef Ease Use Desir. Freq 3.4 2.3 2.4 2 3.1 2.9 2 2.4 2.1 1.1 1 1 0 0.8 1 0.7 1.7 0.4
5 4 4 2 4.3 4 2.5 3.6 2.5
2 1 1 2 2.3 1.5 1.5 1.2 1.5
The differences in answers for participants with different characteristics are also studied (always grouped by the same device/system, otherwise it is difficult to draw conclusions).
4 DISCUSSION
The most important results obtained from the data analysis are: (i) The holographic displays are considered to be much more utilizable than useful (p = 0.017) which means that they are easier to work with than being efficient or helpful; (ii) The three systems as a whole are considered to be too primitive for a current implementation in a design company according to the users. Furthermore, graduated people are more reluctant to accept these new devices than the students. In fact, the students rank learnability
of the holographic display significantly higher than graduated people (p = 0.055); (iii) in addition to this, students found the 2D screen significantly more satisfying than graduated people (p = 0.004);
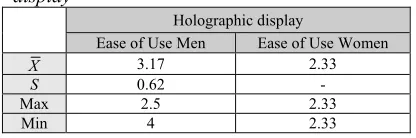
(iv) people who use drawing/modeling programs regularly or who are familiar with different in-put/output devices believe that the HMD’s are a logical future step; as an example, the participants who use many drawing or modeling programs give higher usefulness score to the HMD than to the other devices (p = 0.075); (v) furthermore, participants who use drawing or modeling programs rate the 2D Screen significantly easier to learn than the HMD or the Holographic display (p = 0.071); (vi) there is al-most no difference among people who have a basic, intermediate or expert level in the programs they use; (vii) one of the surprises of the research is that men and women rate the displays differently: men found it significantly easier to use the holographic display in comparison to women (p = 0.044) whereas according to women, the device which is easier to use (p = 0.150) and is more useful (p = 0.054) is the HMD;
(viii) last but not least, the rates referring to the HMD are more extreme than the other displays, which is caused by good or bad head tracking (input device).
Table 14. Results of the learnability and the satisfaction variables of students and graduated people referring to the holographic display and the 2D Screen display respectively
Holographic display 2D Screen Display Learnab.
Students Graduated Learnab. Students Satisf. Graduated Satisf.
X 3.4 2 3.6 2.75
S 1.14 - 0.59 0.66
Max 5 2 4.5 3.5
Min 2 2 2.25 1.75
Table 15. Results of the ease of use variable of men and women referring to the holographic display
Holographic display
Ease of Use Men Ease of Use Women
X 3.17 2.33
S 0.62 -
Max 2.5 2.33
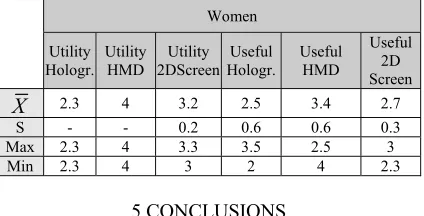
Table 16. Results for women when interacting with the three devices referring to the utility or ease of use and the usefulness
Women Utility
Hologr. Utility
HMD Utility 2DScreen
Useful Hologr.
Useful HMD
Useful 2D Screen
X 2.3 4 3.2 2.5 3.4 2.7
S - - 0.2 0.6 0.6 0.3
Max 2.3 4 3.3 3.5 2.5 3
Min 2.3 4 3 2 4 2.3
5 CONCLUSIONS
One of the most significant conclusions is that the participants felt generally satisfied and indicated a high desirability towards the three systems. However, they all agreed that the three displays need more development because currently they are not useful neither easy to use. Furthermore, the participants provided feedback that clearly shows that they do not see an implementation of these devices in a design company in the near future (5 years). As [14] explains, from a practical point of view, these kind of devices or displays can be currently regarded as “eye candy”.
Another interesting conclusion that can be obtained from this study is that it seems that most experts in this field (people who have more familiarity with these kinds of devices or the ones who use many drawing/modeling programs) believe that HMD has more potential compared to the Holographic display and the 2D Screen. However, they do not seem to be very satisfied with what the HMD currently offers. “Experts” in this field might be the only ones able to see the potential of the HMD. An interesting observation is that the 3D effect might have only appeared with experienced user who did not have the initial learning curve and were able to see its utility [14]; in other words, the novice users are unable to see the added value of the HMD.
The third conclusion is connected to the holographic display. It is a device that the participants in general felt least satisfied with. The reason for that can be found in the intended purpose of use that these devices have been designed for. The display is designed for watching 3D models from a distance of 2 to 7 m. In our experiment all user were standing in front of the screen within a distance of 70 cm. In this range the observed image was a little blurry,
which has influenced the experience of the users. This suggests that it needs more development and that the depth sensation should be more significant. The novice should feel and understand the difference in dimensions in visual perception so that they do not fail to learn [15].
According to this study, the knowledge level of this type of solution for the user does not seem to make significant differences among the studied variables. This conclusion is significant because it shows that this type of HCI is not influenced by the skill level of the participant since the punctuation of the variables is similar for all the participants.
This research has shown that there is a difference between men and women with regards to which display they prefer. In fact, men seem to prefer the holographic display whereas women opt for the HMD. This can of course be a statistical anomaly because the percentage of “expert” women on these technologies is higher than the men “experts”. However, as the paper from [15] states, women suffer at first from a lack of confidence which makes them need more time to understand the technology. Therefore, if they prefer the HMD, it could mean that it is a more intuitive device where they do not need extra time to understand it in order to feel confident with it.
The research shows that the hypothesis about the higher dimension in visual perception has a consequence of a better perceived ease of use or an easier learnability is not entirely true although the experts seem to prefer the HMD compared to the holographic or the 2D Screen. However, the holographic display was the worst ranked generally and according to the hypothesis, it should have been better ranked than the 2D Screen. There are indications that the HMD and Holographic display which have been analyzed are on the better side of intuitive HCI compared to the current 2D screen. Yet, the devices which favor a more intuitive HCI should be much more developed if they want to replace the current devices.
can be used [16] which means that the hypotheses can be tested with more certainty.
Important aspects that should be improved regarding the holographic display are (i) the perception of the depth in case the user is standing in close proximity of the display; (ii) not only the horizontal parallax but also the vertical parallax should be implemented [14] (iii) blurriness of the image should be un-noticeable from a distance of 70 cm, and (iv) shape distortion and its dependency on the location of virtual objects [17].
With regards to the HMD, the following improvements should be performed.: (i) better visualization, (ii) being able to visualize the participants’ whole body and not just the hand to give a more realistic feeling to the user, (iii) better interfaces with a more realistic rendering of the hand/body, (iv) more ergonomic and more comfortable, (v) a more robust display and (vi) an unseeing technology among other things.
Finally, possible improvement options for future 2D Screen Display are: (i) a better interface and (ii) a more complete immersion in the VR world.
6 REFERENCES
[1] Dillon, A. (2001). Usability evaluation. In: Karwowski, W. (ed.). Encyclopedia of Human Factors and Ergonomics, Taylor and Francis, London.
[2] Davis, F.D. (1993). User acceptance of information technology. International Journal of Man Machine Studies, vol. 38, p. 475-487.
[3] Davis, F.D. (1989). Perceived usefulness, perceived ease of use, and user acceptance of information technology. MIS Quarterly, September, 13th, p. 319-340.
[4] Santos, P.J., Badre, A.N. (1995). Discount learnability evaluation. GVU Technical Report GITGVU-95-30, Georgia Institute of Technology.
[5] Cook, D.J., Metcalf, H.E., Bailey, B.P. (2005). SCWID: A tool for supporting creative work in design. UIST - Adjunct Proceedings of the 18th annual ACM Symposium on User Interface Software and Technology, Seattle, poster 7.
[6] Dillon, A. (2001). Usability evaluation. In: Karwowski, W. (ed.). Encyclopedia of
Human Factors and Ergonomics, Taylor and Francis, London.
[7] Zheng, J.M., Chan, K.W., Gibson, I. (2001). Desktop virtual reality interface for computer aided conceptual design using geometric techniques. Journal of Engineering Design, vol.12, no. 4, p. 309-329.
[8] Balogh, T., Kovács, P.T., Dobrányi, Z., Barsi, A., Megyesi, Z.G.Z., Balogh, G. (2008). The holovizio system – new opportunity offered by 3D displays.
Proceedings of the TMCE, p. 79-89.
[9] Demiralp, C., Jackson, C.D., Karelitz, D.B., Zhang, S., Laidlaw, D.H. (2006). CAVE and fishtank virtual-reality displays: A qualitative and quantitative comparison.
Visualization and Computer Graphics, IEEE Transactions, vol. 12, no. 3, p. 323-330. [10] Dinh, H.Q., Walker, N., Song, C.,
Kobayashi, A., Hodges, L.F. (1999). Evaluating the importance of multi-sensory input on memory and the sense of presence in virtual environments. Proceedings of the IEEE Virtual Reality, p.222-228.
[11] Kaufmann, H., Dünser, A. (2005). Summary of usability evaluations of an educational augmented reality application. Virtual Reality, vol. 4563, p. 660-669
[12] Santos, B.S., Dias, P., Silva, S., Capucho, L., Salgado, N., Lino, F., Carvalho, V. Ferreira, C. (2008). Usability evaluation in virtual reality: a user study comparing three different setups. Proceedings of the EGVE Symposium, p. 21-24.
[13] Tory, M., Kirkpatrick, A.E., Atkins, M.S., Möller, T. (2006). Visualization task performance with 2D, 3D, and combination displays. IEEE Transactions on Visualization and Computer Graphics, vol. 12, no. 1, p. 2-13.
[14] Risden, K., Czerwinski, M.P., Munzner, T., Cook, D.B. (2000). An initial examination of ease of use for 2D and 3D information visualizations of web content. International Journal of Human-Computer Studies, vol. 53, no. 5, p. 695-714.
[16] Heijnen, P.W. (2008). Research Methods and Data Analysis. Technische Universiteit, Delft.
[17] Horváth, I., Opiyo, E.Z. (2007). Qualitative analysis of the affordances of the three-dimensional imaging systems with a view to
![Fig. 1. Technology acceptance model (TAM) [2]](https://thumb-us.123doks.com/thumbv2/123dok_us/8952565.1861933/2.539.55.259.71.446/fig-technology-acceptance-model-tam.webp)