AGRONOMY AND SOILS
Performance of Cotton Agrochemicals when Spray Solution Application is Delayed
Peter M. Eure, David L. Jordan*, Jack S. Bacheler, Alan C. York, Loren R. Fisher, and Randy Wells
P.M. Eure, D.L. Jordan*, A.C. York, L.R. Fisher, and R. Wells, Department of Crop Science North Carolina State University, Box 7620, Raleigh, NC 27695-7620; J.S. Bacheler, Department of Entomology, North Carolina State University, Box 7613; Raleigh, NC 27695-7613
*Corresponding author: [email protected] ABSTRACT
When agrochemical spray solutions are pre-pared, unforeseen circumstances can prevent spray solution application, resulting in agrochemical remaining in the spray tank for 1 or more days. Information about the impact of delayed appli-cations on agrochemical performance is limited. Experiments were conducted in 2009 and 2010 to determine the effect of delayed spray applications
on efficacy of defoliants, insecticides, and plant
growth regulators commonly applied to cotton. Each agrochemical was mixed individually on the day of application and 3, 6, and 9 d prior to tion using the same water source, and all applica-tions were made on the same day. Defoliation by ethephon and thidiazuron was affected when prod-ucts were left in solution for extended periods of
time. Efficacy of ethephon, indoxacarb, methomyl, spinosad, and thidiazuron was influenced when
spray solution application was delayed, whereas
efficacy of acephate, carfentrazone, diuron plus
thidiazuron, ethephon plus cyclanalide, indoxa-carb, lambda-cyhalothrin, lambda-cyhalothrin plus thiamethoxam, methomyl, thiadiazuron, and thiodicarb was not affected by mixing interval.
When changes in efficacy occurred, the magnitude
of the effect was relatively minor and most likely
would be of little biological significance.
D
efoliants, insecticides, and plant growth regulators are commonly used in cotton production. Tobacco thrips (Frankliniella fusca Hinds), heliothinae— comprised of the tobacco budworm (Heliothis virescensF.) and the bollworm (Helicoverpa zea Boddie)—, green stink bugs (Acrosternum hilare Say), and brown stink bugs (Euschistus servus Say) are major insect pests in cotton that can reduce yield and lint quality (Leonard
et al., 1999). Tobacco thrips are sucking pests and are especially troublesome early in the season when plants are young and susceptible to injury. Thrips feeding results in chlorosis, necrosis, and plant deformation and subsequent maturity delays and yield loss (Leonard et al., 1999). Seed treatments, in-furrow insecticides, and foliar-applied insecticides are used to control tobacco thrips (Cook et al., 2003). Bollworms and tobacco budworms burrow into cotton squares and bolls causing squares to abort and bolls to rot (Bell, 1999; Leonard et al., 1999). Control of the heliothinae might include using transgenic cotton containing Cry1A(c) plus Cry2A(b)2 (Bollgard II) and Cry1A(c) plus Cry1F (Widestrike) genes for Bacillus thuringiensis (Bt) endotoxin production, chemical control, or a combination of these methods (Hamilton et al., 2004). Stink bug feeding might cause young bolls to abort and stain the lint of older bolls or transmit organisms that cause boll rot and hard lock (Bell, 1999). Stink bugs might not be
problematic in fields where insecticides have been
applied (Bacheler, 2010; Leonard et al., 1999). Cotton plant growth regulators reduce vegetative growth, increase fruit retention, and might lead to increased lint yield (Cothren and Oosterhuis, 2010; Edmisten, 2010a; Silvertooth et al., 1999). Mepiquat chloride and mepiquat pentaborate are commonly used cotton plant growth regulators. Mechanization of cotton harvesting increased the need for cotton de-foliation prior to harvest. Without adequate defolia-tion, mechanical harvesters might take in excessive leaf and plant parts resulting in cotton lint staining (Crawford et al., 2001).
When agrochemical spray solutions are prepared, unforeseen circumstances such as wind, rain, and equipment failure can prevent spray solution applica-tion, resulting in agrochemical remaining in the spray tank for 1 d or more. There is little published research
concerning agrochemical efficacy when left in spray
solution for extended periods of time. It is possible that
agrochemicals could be influenced when they remain
dicamba plus atrazine, isoxaflutole plus atrazine, and
rimsulfuron plus S-metolachlor plus dicamba mixed 1 or more d prior to application resulted in reduced weed control (Stewart et al., 2009). When left in spray
solution for extended periods of time, the efficacy of
agrochemicals used in cotton is poorly understood. Therefore, the objective of this research was to
deter-mine the effect of mixing interval on efficacy of cotton
defoliants, insecticides, and plant growth regulators commonly applied to cotton.
MATERIALS AND METHODS
General methodology. Field experiments were conducted in North Carolina during 2009 and 2010 at the Peanut Belt Research Station near Lewiston-Woodville and the Upper Coastal Plain Research Station near Rocky Mount. Soil at Rocky Mount was
a Norfolk loamy sand (fine-loamy, kaolinitic, ther -mic Typic Kandiudults); soil at Lewiston-Woodville
was a Goldsboro sandy loam (fine-loamy, siliceous,
subactive, thermic Aquic Paleudults). Insecticides, plant growth regulators, and defoliants were mixed individually the day of application or 3, 6, and 9 d prior to application, unless otherwise noted. Spray solutions were mixed in plastic spray bottles (3 L volume), sealed for storage in the dark at room temperature, and were agitated every third day to bring agrochemicals back into solution. A municipal supply of water in Wake County, NC was used with a pH of 6.7, hard-ness of 31 ppm, and concentrations of boron, calcium, magnesium, and zinc of 0.04, 7.3, 0, and 0.06 ppm, respectively. On the day of application, agrochemicals were agitated thoroughly to ensure uniform spray so-lutions. Plant growth regulators and defoliants were applied using a CO2-pressurized backpack sprayer
equipped with DG11002 nozzles(Spraying Systems Co., Wheaton, IL) spaced 45 cm apart and calibrated to apply 140 L/ha at 210 kPa. Insecticides were applied using a CO2-pressurized backpack sprayer
equipped with a TX-8 nozzle(Spraying Systems Co.) calibrated to apply 75 L/ha at 345 kPa.
Plot size was two rows (91-cm spacing) by 9 m in conventional tillage using raised seed beds. Produc-tion and pest management practices other than
spe-cific treatments followed North Carolina Cooperative
Extension Service recommendations and were held constant over the entire experiment. Seed cotton yield was determined in some, but not all, experiments. The experimental design was a randomized complete block with treatments replicated three or four times.
Data for all parameters were subjected to analysis of variance (ANOVA) using the PROC GLM procedure in SAS (SAS Institute Inc., Cary, NC).Although in-cluded in all experiments, non-treated controls were not included in the statistical analysis. The treatment of agrochemicals applied the same day solutions were prepared was considered the most appropriate control to compare other treatments. However, data for the non-treated control are provided as an indication of pest damage and levels in absence of pest control or cotton growth without management inputs. Means of
significant main effects and interactions were sepa -rated using Fisher’s Protected LSD test at p ≤ 0.05.
Thrips control. In 2010, tobacco thrips control using acephate(®Orthene 97; Amvac Chemical Corp.,
Los Angeles, CA) applied at 280 g ai/ha was
evalu-ated in two separate fields at both Rocky Mount and
Lewiston-Woodville (four sites). Cotton cultivars DP 0920 B2RFand DP 0912 B2RF (Monsanto Company, St. Louis, MO) were planted at Rocky Mount and Lewiston-Woodville, respectively, without an in-furrow insecticide or insecticidal seed treatment to increase thrips establishment. Visual estimates of damage from tobacco thrips feeding were recorded 10 and 20 d after treatment (DAT) using a 0-5 ordinal scale where 0 = no damage, 1 = noticeable feeding but no stunting, 2 = noticeable feeding and 25% stunting, 3 = feeding with blackened terminals and 50% stunting, 4 = severe feed-ing and 75% stuntfeed-ing, and 5 = severe feedfeed-ing and 90%
stunting (Carley et al., 2009). Additionally, five cotton
plants per plot were collected 5 and 10 DAT and gently placed into glass jars with 250 ml of water and 1.0 ml of detergent (®Palmolive Original; Colgate-Palmolive
Company, New York, NY) and sealed for transportation to the laboratory. Following gentle agitation for 20 sec, solutions were decanted onto a 250 µm mesh screen
(U.S. standard sieve; Fisher Scientific, Pittsburgh, PA).
Jars and lids were then rinsed onto the screen thoroughly to remove any remaining thrips. Plants were thoroughly rinsed to separate thrips from plants. Thrips and small sediment were collected on the mesh screen and rinsed from the screen through a funnel into 25-ml vials using 70% isopropyl alcohol. Excess alcohol was decanted from the vials and remaining solution, thrips, and sediment were then poured onto a gridded petri dish
(Fisher Scientific) and examined using a microscope (10X by 44X Stereoscope; Fisher Scientific). The
number of nymphs and adult thrips were recorded for each sample. Seed cotton yield was also determined by
harvesting each plot using a spindle picker modified
Bollworm control. Bollworm control was evalu-ated during 2009 and 2010 at Rocky Mount using a non-Bt cotton cultivar(®DP 174 RF; Monsanto
Company, St. Louis, MO). Indoxacarb (®Steward EC insecticide; DuPont Agricultural Products Company, Wilmington, DE) was applied at 1100 g ai/ha,
lambda-cyhalothrin(®Karate with Zeon Technology
insec-ticide; Syngenta Crop Protection, Inc., Greensboro, NC) was applied at 30 g ai/ha, lambda-cyhalothrin plus thiamethoxam(®Endigo ZC insecticide;
Syn-genta Crop Protection, Inc.) was applied at 25 g ai/ha plus 19 g ai/ha, methomyl(®Lannate LV insecticide;
DuPont Agricultural Products Companywas applied at 490 g ai/ha, spinosad(®Tracer Naturalyte Insect
Control; Dow AgroSciences, Indianapolis, IN) was applied at 70 g ai/ha, and thiodicarb(®Larvin brand
3.2 insecticide/ovicide; Bayer CropScience, Research Triangle Park, NC) was applied at 840 g ai/ha. Each insecticide was prepared the day of application and 1, 3, or 7 d prior to application. Insecticides were applied when bollworm eggs or small larvae were found on fruiting structures based on Cooperative Extension Service threshold recommendations (Bacheler, 2010).
Twenty-five bolls and 25 squares were removed from
each plot 5 DAT and examined for damage and live bollworms. Cotton yield was not determined in this experiment. Data for damaged bolls and squares and live bollworms on bolls and squares were subjected to ANOVA for a six (insecticide) by four (mixing interval) factorial treatment arrangement.
Cotton response to plant growth regulators.
Mepiquat chloride (®Pix Plus plant regulator; BASF
Corp., Research Triangle Park, NC) was applied at 30 g ai/ha and mepiquat pentaborate (®Pentia plant
regulator; BASF Corp.) was applied at 1100 g ai/ha and evaluated during 2009 at Rocky Mount and during
2010 in two separate fields at Rocky Mount to deter
-mine the influence of delayed applications of spray
solution on performance of these plant growth regula-tors. Mepiquat chloride and mepiquat pentaborate were applied to actively growing cotton with a height of 50 to 60 cm and internode length of at least 6 cm based on Cooperative Extension Service recommendations (Edmisten, 2010b). Plant height and the number of
nodes were recorded from five plants per plot 10 and
20 DAT and used to calculate the height/node ratio. Cotton yield was recorded as previously described.
Cotton response to defoliants. Efficacy of the
defoliants carfentrazone(®Aim EC; FMC Corporation,
Philadelphia, PA) was applied at 20 g ai/ha, diuron plus thidiazuron(®Ginstar EC; Bayer CropScience)
was applied at 50 g ai/ha plus 100 g ai/ha, respectively, ethephon(®Prep; Bayer CropScience) was applied
at 1680 g ai/ha, ethephon plus cyclanalide(®Finish 6
Pro; Bayer CropScience) was applied at 1370 g ai/ha plus 90 g ai/ha, respectively, and thidiazuron(®Dropp
SC; Bayer CropScience was applied at 1700 g ai/ha. Defoliants were compared in one experiment during 2009 at Lewiston-Woodville on the cotton cultivar DP 0912 B2RF and during 2010 in Rocky Mount on the cotton cultivar DP 0942 B2RF(Monsanto Company, St. Louis, MO). Defoliants were applied when 50 to 60% of bolls were cracked, based on Coopera-tive Extension Service recommendations (Edmisten, 2010b). Visual estimates of percent defoliation of cotton foliage were recorded 10 DAT using a scale of 0 to 100, where 0 = no canopy defoliation and 100 = all leaves removed from plants. Cotton yield was also determined as described previously.
RESULTS AND DISCUSSION
Thrips control. The main effect of mixing in-terval and the interaction of experiment by mixing
interval were not significant for visual estimates of
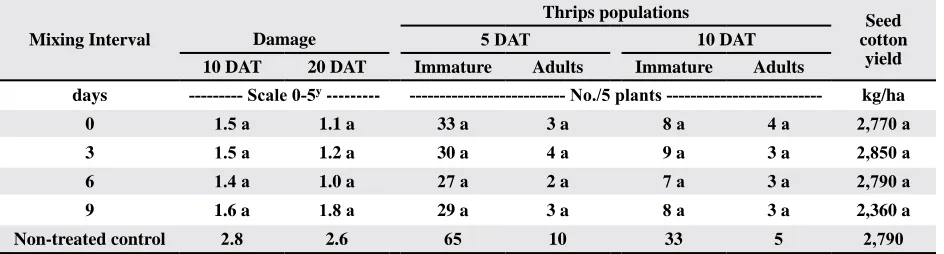
tobacco thrips damage 10 and 20 DAT, populations of immature and adult tobacco thrips 5 and 10 DAT, and seed cotton yield (Table 1). This analysis did not include the non-treated control because the treat-ment associated with applying solutions the day of mixing was considered the more appropriate control. However, thrips damage to cotton seedlings and relatively higher populations of thrips were noted in non-treated controls (Table 2). The numerical differ-ences between cotton yield when acephate was ap-plied compared with when acephate was not apap-plied were relatively small (Table 2). Delayed applications of acephate spray solution mixed up to 9 d prior to
application did not influence thrips damage at 10
and 20 DAT, thrips populations at 5 and 10 DAT, and seed cotton yield. Previous research has shown that acephate controls tobacco thrips when applied timely before prolonged feeding by thrips (Leonard et al., 1999). Also, yield response to tobacco thrips damage
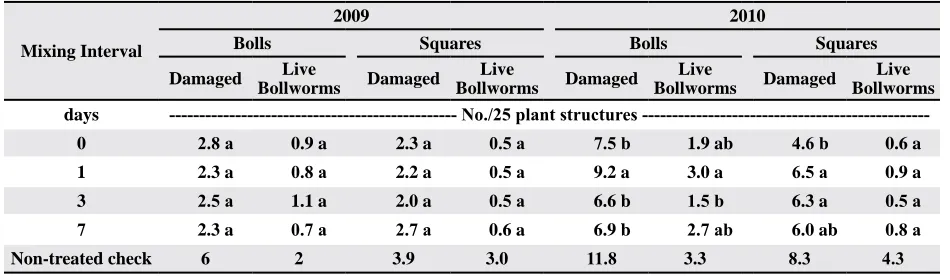
affected by mixing interval in 2009 (Table 5). How-ever, differences in damaged bolls and squares and live bollworms associated with damaged bolls were noted among mixing intervals in 2010 (Table 5). The number of damaged bolls was higher when insecti-cide solutions were prepared 3 d prior to application compared with application the day of mixing or 6 and 9 d after mixing (Table 5). No difference in live bollworms associated with bolls was noted when comparing solutions prepared on the same day with those prepared 1, 3, or 7 d prior to application (Table 5). In contrast, mixing insecticides 1 or 3 d prior to application resulted in a higher number of damaged squares compared with applying solutions on the same day of mixing (Table 5). Although not included in the statistical analysis, damage from bollworms on both bolls and squares as well as populations of bollworms associated with these fruiting structures were relatively high compared to measurements as-sociated with non-treated cotton.
Bollworm control. The interaction of experiment
by insecticide by mixing interval was not significant
for damaged bolls and live bollworms on bolls 5 DAT (Table 3). However, interactions of experiment by
mix-ing interval and experiment by insecticide were signifi -cant for these parameters (Table 3). The interaction of
insecticides by mixing interval also was significant for
damaged bolls but not live bollworms. The interaction of experiment by insecticide by mixing interval was
significant for damaged squares and live bollworms
associated with squares (Table 3). When analyzed by
year, the main effect of insecticide was significant for
damaged squares during both years (Table 4). However, the interaction of insecticide by mixing interval was
not significant for damaged squares during both years
and live bollworms in 2009 (Table 4). The interaction
of insecticide by mixing interval was significant for
live bollworms in 2010 (Table 4).
The number of damaged bolls and live boll-worms associated with bolls and squares was not
Table 1. P > F for visual estimates of tobacco thrips damage 10 and 20 DAT, thrips counts per five plants 5 and 10 DAT, and
seed cotton yield when application of acephate was delayed for 3, 6, and 9 d after solution preparation or applied the day of solution preparation.
Source
Thrips populations
Seed cotton
yield
Thrips damage 5 DAT 10 DAT
10 DAT 20 DAT Immature Adults Immature Adults
---p value
---Experiment (Exp) <0.0001 0.5928 <0.0001 0.0001 <0.0001 <0.0001 <0.0001
Mixing interval (Interval) 0.6884 0.4962 0.6470 0.5377 0.7929 0.5715 0.5559
Exp * Interval 0.2814 0.6875 0.4181 0.9389 0.8462 0.3909 0.4425
Coefficient of variation (%) 26.4 105.4 37.3 108.3 53.3 89.6 27.1
No. of experiments 4 4 4 4 4 4 4
Table 2. Visual estimates of tobacco thrips damage 5 and 10 DAT, populations of immature and adult tobacco thrips 10 and 20 DAT, and seed cotton yieldz.
Mixing Interval
Thrips populations
Seed cotton
yield
Damage 5 DAT 10 DAT
10 DAT 20 DAT Immature Adults Immature Adults
days --- Scale 0-5y --- --- No./5 plants --- kg/ha
0 1.5 a 1.1 a 33 a 3 a 8 a 4 a 2,770 a
3 1.5 a 1.2 a 30 a 4 a 9 a 3 a 2,850 a
6 1.4 a 1.0 a 27 a 2 a 7 a 3 a 2,790 a
9 1.6 a 1.8 a 29 a 3 a 8 a 3 a 2,360 a
Non-treated control 2.8 2.6 65 10 33 5 2,790
z Means within a column followed by the same letter are not different at p ≤ 0.05. Data for non-treated cotton were not
included in the analysis. Data are pooled over four experiments.
y Ordinal scale where 0 = no damage, 1 = noticeable feeding but no stunting, 2 = noticeable feeding and 25% stunting, 3
When comparing among insecticides, the
ef-ficacy of lambda-cyhalothrin, lambda-cyhalothrin
plus thiamethoxam, and thiodicarb was not affected by mixing interval with respect to the number of live bollworms associated with squares in 2010 (Table 6). However, applying indoxacarb prepared 7 d prior to application resulted in a higher number of live bollworms per 25 squares compared with application the day of mixing (Table 6). Methomyl
spray solution prepared 1 d prior to application resulted in a higher number of bollworms when compared with spray solution prepared the day of application and 3 or 7 d prior to application (Table 6). In contrast, application of spinosad prepared 1 d prior to application resulted in fewer bollworms when compared to spinosad spray solutions prepared the day of application (Table 6). Although sporadic
differences were noted when comparing efficacy of
Table 3. P > F for damage and live bollworms found on cotton bolls and squares 5 DAT.
Source
Fruiting structures
Bolls Squares
Damaged Live bollworms Damaged Live bollworms
p value
---Experiment (Exp) <0.0001 <0.0001 <0.0001 0.2022
Mixing Interval (Interval) 0.0337 0.3059 0.2073 0.7417
Insecticide (Insct) 0.0017 0.0055 0.0044 0.2379
Interval*Insct 0.0232 0.4484 0.6116 0.2459
Exp*Interval 0.0051 0.0124 0.1026 0.5372
Exp*Insct <0.0001 0.0344 <0.0001 0.2563
Exp*Insct*Interval 0.0954 0.3657 0.0218 0.0161
Coefficient of variation (%) 42.8 97.4 55.2 136.3
No. of experiments 2 2 2 2
Table 4. P > F for damage and live bollworms found on cotton squares 5 DAT.
Source
Cotton squares
2009 2010
Damaged Live bollworms Damaged Live bollworms
p value
---Mixing Interval (Interval) 0.6473 0.9177 0.0783 0.4300
Insecticide (Insct) 0.0059 0.3385 0.0002 0.1961
Interval*Insct 0.4069 0.2747 0.1074 0.0267
Coefficient of variation (%) 75.3 150.2 45.6 125.3
Table 5. Influence of mixing interval on damaged fruit and live bollworms 5 DATz.
Mixing Interval
2009 2010
Bolls Squares Bolls Squares
Damaged Live
Bollworms Damaged
Live
Bollworms Damaged
Live
Bollworms Damaged
Live Bollworms
days No./25 plant structures
---0 2.8 a 0.9 a 2.3 a 0.5 a 7.5 b 1.9 ab 4.6 b 0.6 a
1 2.3 a 0.8 a 2.2 a 0.5 a 9.2 a 3.0 a 6.5 a 0.9 a
3 2.5 a 1.1 a 2.0 a 0.5 a 6.6 b 1.5 b 6.3 a 0.5 a
7 2.3 a 0.7 a 2.7 a 0.6 a 6.9 b 2.7 ab 6.0 ab 0.8 a
Non-treated check 6 2 3.9 3.0 11.8 3.3 8.3 4.3
z Means within a column followed by the same letter are not different according to Fisher’s Protected LSD test at p ≤ 0.05.
insecticides mixed at different intervals, populations ranged from 0.1 to 1.4 bollworms per 25 squares with insecticide treatment compared with 3 to 4.3 bollworms per 25 squares when insecticide was not applied. Consequently, differences noted among insecticide treatments most likely are of no
biologi-cal significance.
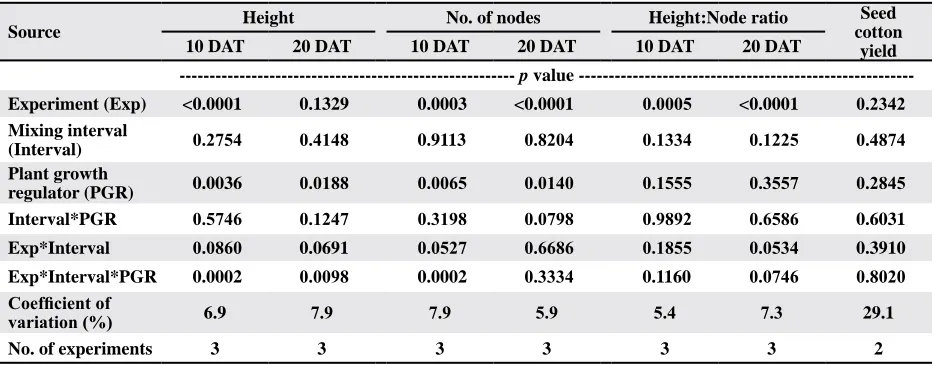
Plant growth regulator performance. Cot-ton height 10 and 20 DAT and number of nodes
10 DAT were influenced by the interaction of
experiment by mixing interval by plant growth regulator (Table 7). The number of nodes 20 DAT was affected by plant growth regulator but not by interaction of plant growth regulator and mixing interval (Table 7). Height:node ratio was not af-fected by plant growth regulator or mixing interval treatments (Table 7).
When analyzed by experiment, the main effect of mixing interval and plant growth regulator by
mix-ing interval was not significant for plant height and
the number of nodes 10 and 20 DAT regardless of experiment (Table 8). The interaction of experiment by mixing interval by plant growth regulator occurred because of differences in plant growth regulator per-formance at Lewiston-Woodville and Rocky Mount irrespective of mixing interval (Table 8). Height 20 DAT and number of nodes 10 and 20 DAT differed when comparing growth regulators (Table 9). Cotton height 20 DAT was 11 cm shorter when mepiquat chloride was applied compared to mepiquat pentabo-rate (Table 9). Similar results were not observed for plant height 10 DAT. Treatments including mepiquat chloride had 1.2 and 0.8 fewer nodes than mepiquat pentaborate 10 and 20 DAT, respectively.
Table 6. Interaction between insecticide and mixing interval on number of live bollworms per 25 squares 5 DAT at Rocky Mount during 2010z.
Insecticide
Live bollworms
Number of days mixed prior to application
0 1 3 7
No./25 squares
---Indoxacarb 0.1 e 0.4 cde 0.4 cde 1.0 abc
Lambda-cyhalothrin plus thiamethoxam 0.9 a-d 1.1 ab 0.9 a-d 0.8 a-d
Lambda-cyhalothrin 0.4 cde 0.5 b-e 0.5 b-e 0.5 b-e
Methomyl 0.3 de 1.4 a 0.4 cde 0.4 cde
Spinosad 1.0 abc 0.3 de 0.8 b-e 1.0 abc
Thiodicarb 0.8 a-d 0.5 b-e 0.4 cde 0.5 b-e
Non-treated control 4.3 -
-z Means followed by the same letter are not different according to Fisher’s Protected LSD at p ≤ 0.05. Data for the
non-treated control were not included in the analysis.
Table 7. P > F for cotton plant height, number of nodes, and height to node ratio 10 and 20 DAT as influenced by experiment,
mixing interval, and plant growth regulator treatment.
Source Height No. of nodes Height:Node ratio
Seed cotton
yield
10 DAT 20 DAT 10 DAT 20 DAT 10 DAT 20 DAT
p value
---Experiment (Exp) <0.0001 0.1329 0.0003 <0.0001 0.0005 <0.0001 0.2342
Mixing interval
(Interval) 0.2754 0.4148 0.9113 0.8204 0.1334 0.1225 0.4874
Plant growth
regulator (PGR) 0.0036 0.0188 0.0065 0.0140 0.1555 0.3557 0.2845
Interval*PGR 0.5746 0.1247 0.3198 0.0798 0.9892 0.6586 0.6031
Exp*Interval 0.0860 0.0691 0.0527 0.6686 0.1855 0.0534 0.3910
Exp*Interval*PGR 0.0002 0.0098 0.0002 0.3334 0.1160 0.0746 0.8020
Coefficient of
variation (%) 6.9 7.9 7.9 5.9 5.4 7.3 29.1
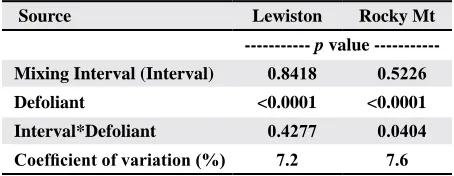
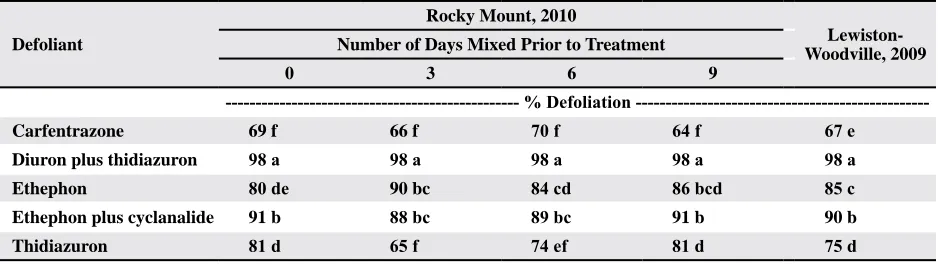
Defoliant performance. Cotton defoliation was
influenced by the interaction of experiment by mix -ing interval by defoliant (Table 10). When analyzed by experiment, the interaction of mixing interval and
defoliant was significant at Rocky Mount but not at
Lewiston-Woodville (Table 11). At Rocky Mount
during 2010, thidiazuron and ethephon efficacy were sporadically influenced by mixing interval (Table 12).
Defoliation was 10% greater using the 3-d mix of ethephon than the solution mixed the day of applica-tion (Table 12). Defoliaapplica-tion using thidiazuron mixed the day of application and 6 and 9 d prior to applica-tion had 7 to 16 percentage points higher defoliaapplica-tion then thidiazuron mixed 3 or 6 d prior to application (Table 12). When comparing defoliant performance when solutions were prepared the day of application at Rocky Mount and Lewiston-Woodville, diuron plus thidiazuron was the more effective defoliant, resulting in 98% defoliation (Table 12). Ethephon plus cyclanalide defoliated cotton 90 to 91% and was more effective than ethephon or thidiazuron alone (Table 12). Carfentrazone was the least effec-tive defoliant in both experiments (Table 12). Seed cotton yield was not affected by defoliant treatments regardless of product or mixing interval (Table 10).
Table 8. P > F for cotton plant height and number of nodes 10 and 20 DAT as influenced by mixing interval and plant growth
regulator.
Source
Lewiston-Woodville Rocky Mount
10 DAT 20 DAT 10 DAT 20 DAT
Height Nodes Height Nodes Height Nodes Height Nodes
p value ---Mixing Interval
(Interval) 0.0896 0.2294 0.0678 0.9094 0.2358 0.2621 0.3867 0.6593
Plant growth
regulator (PGR) <0.0001 <0.0001 0.0001 0.0014 0.2679 0.1598 0.4353 0.6237
Interval*PGR 0.1914 0.1264 0.3955 0.1672 0.6210 0.9412 0.2408 0.3094
Coefficient of
variation (%) 6.3 4.9 7.8 5.5 8.0 6.0 9.7 6.7
Table 9. Influence of plant growth regulator on plant height and number of nodes 10 and 20 DATz.
Source
Rocky Mount, 2010
Lewiston-Woodville, 2009 Field 1 Field 2
Height Nodes Height Nodes Height Nodes
10 DAT 20 DAT 10 DAT 20 DAT 10 DAT 20 DAT 10 DAT 20 DAT 10 DAT 20 DAT 10 DAT 20 DAT
--- cm --- --- No. --- --- cm --- --- No. --- --- cm --- No. ---Mepiquate
chloride 54 a 62 b 10.2 b 12.0 b 65 a 66 a 11.6 a 13.7 a 67 a 68 a 11.7 a 13.1 a
Mepiquat
pentaborate 64 a 71 a 11.4 a 12.8 a 63 a 64 a 11.3 a 13.6 a 65 a 67 a 11.6 a 13.2 a
Non-Treated
control 67 72 10.2 12.6 65 73 10.6 13.3 71 73 11.3 11.6
z Means within a column followed by the same letter are not different according to Fisher’s Protect LSD test at p ≤ 0.05.
Data for the non-treated control were not included in the analysis. Data are pooled over mixing intervals.
Table 10. P > F for cotton defoliation 10 DAT and cotton yield as influenced by experiment, mixing interval, and defoliant treatment.
Source Defoliation 10
DAT
Seed cotton yield value
---Experiment (Exp) <0.0001 <0.0001
Mixing Interval (Interval) 0.4868 0.7926
Defoliant <0.0001 0.5908
Exp*Interval 0.8359 0.5706
Interval*Defoliant 0.1776 0.6471
Exp*Interval*Defoliant <0.0001 0.3957
Coefficient of variation (%) 7.4 16.8
Table 11. P > F for defoliation as influenced by mixing interval and defoliant.
Source Lewiston Rocky Mt
p value
---Mixing Interval (Interval) 0.8418 0.5226
Defoliant <0.0001 <0.0001
Interval*Defoliant 0.4277 0.0404
When comparing the insecticides, plant growth regulators, and defoliants over all pests and cotton growth parameters, ethephon, indoxacarb, methomyl, spinosad, and thidiazuron showed sporadic changes
in efficacy due to mixing interval. However, changes were relatively minor and would likely be difficult
to notice at the farm level. In the case of ethephon, spray solutions mixed 3 to 9 d prior to application performed better than spray solution mixed on the day of application. These results do not suggest that mixing ethephon in advance is advisable but offers
reassurance that efficacy is not compromised when
remaining in the spray tank for up to 9 d provided that adequate agitation is provided. These experi-ments were conducted using a single water source at pH 6.7 with relatively low water hardness. Leaving agrochemicals in spray tanks in water with other characteristics might lead to a dramatically differ-ent response in performance than observed in these experiments. Results from these experiments also demonstrate variability of biological systems and
de-velopment of results that are difficult to explain even
when experimental procedures are implemented to minimize variation and statistical procedures are used to account for variation.
ACKNOWLEDGMENTS
This research was supported in part by funds administered through the North Carolina Peanut Growers Association, Phillip Morris USA, and Monsanto Co. Appreciation is expressed to staff at the Upper Coastal Plain Research Station and Peanut Belt Research Station for technical assistance.
REFERENCES
Bacheler, J.S. 2010. Managing Insect on Cotton. p. 125–147. In 2010 Cotton Information. Publ. AG-417. North Caro-lina Coop. Ext. Serv., Raleigh, NC.
Bell, A.A. 1999. Diseases in cotton. p. 553–594. In C.W. Smith and J.T. Cothren, (eds.) Cotton: Origin, History, Technology and Production. John Wiley and Sons, Inc., New York, NY.
Carley, D.S., D.L. Jordan, R.L. Brandenburg, and L.C.
Dhar-masri. 2009. Factors influencing response of Virginia
market type peanut to paraquat under weed-free condi-tions. Peanut Sci. 36:180–189.
Cook, D.R., G.L. Lentz, B.R. Leonard, J.T. Reed, G.A. Her-zog, C.T. Allen, E. Burris, and B. L. Freeman. 2003. A survey of thrips (Thysanoptera) species infesting cotton seedlings in Alabama, Arkansas, Georgia, Louisiana, Mississippis, and Tennessee. J. Ent. Sci. 38:669–681. Cothren, J.T., and D.M. Oosterhuis. 2010. Use of growth
regulators in cotton production. p. 289–304 In J.McD. Stewart et al. (eds.) Physiology of Cotton . Spring Dor-drecht Heidelberg, New York, NY.
Crawford, S.H., J.T. Cothren, D.E. Sohan, and J.R. Supak. 2001. A history of cotton harvest aids. p. 1–19 In J.R. Supak and C.E. Snipes (eds.) Cotton Harvest
Manage-ment: Use and Influence of Harvest Aids. The Cotton
Foundation, Memphis, TN.
Edmisten, K.L. 2010a. Suggestions for Growth Regulator Use. p. 47–65. In 2010 Cotton Information. Publ. AG-417. North Carolina Coop. Ext. Serv., Raleigh, NC. Edmisten, K.L. 2010b. Cotton Defoliation. p. 148–166. In
2010 Cotton Information. Publ. AG-417. North Carolina Coop. Ext. Serv., , Raleigh, NC.
Table 12. Influence of delayed applications of spray solution on cotton defoliation by selected defoliants at Rocky Mount in 2010z.
Defoliant
Rocky Mount, 2010
Lewiston-Woodville, 2009 Number of Days Mixed Prior to Treatment
0 3 6 9
% Defoliation
---Carfentrazone 69 f 66 f 70 f 64 f 67 e
Diuron plus thidiazuron 98 a 98 a 98 a 98 a 98 a
Ethephon 80 de 90 bc 84 cd 86 bcd 85 c
Ethephon plus cyclanalide 91 b 88 bc 89 bc 91 b 90 b
Thidiazuron 81 d 65 f 74 ef 81 d 75 d
Hamilton, K.A., P.D. Pyla, M. Breeze, T. Olson, M. Li, E. Robinson, S.P. Gallagher, R. Sorbet, and Y. Chen. 2004. Bollgard II Cotton: compositional analysis and feed-ing studies of cottonseed from insect-protected cotton producing the Cry1Ac and Cry2Ab2 Proteins. J. Agric. Food Chem. 52:6969–6976.
Layton, B., and J.T. Reed. 2002. Biology and Control of Thrips on Seedling Cotton. Publ. 2302. Mississippi State Univ. Ext. Serv.,Mississippi State, MS..
Leonard, B.R., J.B. Graves, and P.C. Ellsworth. 1999. Insect and mite pests of cotton. p. 489–551. In C.W. Smith and J.T. Cothren, (eds.) Cotton: Origin, History, Technology and Production. John Wiley and Sons, Inc., New York, NY.
Silvertooth, J.C., K.L. Edmisten, and W.H. McCary. 1999. Production practices. p. 451–488 In C.W. Smith and J.T. Cothren, (eds.) Cotton: Origin, History, Technology and Production. John Wiley and Sons, Inc., New York, NY. Stewart, C.L., R.H. Nurse, M. Cowbrough, and P.H. Sikkema.
2009. How long can a herbicide remain in the spray tank
without losing efficacy? Crop Prot. 28:1086–1096.