*
Corresponding Author
Email Address: [email protected] DOI: 10.22068/ijae.9.3.3002
Approaching Influence of Vehicle’s Properties in Crosswind and Overtaking
Situations Using Multi-Step Taguchi Method
Sina Sadeghi1, Majid Moavenian*,
1
MSc student, Department of Mechanic, Faculty of Engineering, Ferdowsi University of Mashhad, Iran *
Associate Professor, Department of Mechanic, Faculty of Engineering, Ferdowsi University of Mashhad, Iran
ARTICLE INFO A B S T R A C T
Article history:
Received : 22 June, 2019
Accepted: 5 Aug , 2019
Published: 1 Sept , 2019
Most of drivers have to compensate small directional deviations from the desired driving path when disturbances such as crosswinds, overtakings, road irregularities and unintended driver inputs are imposed. These types of deviations have a tiring effect on driver and traffic‟s safety and should be minimised. To increase the understanding the influence of vehicle‟s properties in crosswind and overtaking conditions, specially vans and buses, and improving their safety, the vehicle was modeled using parameters based on real vehicle data for simulation in CarSim program. These parameters were validated or edited by simulation programs such as SOLIDWORKS, ADAMS/CAR ADAMS/CHASSIS and Well-known Calculation Software . A method for estimating the lateral error of vehicle due to original path in crosswind and overtaking conditions is also presented using Multi-Step Taguchi method in MINITAB. Dealing with limited but most effective factors of Vehicle‟s Properties instead of large variety of them can be used for optimal vehicle‟s design and propose ideal Crosswind Controllers.
Keywords: Crosswind
Overtaking
Taguchi method
Lateral Deviation
Sensitivity
1.
Introduction
The handling behavior in crosswinds of fast, vehicles like vans, buses and trucks becomes more and more important as a result of the development of streamlined vehicle bodies. Generally vehicles with low drag coefficient and large cross section area are more sensitive to crosswind [1].
Up to now, one of the experimental methods is testing crosswind sensibility by using a side-wind blower facilities and evaluating the path deviation for controlling fields [2]. But in these methods, unwanted parameters have normally large angle of approach, neglecting the driver‟s response there are some chassis, steering and suspension factors which can have effective influence in derivation from original path in crosswind gust. In many cases, attempts at streamlining passenger cars for minimizing drag have led to unfavorable increases in crosswind sensitivity. As noted in such
comprehensive studies such as Huoyue Xiang et al [3] and Takuji[4], neglecting roll and pitch movements tradeoff was developed by Kamm [5] out of which arose the well-known truncated rear-end design ("Kamm-back") which helped to offset much of the crosswind susceptibility introduced from streamlining. More recent observations, such as Volpe [6] or Huoyue Xiang et al [3], have contributed to improved understandings on the impalpable influences relating to A and C-pillar styling body designs and their importance in affecting crosswind sensitivity of passenger cars. Numerous formulations aimed at simplified identifications of the crosswind sensitivity of passenger cars have been offered in the technical literature. At the FISITA Congress, Watari et a1 [7] offered a crosswind sensitivity formulation based upon the steady-state and uniform lateral acceleration response of a vehicle to a constant aerodynamic side force. Chen [8], proposed a formula for predicting the crosswind sensitivity based upon the initial transient response of a
International Journal of Automotive Engineering
Journal Homepage: ijae.iust.ac.ir
S
N:
2
0
0
8
-9
8
9
9
International Journal of Automotive Engineering (IJAE) 3003
vehicle to a step input of crosswind and its subsequent steady-state turning response. Guangsheng Du et al [9] conducted a simulation-based study involving systematic parameter variations of a validated computer model by Sayers et a1 [10] that included detailed representations of the vehicle dynamics, aerodynamic properties, steering system characteristics, and driver steering behavior. Numerous full-scale test programs have also been conducted which attempted to identify and illustrate influences of chassis and aerodynamic properties on vehicle crosswind sensitivity. Klein and Acosta [11] reported on findings of a full-scale test program involving five distinctly different U.S. vehicles. Crosswind tests were conducted with a newly-developed crosswind fan facility [12]. Proppe and Xhang [13] conducted similar tests with a group of 15 drivers at vehicle speeds of 100 km/h. A European crosswind fan facility was utilized which provided aerodynamic slip angles up to 20 degrees at such test speeds, However, they did note that yaw rate and lateral acceleration appeared to be the most useful measurements as discriminators of different vehicle configurations during these tests. Lastly, Winkler et a1 [14], also reported on a sequence of crosswind driver-vehicle tests conducted under natural crosswind conditions along a North Sea coast motorway. Willumeit's study indicated that the passive (non-driver, fixed steering wheel) vehicle response to crosswinds does not "fully correlate with driver's impressions of side wind sensitivity."
As it can be concluded previous works by focusing on specific geometry factors of vehicles did not reach a comprehensive and useful crosswind controller. In this paper, a specific type of van is selected to find the most effective aerodynamic and other design parameters including suspension, chassis, tire and engine factors in crosswind and overtaking situations. CarSim simulation data for the proposed vehicle were verified or validate by SOLIDWORKS/Flow Simulation for aerodynamic properties,
ADAMS/CAR, ADAMS CHASSIS and
ADAMS/TIRE for other parameters. By applying a method to find a similarity percentage between the vehicle path and original path, the Taguchi method get used to find effective factors.
2.
Approach
A good chassis design compensates poor crosswind behavior of the body. So there was a need to develop a model which describes the
active crosswind behavior Crosswind behavior of the car body is responsible for aerodynamic properties and handling behavior of chassis. According to [1] these two parts can be described as a linear regression formula.
Before applying Taguchi Method for our specific Vehicle (Van Sprinter 2500), their systems parameters must be validate or verify by data library or simulation methods with their own academic and credible software. Four main vehicle system and their validation methods mentioned in Figure 1.
Figure1: Scheme of Four main classes of properties
2.1. Validation of Aerodynamic Properties In this study a Benz Sprinter 2500 van is chosen for this research shown in Figure 2. In CarSim simulation software for this particular case after selecting the „Europe Minivan‟ category, most of the data must be adjust, validate or insert due to data given from other mentioned simulation software or its manuals. As it is shown in Figure 3 aerodynamic parameters in red squares must be adjusted for this type of vehicle and rest of the parameters can be inserted directly based on manual script of the vehicle provided by Benz-Dailmer Company [15].
Figure2: Benz Sprinter 2500
3004 International Journal of Automotive Engineering (IJAE)
Figure3: CarSim Aerodynamic properties
To find the six aerodynamic parameters mentioned in red box of Figure 3, it is needed to model a 1:1 high accurate vehicle prototypical in SOLIDWORKS software as it is shown in Figure 4 and adding it to Flow Simulation tool and run its CFD study to obtain them. The CFD test applied under the test conditions given in Table 1.
Figure4: High accuracy SOLIDWORKS model of the vehicle
Table1: Flow Simulation Study Conditions
Feature Conditions
Analysis Type Exclude
Initial Mesh Auto (level 4)
Heat Conduction Off
Time Dependency Off
Flow Type Laminar and Turbulent
Humidity Off
Wall Conditions Adiabatic
Thermodynamics STP
Fluids Air
Vehicle Velocity 100km/h (X direction)
By applying this proposed model with these CFD conditions, it takes more than days to get results by our laboratory computational services, so it can‟t be helped to simplify the vehicle‟s SOLIDWORKS model into clay model as it is
shown in Figure5. (all geometric parameters of the vehicle did not change)
Figure5: Clay Model of the Vehicle in SOLIDWORKS
The results of running the flow simulation on aerodynamic coefficients and important flow trajectories are given in Table 2 and Figures 6 and 7.
Table2: Aerodynamic Coefficients Results
Parameter Notation Value
Drag Coefficient 0.2893
Side Force Coefficient 0.4981
Lift Coefficient 0.2299
Roll Moment Coefficient 0.3173
Pitch Moment Coefficient
-0.2136
Yaw Moment Coefficient 0.1294
Figure6: Flow Trajectory of Air at speed of 100km/h
International Journal of Automotive Engineering (IJAE) 3005 Figure7: Pressure Difference Plot around Vehicle of
Air at speed of 100km/h
Figure 6 and 7 shows that the air vortex and pressure difference created at the end and sides of long vehicles (specially Buses and vans) during overtaking can have same effect as crosswind condition to deviate from original path (suction or repulsion after specific closure). To show the strong effect of air vortex caused by long vehicles overtaking, a separate Flow Simulation study for Bus-Van performed. The overtaking simulation progress is shown in Figures 8 and 9.
Figure8: Bus-Van overtaking SOLIDWORKS model for Flow Simulation Study before overtaking
Figure9: Bus-Van overtaking SOLIDWORKS model for Flow Simulation Study in overtaking
If „before overtaking‟ named as Event 1 and „meanwhile the overtaking‟ as Event 2 , by Flow Simulation Study the location of air vortex caused
by bus traveling is spotted and presented in the format of streamline contour in Figure 10 and Forces and Torques that applied to Van before and meanwhile the overtaking in Tables 3 and 4 and compare it in Figure 11. If any vehicles specially long ones reach this spot, suction or repulsion of the vortex will bring same effect as crosswind condition.[8]
Figure10: Stream line Contour of Event 1 from above
Table3: Applied Forces and Torques in Event1 Applied
Force/Torque
Unit Value
N 657.554
N 477.306
N 1007.199
N.m 8086.353
N.m 515.840
N.m -4292.749
The hotspot of side Air vortex of the bus occurs about 0.8m from its right side. Event 2 starts when the van reaches in this area. The effect of air vortex in deviating the van from original path, Forces and Torques applied to the van‟s body measured.
Table4: Applied Forces and Torques in Event2 Applied
Force/Torque
Unit Value
N 917.68
N 836.16
N 4161.42
N.m 65594.46
N.m -7184.87
N.m -13366.16
3006 International Journal of Automotive Engineering (IJAE)
-20000 0 20000 40000 60000 80000
SG Force (X) 1 SG Force (Y) 1 SG Force (Z) 1 SG Torque (X) 1 SG Torque (Y) 1 SG Torque (Z) 1
Comparison of Forces and Torques
Event 2 Event 1
Figure11: Comparison of Forces and Torques applied to Van‟s body
As its obvious it can be concluded that during the overtaking (specially two long vehicles) the amounts of force and torques grow 2 to 10 times greater than before overtaking and this can deviate the van easily. The only way to prevent this deviancy is using Crosswind Controller or handling the vehicle far enough the hotspot area. Figure12 shows the amount of deviation in this process by CarSim program.
Figure12 : Deviation Error due to original path in Bus-Van Overtaking
2.2. Validation of Tire and Wheels Parameters CarSim Tire Section is Shown in Figure 13. Regarding to this page, it can be seen that parameters highlighted with colored boxes are needed to be verified. One of the most capable programs which has comprehensive data library is TDFT tool. This application is available by running “Component Analysis” of Adams Car software.
Figure13: CarSim Tire parameters section
Due to Vehicle‟s company manual this van use 205/55R16 tire as default and can be used to verify data mentioned in first red box of Figure 13. But to gain other parameters it is needed to correct parameters like road condition, test speed and contact model after inserting from library. Figures 14-18 present branch pages of library which needed correction by red star beside them.
Figure14: TDFT tool window and its branch pages
Figure15: Correction of setting MKGS unit
International Journal of Automotive Engineering (IJAE) 3007 Figure16: Correction of test speed and road condition
Figure17: Correction of contact model
Figure18: Correction of condition page
Figure19: Applying the 2D Flat Road in TDFT
After reviewing and completing the check list, for verifying the remnant data, specially the second red box of Figure 13, it is needed to run a “Symmetric Dynamic Load Transfer” test. The Process of running this test and applying a “2D_Flat_Asphalt_road” is shown in Figure 19.Results are given in Figures 20-26, and they must applied to CarSim tire section (Table data) as format of “2D Array Table” to update.
Figure20: Effective Rolling Radius
Figure21: Loaded Tire Radius
Figure22: Longitudinal Force Vs Longitudinal Slip
Figure23: Lateral Force Vs Longitudinal Slip Asphalt
3008 International Journal of Automotive Engineering (IJAE)
Figure24: Self Aligning Torque Vs Longitudinal Slip
Figure25: Contact Patch Length
Figure26: Contact Patch Width
Remaining data which not mentioned in results (e.g the blue box of Figure 17) are given over to own CarSim Library.
2.3. Validation of Steering and Suspension Verification of steering and suspension‟s parameters is a big challenge. Tons of factors and not enough accessible data from vehicle‟s manufactures give us no choice other than using data library of softwares like “Adams Chassis” or calculator tools like “Circle Track Analyzer” and “Steering Geometry Simulation”. Figures 27- 30 presents CarSim related pages of steering and suspension systems and their data which need validation by boxes.
Figure27: CarSim Suspension types of Vehicle
Figure28: CarSim Front Suspension Section
Figure29: CarSim Rear Suspension Section
Figure30: CarSim Steering System Section
The closet data base for our vehicle is “mini_van.vdb” and it can be used as reference for validation, but for further data it needs simulation test. The 3 steps route of inserting data base and running a test is pictured in Figure 31. However the chosen data library have the best similarity to our proposed vehicle but linearity or nonlinearity springs and dampers and bushing types for connectors must be corrected as much as they are available in company vehicle‟s manual shown in Figures 32-35 by red boxes. Bringing whole pages of this data base is out of scope of this paper, so we bring the ones which need mentioned corrections.
Figure31: ADAMS/CHASSIS 3 steps route 2
International Journal of Automotive Engineering (IJAE) 3009 Figure 32: Correction of spring data of
“Adams Chassis” Library
Figure33: Correction of bumpers data of “Adams Chassis” Library
Figure34: Correction of dampers data of “Adams Chassis” Library
Figure35: Validated data for Steering System Section of “Adams Chassis” Library
Results of running “Ride Motion” and “Front Steering” tests are brought in Figures 36 and 37.
Figure36: Front Steering Test Results
Figure37: Ride motion Test Results
As it can be seen “Adams Chassis” librarian and simulation results did not cover enough data for validation. By getting help from data bases of calculator tools remaining parameters will be identified. For suspension factors (front and rear) “Circle Track Analyzer” applied. Main and related pages of front and rear suspension are shown in Figures 38-40.
Figure38: Main page of “Circle Track Analyzer” Tool
3010 International Journal of Automotive Engineering (IJAE)
Figure39: Front suspension section in “Circle Track Analyzer” tool
Figure40: Rear suspension section on “Circle Track Analyzer” tool
Regarding to Figure 38, after inserting van‟s date base from green box and setting test and track conditions in red box option, validation of suspension parameters can be available. By selecting each switch mentioned with blue box front and rear suspension pages are accessible. As it can be seen in Figure 39 in order to have the most accuracy it is possible to correct any geometric parameters in red box from validated “Adams Chassis” data before. Also suspension types and Toe-Camber graphs are accessible in green box section. Results of applying this tool are given in Table 5 and 6.
Table5: “Circle Track Analyzer” Front suspension results
Parameter Unit Value
Spring Mechanical Ratio
- 0.81
Damper Mechanical Ratio
- 0.81
Jounce and Rebound Ratio
- 500
Auxiliary Roll Moment
⁄ 0.000003
Auxiliary Roll Damping
⁄ 0.000035
Longitudinal Displacement VS
⁄ 0
Longitudinal Displacement VS
⁄ 0
Inclination VS ⁄ 0
Inclination VS ⁄ 0
Inclination VS ⁄ 0
Table6: “Circle Track Analyzer” Front suspension results
Parameter Unit Vaue
Mass Kg 155
Roll and Yaw Inertia Kg.m2 50
Spin Inertia Kg.m2 1.5
Static Toe Angle deg 0.2
Static Camber Angle deg 1.079
For steering parameters “Steering Geometry Simulation” tool is used. As it presented in Figures 41 and 42, by inserting geometry data of steering column (which is validated before in “Adams Chassis”) required data are given in Table 7.
International Journal of Automotive Engineering (IJAE) 3011 Figure41: Main page and its setting of “Steering
Geometry Simulation: tool
Figure42: Inserting steering geometry data in “Steering Geometry Simulation” tool
Table7: Results of Simulation in “Steering Geometry Simulation” Tool
Parameter Unit Value
Column Inertia Kg.m2
0.025 Steering System
Inertia
Kg.m2
0.00018
Column Damping N.m.sec/deg
0.02
Gear Ratio deg/deg
19.80 Center offset of
Kingpin
mm
42.50
Inclination of Kingpin
deg
5.00
Caster Angle deg
3.00 Torsion Bar Stiffness N.m/deg
2.20
2.4. Calculation of Lateral Deviation Error To find out deviation error or similarity of two vector of arrays as one rational number format, dozens of methods have been proposed and in
mathematical and genetics fields [16]. Most of these methods based on giving a percentage value of having 0 or 1 for being different or exact similar respectively. These methods cannot be applied in this study since the length of vectors might be different and also being exact equal between i-th number two arrays is almost zero. So in this study, we managed to use “Pairwise distance between two sets of observations” like “Minkowski calculator” method which one can apply by “D=pdist2” command in MATLAB program [17]. To use this method 2 steps of process must be done. First “Vehicle Lateral Traction” and “Lateral Target” vectors for time steps of 0.01s must be calculated from CarSim plots. Second apply following Matlab code:
( )
Which Minkowski method is:
√∑| |
2.5 Level Designing for Multi Step Taguchi Back to parameter validation sections, it can be concluded that classes have 1 to 9 factors. Due to limitation of MINITAB program for Taguchi designing and huge number of factors, multi step usage of Taguchi method is the only way to solve the problem. Besides 3 levels are the utmost steps it can be considered in each step. To find a proper data interval for levels in each factor, “Tolerance Interval Tool” in MINITAB software applied. As an example Factor “Tire Width” for proposed vehicle given by Vehicle Standard Guideline is limited between 185mm to 265mm [14]. These data consider as interval borders. Next step it should bring available data within the borders for this factor by using Standard Guidelines [14],[19] (or librarian data base and random choices). Important note for this step is intervals data must not interfere with vehicles geometry and dynamics. By proceeding Tolerance Interval Tool, 6σ intervals resulted. In this research σ, σ) and (-2σ, 2σ) intervals applied for first and second step of Taguchi respectively. Figures 43and 44 show the results of this example.
Wheel angles
Test Options
Results Screen
3012 International Journal of Automotive Engineering (IJAE)
Figure43: Tire width interval
Figure44: Tolerance Interval Plot for D Value
By having mean and standard deviation of “D Value” calculating 6σ intervals and finding related intervals for Taguchi steps is done. Table 8 shows these process.
Table8: 6σ intervals for D value and Taguchi Steps
Taguchi Step
6σ D Value
Intervals
Tire Width Interval
First Step (0.633,0691) (205,255)
2nd Step (0.604,0.72) (185,265)
Third
Step
(0.575,0.749) NAN
The “NAN” value refers when boundaries of related interval of “D Value” for Tire width is larger than 185mm and 265mm and means this interval interfere with vehicles dynamic and geometry.
2.6 Classification of Factors
In this section first a brief view of classes and their number of factors given in Table9.
Table9: Categorized Classes of vehicle
Class No of
Factors
1 Sprung Mass Properties 4
2 Tire Properties 7
3 Aerodynamics Properties 9
4 Steering Properties 13
5 Suspension Kinematics 13
Suspension compliance 15
6 Brakes 4
7 Engine Properties 4
8 Test options 2
Detailed Classes and their factors are brought in Tables 10-19.
Table10: Sprung Mass Classification
Factors
1 Sprung Mass
2 CG Height of Sprung Mass
3 Longitudinal Distance of CG of Sprung Mass
4 Lateral Distance of CG of Sprung Mass
Table11: Tire Classification
Factors
1 Tire Type
2 Tire Radius
3 Tire Width
4 Maximum Allowed Force
5 Spring Rate of Tires
6 Cut off Speed
7 Effective Rolling Radius
International Journal of Automotive Engineering (IJAE) 3013 Table12: Aerodynamic Classification
Factors
1 Frontal Area
2 Air Density
3 Crosswind Degree
4 Drag Coefficient
5 Lift Coefficient
6 Side Force Coefficient
7 Roll Moment Coefficient
8 Pitch Moment Coefficient
9 Yaw Moment Coefficient
Table13: Steering Classification
Factors
1 Kingpin Inclination Angle
2 Front Steering Compliance
3 Rear Steering Compliance
4 Torsion Bar Stiffness
5 Front Steering Damping
6 Steering Gear Ratio
7 Steering System Type
8 Kingpin Lateral Offset from Center (Front)
9 Kingpin Lateral Offset from Center (Rear)
10 Steering Column Inertia
11 Steering System Inertia
12 Steering Column Damping
13 Steering Column Hysteresis
Table14: Suspension Kinematics Classification
Factors
1 Spin Inertia for each side of Suspension
2 Lateral Distance between two wheels of Axle
3 Static Front Toe Angle
4 Static Rear Toe Angle
5 Static Front Camber Angle
6 Static Rear Camber Angle
7 Static Front Caster (dive) Angle
8 Static Rear Caster (dive) Angle
9 Axle Roll and Yaw Inertia
10 Jounce at Design Load
11 Wheel Center Height
12 Lateral Coordinate of Suspension Axle
13 Unsprung Mass
Table15: Suspension Compliance Classification
Factors
1 Suspension Spring Type
2 Mechanical Ratio of Suspension
Component
3 Front Spring Alone Type
Front Ride Rate Spring Type
4 Rear Spring Alone Type
Rear Ride Rate Spring Type
5 Front Jounce and Rebound Stops
6 Rear Jounce and Rebound Stops
7 Auxiliary Roll Moments
8 Lateral Distance between Springs of Axle
3014 International Journal of Automotive Engineering (IJAE) 9 Lateral Distance between Dampers of Axle
10 Lateral Distance between Rebounds of Axle
11 Lateral Distance between Jounces of Axle
12 Upper Seat Height Adjustment
13 Front Damper Type
14 Rear Damper Type
15 Auxiliary Roll Damping
Table16: Brake Classification
Factors
1 Maximum Front Brake Torque
2 Maximum Rear Brake Torque
3 Front Fluid Pressure Proportioning
4 Rear Fluid Pressure Proportioning
Table17: Engine Classification
Factors
1 Horsepower of Engine
2 Torque of Engine
3 Internal Differential Gear Ratio
4 Wheel Drive (WD)
Table18: Test Options Classification
Factors
1 Test Speed of Vehicle
2 Wind Speed (Overtaking Vehicle)
For Verification of final results, a statistical field research which has been done by giving an e-questionnaire we developed by Telegram Bots and sharing it with 100 graduate and under-graduate mechanical engineers of Ferdowsi University of Mashhad. By using this method we saved paper works and time. This questionnaire bot given the user a multi-choice access throw 39 options simultaneously and in order to prevent cheating and fake votes, it developed to delete votes of a user who enter the bot more than one time.
3. Results and Discussions
As it was discussed in previous section, in order to apply Taguchi Method in MINITAB software it is obligated to categorize vehicle‟s parameters to smaller classes which was presented in Table 5. The Results of using Taguchi for each class have shown in Figures 45-54. Then they were arranged these top ones in Table 6, and apply another step of Taguchi method for final and most effective parameters in crosswind and overtaking conditions for our proposed van.
Figure45: Taguchi SNR plot for Sprung Mass properties
It can be concluded from Figure 45 that “Longitudinal Distance of Sprung mass” and after that “Lateral Distance of sprung mass” are more effective parameters in Class 1 categories and height of sprung mass and sprung mass itself are less effective. The goal of Signal-Nosie (SNR) plot in this study is “smaller is better” so if one reach the biggest SNR it will closer to the goal. So being in Level 1 in “longitudinal distance of sprung mass” factor, Level 2 in “Lateral distance of sprung mass” factor, and Level 2 for “ Height of sprung mass” and “ sprung mass” it will get the best result.
International Journal of Automotive Engineering (IJAE) 3015 Figure46: Taguchi SNR plot for Tire properties
Here we can find from Figure 46 that “Tire type” and after that “Tire width, radius and Maximum allow force” are more effective parameters in Class 1 categories and cut off speed and effective rolling radius are less effective. As choosing is “smaller is better” goal for this study so if we reach the biggest SNR we will closer to our goal. So being in Level 3 in “Tire type” factor, Level 4 in “Tire width, radius and maximum allowed force” factor, the best results can be driven.
Figure47: Taguchi SNR plot for Brake properties From Figure 47 one can concluded that Brake properties have no effect on lateral deviation of vehicle in crosswind and overtaking situation.
Figure48: Taguchi SNR plot for Engine properties
It can be obtained from Figure 48 that “Wheel Drive Type” is the most effective parameters in Class 1 categories and others are less effective. Because our goal in Taguchi method here is “smaller is better” so if one reach the biggest SNR we will closer to the goal. So being in Level 1 in “WD” factor, Level 3 in “Engine Model and maximum torque of engine” factors, the best result can be received.
Figure49: Taguchi SNR plot for Test Options (Crosswind Test)
Figure50: Taguchi SNR plot for Test Options (Overtaking)
“Test Option” class divided to 2 parts, part one which is crosswind conditions applied and we can derive from its SNR plot in Figure 49 that both wind and car speed are effective, and part two which is overtaking conditions happens and it can be deduced that Target vehicle‟s Speed has more effect in our test vehicle‟s deviation and that‟s because of strong air vortex it generate at its sides and backs when it gives more speed respectively. But for final Taguchi we concern both of them as effective factors.
3016 International Journal of Automotive Engineering (IJAE)
Figure51: Taguchi SNR plot for Aerodynamic properties
Regarding to Figure 51 SNR plot we can conclude that these four factors are the most effective parameters among the 9 aerodynamic properties: 1) Frontal Area 2) Yaw moment coefficient 3) Slide Moment and degree of crosswind at end.
Figure52: Taguchi SNR plot for Steering properties
Due to Figure52 it can be deduced that these four factors are the most effective parameters among the 13 steering properties we have:1)Front steer compliance 2)Torsion bar stiffness 3)Front steer damping.
Figure53: Taguchi SNR plot for Suspension kinematics properties
According to Figure 53 it can be inferred that these four factors are the most effective parameters among the 13 aerodynamic properties we get: 1)Static Font toe angle 2)static front
camber angle 3)jounce at design load. And because in our Taguchi method is “smaller is better” so if one reach the biggest SNR it will closer to our goal. So being in Level 3 in “Static Font toe angle” factor, Level 1 in “static front camber angle” factor, and Level 1 for “jounce at design load”, the best results can be given.
Figure54: Taguchi SNR plot for Suspension Compliance properties
According to Figure 54 SNR plot we can conclude that these four factors are the most effective parameters among the 13 aerodynamic properties:1)Upper spring seat height 2)Front Jounce & Rebound stops 3)Auxiliary roll moment Because our goal in Taguchi method here is “smaller is better” so if we reach the biggest SNR we will closer to our goal. So setting in Level 1 in for effective ones we can get the best result. In Table 19 all the effective factors from each class to applying Taguchi Method gathered once again. As it is shown 72 parameters that taught might have effects in crosswind and overtaking conditions reduced into 21 parameters. But for future works and optimization it is obligated to decrease the number of factors. The result of using Final Taguchi application presented in Figure 55 and Table 20.
Table19: 21 Effective Parameters from Primary Taguchi Method
Class Effective Factors
1
Sprung mass properties
Longitudinal Distance of Sprung
mass
2 Tire Properties
Tire Type Tire width Tire Radius
3 Brakes Properties -
4 Engine Properties Wheel Drive Type
5 Test car speed
International Journal of Automotive Engineering (IJAE) 3017
5 Test Option
Properties
Wind (Target car) speed
6 Aerodynamics
Properties
Frontal Area Side force coefficient Yaw moment
coefficient Crosswind degree
7 Steering Properties
Front steer compliance Torsion bar stiffness Front steer damping
8 Suspension
Kinematics Properties
Static Front toe angle Static front camber
angle Jounce at design
load
9 Suspension
compliance Properties
Upper spring seat height Front Jounce &
Rebound stops Auxiliary roll
moment Auxiliary roll
damping
Figure55: Final Taguchi SNR plot
Table20: The Most Effective Vehicle‟s Parameter in Crosswind or Overtaking
Class Most Effective Factors
1
Longitudinal Distance of Sprung mass
Longitudinal Distance of Sprung
mass
2
Test Option Properties
Test car speed Wind (Target car)
speed
3
Aerodynamics Properties
Side force coefficient
Frontal Area Crosswind degree
4 Steering
Properties
Front steering compliance
5
Suspension Kinematics Properties
Jounce at design load Static Front toe angle Static front camber
angle
6
Suspension compliance Properties
Upper spring seat height Front Jounce &
Rebound stops
These most effective factors are categorized based on their “D Value” to indicate their sensitivity, it is shown in figure 56 scaled on number 15.
Figure56: Sensitivity of most effective factors of crosswind conditions
In this study, in order to verify our results we get help from previous studies and a statistical fieldwork mentioned before. Mansor et al. by deriving vehicle‟s lateral dynamics found that these 6 parameters are the most effective factors in crosswind deviation [18]:
1) Vehicle‟s speed 2) Wind Speed 3) Crosswind angle 4) Rear Slant Angle 5)Side Force Stiffness of Chassis 6) Side Force Damping of Chassis In a similar study, Juhlin et al. Found the effect of 22 vehicle‟s parameter on the lateral deviation due to crosswind [19] which they presented in the follow Figure 57:
10 15 9
12 8 8
12 7
8 6
10 7
0 5 10 15 20
Longitudinal Distance of… Test car speed
Wind speed Side force coefficient Frontal Area Crosswind degree Front steering compliance Jounce at design load Static Front toe angle Static front camber angle Upper spring seat height Front Jounce & Rebound…
Sensivity out of 15
3018 International Journal of Automotive Engineering (IJAE)
12
8
4 4 0 6
2 2 1 5 5 0 1 1 2 2 2 2 14 15
18
2 0 2 2 1 1 0 0 1 2 4 12 8 5 19 16 11 1 0 2 4 6 8 10 12 14 16 18 20 lo n gi tud e s pe ed o f v ehi cl e cam be r a ng le o f f ro nt w he e l cam be r a ng le o f r ear wh ee l cas te r a ng le o f fr o nt w he el cas te r a n gl e o f re ar w h ee l to e a ng le o f f ro nt wh ee l to e a ng le o f r e ar wh ee l wi dt h o f t ir e ef fr ec ti ve r o lli ng r adu is o f ti re s sp ri ng r at e o f ti re s sp ri ng r at e o f su sp ens io n d am p er c ap ac it y o f su sp en si o n jo un ce s to ps re bo un d st o ps lat er al s pa ce b et we en spr ing s lat er al s pa ce b et we en da m pe rs lat er al s pa ce b et we en jo un ce s lat er al s pa ce b et we en… lat er al c o o rd in at e o f C G o f… lo n gi tud e c o o rdi na te o
f CG o
f… he ig ht CG o f s pr un g m as s 2W D -4 W D ge ar r at io fr o nt d isk m ax to rqu e re ar d isk m ax to rqu e sl ip o n/o ff r ear t ir es sl ip o n/o ff f ro nt t ir es st e er ing c o lo um n pr o pe rt ie s ge o m et ry o g k ing pi n st e er ing s yst e m t yp e po we r s te er ing s ys te m ro lli ng r esi st an ce m o m ent s o f… A B S O N /O FF m as s o f t ir e ine rt ia o f t ir es le n gt h be twe en the t ir es ES P O N /O FF us ing b ac k f lap di ff er e nt ial c lut ch inp ut
votes
Figure 58: Result of Statistical work field by e-Questionnaire Figure57: effect of 22 vehicle‟s parameter on the
lateral deviation due to crosswind [19]
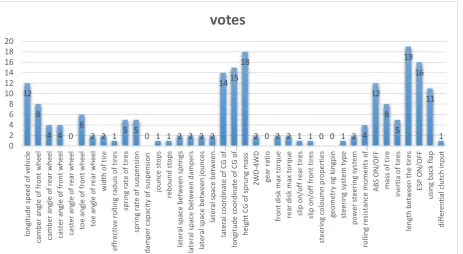
Besides the CFD studies that have done up today and focusing on aerodynamic properties, the results of our studies not only covers all the available vehicle‟s parameters from aerodynamic to wheel drive types factors, but also previous relative study as well. It should be noted that our results are also supported by field statistical results which it is shown in Figure 58.
4. Conclusion
In this study in order to find the most effective parameters among Crosswind and Overtaking situations for long vehicles like buses, trucks and vans, a specific Van modeled for this research in CarSim program and validate the parameters by getting help from other simulations programs, program‟s library and vehicle‟s manual data provided by its company.
To find the proper levels for each factor we proposed the Tolerance Interval Tool in MINITAB application and to find the value of similarity vehicle‟s path versus original path in test situation we presented the Euclidean Distance formula so we could run Taguchi method. But we found the computational problem for running these vast of factors and levels so we hadn‟t another choice but to categorize factors to smaller classes and run Taguchi for primary classes and once again with top ones of each class and reduced the effective parameters into only 12 factors.
Involving with these most effective factors instead of working tons of vehicle‟s parameters in crosswind and overtaking conditions for body designing of large vehicles, designing controllers and optimization can be huge help. Reduction of frontal area and optimization of Longitudinal Distance of CG, Knowing the body‟s pressure points (Figure7) for installing crosswind sensors and Designing Electronic Crosswind Controller (ECC) by having these most effective factors as input channels are parts of this research conclusion.
International Journal of Automotive Engineering (IJAE) 3019
References
[1] Xiaoxiang Ma et al., Examining the safety of trucks under crosswind at bridge-tunnel section: A driving simulator study, Tunnelling and Underground Space Technology, 92 (2019) 103034.
[2] Vehicle Crosswind Stability. Chrysler Challenge Fund Project - #2000533, UMTRI, Sponsored by the Chrysler Motors Corporation, 1987-1990.
[3] Huoyue Xiang et al., A wind tunnel test method on aerodynamic characteristics of moving vehicles under crosswinds, Journal of Wind Engineering & Industrial Aerodynamics 163 (2017) 15–23.
[4] Takuji Nakashima et al., Coupled analysis of unsteady aerodynamics and vehicle motion of a road vehicle in windy conditions, Computers & Fluids 80 (2013) 1–9.
[5] Yan Han et al.,New analytical models for power spectral density and coherence function of wind turbulence relative to a moving vehicle under crosswinds, Journal of Wind Engineering & Industrial Aerodynamics 188 (2019) 384–396.
[6] Raffaele Volpe et al., Forces and flow structures evolution on a car body in a sudden crosswind, Journal of Wind Engineering and Industrial Aerodynamics, (2014) 114–125.
[7] A. Watari, S. Tsuchiya and H. Iwase, On the Cross-Wind Sensitivity of the Automobile. Proceedings of the 15th FISITA Congress, Paris, 1974
[8] G. Chen, K.J. Fidkowski, Discretization error control for constrained aerodynamic shape optimization, J.Comput. Phys. (2019)
[9] Guangsheng Du et al., Transient aerodynamic characteristics of vans overtaking in crosswinds, Journal of Wind Engineering & Industrial Aerodynamics 170 (2017) 46–55.
[10] M. Sayers, C. C. MacAdam and Y. Guy, Chrysler/UMTRI Wind-Steer Vehicle Simulation. User's Manual, Version 1.0, vols I and 11, Report No. UMTRI-89-811-2, 1989.
[11] C. Acosta L«ua, S. Di Gennaro, Nonlinear Adaptive Tracking for Ground Vehicles in the Presence of Lateral Wind Disturbance and Parameter Variations, Journal of the Franklin Institute (2017).
[12] Mahdi Azarpeyvand et al., Design and performance of an aeroacoustic wind tunnel facility at the University of Bristol, Applied Acoustics 155 (2019) 358–370.
[13] Carsten Proppe, Xiaoyu Zhang, Influence of Uncertainties on Crosswind Stability of Vehicles, IUTAM Symposium on “Dynamical Analysis of Multibody Systems with Design Uncertainties”, ( 2015 ) 98 – 107.
[14] Niklas Winkler, Lars Drugge, Annika Stensson Trigell, Gunilla Efraimsson,
Coupling aerodynamics to vehicle dynamics in transient crosswinds including a driver model, Comput-ers and Fluids (2016).
[15] Mercedes-Benz USA,LLC/Dialmer Vans USA LLC, Body and Equipment (BEG) SPRINTER 2016/2017
[16] Antara Ghosh, Soma Barman, Application of Euclidean distance measurement and principal component analysis for gene identification, Gene, Volume 583, Issue 2, 2016, Pages 112-120 [17] The Technical Whitepaper series, Series 6, Euclidean Distance raw, normalized, and double‐ scaled coefficients,2005
[18] S. Mansor, M. R. Rahman,M.A. Passmore, Dynamic Simulation of Vehicle Crosswind Sensitivity for Various Rear Slant Angle,
International journal of automotive technology 14 (5), 701-706
[19] Magnus Juhlin and Peter Eriksson,A vehicle parameter study on crosswind sensitivity of buses, Commercial Vehicles Engineering Congress and Exhibition, Rosemont, Illinois, October 26-28, 2004.