in the population sciences published by the Max Planck Institute for Demographic Research Konrad-Zuse Str. 1, D-18057 Rostock · GERMANY www.demographic-research.org
DEMOGRAPHIC RESEARCH
VOLUME 19, ARTICLE 16, PAGES 503-556
PUBLISHED 01 JULY 2008
http://www.demographic-research.org/Volumes/Vol19/16/ DOI: 10.4054/DemRes.2008.19.16
Research Article
France:
High and stable fertility
Laurent Toulemon
Ariane Pailhé
Clémentine Rossier
This publication is part of Special Collection 7: Childbearing Trends and Policies in Europe (http://www.demographic-research.org/special/7/)
© 2008 Toulemon, Pailhé & Rossier.
1 Introduction 504
2 Fertility levels and trends 507
2.1 Fertility is stable in France at roughly 2 children per woman 507 2.2 Population forecast for the next fifty years: heading towards a
stationary population
508
2.3 Ageing of fertility 509
2.4 Cohort fertility assumed to remain stable in future 512
2.5 Fertility by parity 514
2.6 Educational differentials in fertility are small and decreasing 519
2.7 Immigrant and native fertility 521
3 Changes in family behaviour since the 1970s 524
3.1 Decline of marriage 524
3.2 Contraceptive use and abortion 527
4 Female and youth participation in the labour force 531 4.1 Impact of 1994 child care allowance reform on fertility and
participation in the labour force
531
4.2 Economic situation of young adults 534
4.3 Age and gender inequalities in unemployment and wages 534
4.4 Gender roles within family 535
5 Social and population policies 536
5.1 Current consensus 536
5.2 Mix of tools 538
5.3 Effect of family policies on fertility 541
5.4 Other current demographic questions 543
6 Attitudes towards childbearing in France 543
6.1 Fertility intentions 544
6.2 ‘Family cultural divide’ runs through France 545
7 Conclusion 546
References 547
France:
High and stable fertility
Laurent Toulemon1
Ariane Pailhé2
Clémentine Rossier3
Abstract
The current total fertility rate in France is around 1.9 children per woman. This is a relatively high level by current European standards and makes France an outlier, despite the fact that its other demographic trends, especially conjugal behaviour, and social and economic trends are not very different from other Western European countries. France can serve as a counterfactual test case for some of the hypotheses advanced to explain the current low level of fertility in most European countries (delay in fertility, decline in marriage, increased birth control, greater economic uncertainty). France’s fertility level can be partly explained by its active family policy introduced after the Second World War, and adapted in the 1980s to accommodate women’s entry into the labour force. This policy is the result of a battle, fuelled by pro-natalism, between the conservative supporters of family values and the promoters of state-supported individual equality. French family policy thus encompasses a wide range of measures based on varying ideological backgrounds, and it is difficult to classify in comparison to the more precisely focused family policies of other European welfare states. The active family policy seems to have created especially positive attitudes towards two- or three child families in France.
1 Institut national d’études démographiques (INED).E-mail: [email protected] 2 Institut national d’études démographiques (INED). E-mail: [email protected]
1. Introduction
The Total Fertility Rate (TFR) has remained almost stable in France since 1975 at around 1.8 children per woman, with a slight decrease in the early 1990s and a slight increase since 1996. Central population forecasts, based on stable fertility and migration at 2005 levels, predict stability of the population aged 60 and below, and an increase in the population aged over 60. The timing of fertility is rapidly changing in France: The age at first birth has risen since the early 1970s to reach 27.7 years in 2005. However, fertility rates also increased after age 30 during this period, so that women born after 1970 are expected to have, on average, 2.0 children each. Period parity progression ratios have remained stable since 1975 (except for the probability of having a first child, which is affected by the timing of fertility). The stable level of fertility is thus accompanied by a stable distribution of family sizes. Women of higher educational attainment have fewer children on average, but when they do have them, they are more likely to have three children than women of medium educational level. Overall, social differentials are small in comparison with the rest of Europe, and they have decreased over the 20th century. The fertility of immigrants contributes little to the level of fertility in France (Prioux 2005; Toulemon 2003; Toulemon 2006).
The French level of period fertility, which is the highest in the European Union, is somewhat puzzling. As elsewhere on the continent, entry into parenthood has been delayed. French young men and women have increased their investment in education and delayed their entry into the labour market. Entering the labour market is particularly difficult in France, and unemployment rates are high among young people (Chambaz 2001). As in the rest of Western Europe, sexual relations and reproduction have increasingly occurred outside of marriage since the late 1960s, which is roughly the time at which the use of contraception and abortion was legalized. Divorce rates have also increased since the early 1970s, and the proportion of extra-marital births in France is today one of the highest in Europe, as is the use of reversible contraception and abortion. As in other European countries, rates of female participation in the labour force started to increase in the 1970s and today most French women work. Although fathers now spend more time with their children, the division of labour between men and women remains fairly unequal and most childcare still falls to women. In terms of the division of domestic labour, France occupies an intermediate position in Europe (Eurostat 2006b; Aliaga, 2006).
men and women). The case of France thus invalidates the two most commonly held explanations of low fertility. The first explanation is that low fertility is related to the delay in entry into parenthood. “The fertility-inhibiting effect of the rising age at childbearing is primarily responsible for the fact that observed fertility is below replacement” (Bongaarts 2001, p. 275). Kohler and Ortega agree with Bongaarts: “The postponement of fertility is not neutral with respect to the quantum of fertility” (2006, p. 25), and so do Morgan and Taylor in their recent review of the literature in the field of research: “Work focusing on the timing of parenthood shows the many ways that timing and number are interrelated” (2006, p. 9). Demographic trends in France do not follow the suggested pattern, that delaying entry into parenthood results in lower fertility. The second explanation of low fertility relates this trend to the individuation process and its obvious correlate, the breakdown of traditional family forms. On the basis of empirical work that explores the link between varied attitudinal scales and demographic outcomes, Lesthaeghe and Surkyn conclude: “Union formation, transition to parenthood and further family building [are all] associated […] negatively with indicators of the individuation process” (1988, p. 40). They echo the conclusion of Van de Kaa, who describes a second demographic transition, marked by “the transition to individualism [which] appears to have led to an extended period of below-replacement fertility” (1987, p. 52). However, it is now clear that greater individual freedom, in the field of matrimony in particular, is not linked to fertility outcomes, at least not at the aggregate level. Kohler and Ortega (2006), show that a positive relation between divorce rates and fertility prevails today in Europe, including France.
The most obvious explanation for France’s relatively high fertility is its particularly active family policy. Family policy was already on the political agenda at
the end of the 19th century and began to be implemented shortly after the Second World
War. This long history of considering family policy enabled the government to react swiftly to women’s entry into the labour force, by designing new policy measures. Today’s policy is the result of a century-long battle, fuelled by pronatalism, between the conservative supporters of family values and the promoters of state-supported individual equality. French family policy thus includes a wide range of measures based on a variety of ideological standpoints.
welfare states). Central European countries (including France and Germany) have policies geared at preserving the status quo and traditional family forms; they depend mostly on the family to provide welfare (conservative welfare state). Mediterranean countries are like conservative states, but have a stronger family bias (Southern-European welfare state).
Feminist researchers consider the interaction of two types of relations within the family, partnership and parenthood, when classifying European welfare policies (Neyer 2003). Gornick, Meyers, and Ross (1997) focus on the impact of social policies on female employment. They group France, Belgium, Denmark, Finland and Sweden as countries where social policies help women to remain in the labour force. In Germany, the Netherlands, and Italy, family policies force women to exit the labour force until their children go to school. In the United Kingdom, there is limited support, and the ability of mothers to stay in the labour force depends on individual capacities. Anttonen and Sipila (1996) distinguish different types of state child care policies: the Scandinavian model (universal policies aimed at promoting gender equality); the Southern model (limited supply of state care services); France and Belgium, with extensive state support to families but no support for gender equality; Netherlands and Germany, where childcare is still provided by parents who benefit from state support schemes; and the British systems, in which state help is mostly directed towards ‘problem cases’.
Hantrais (2004) places the relation between family and state into three categories. The Nordic and French-speaking countries are ‘defamilialised’ (strong state support for the care of family members); the English- and German-speaking countries and the Netherlands are ‘partially familialised’; the Southern countries are ‘familialised’. McDonald (2005), simplifying matters even further, defines two groups of countries. The first includes the countries of Southern Europe and the German-speaking European countries where “there is a strong, traditional value that family and state are separate entities and that families should support their own members” (p. 11) and where fertility levels are below 1.5 children per women. The other group includes all the English-speaking, Nordic, French- and Dutch-speaking countries, where gender equality is higher, there are family-friendly institutional arrangements, and fertility levels are higher than 1.5.
2. Fertility levels and trends
2.1 Fertility is stable in France at roughly 2 children per woman
The current fertility level is high in France4, by European standards. In 2005, the provisional estimate of the TFR was 1.92 children per woman (Figure 1). Since 1975, the TFR has been almost stable at around 1.8 children per woman, with a slight decrease in the early 1990s and a slight increase since 2000.
Due to the change in the age of the mother at childbirth, the usual TFR leads to a fertility level estimate that is lower than those produced from more sophisticated indices that take into account the parity distribution of women and order of births, as well as the duration between births (Rallu and Toulemon 1994). The index that takes into account birth order and, for births of order 2 and over, duration since last birth, (Parity and Duration Total Fertility Rate, PDTFR, also called Period Average Parity, PAP), gives a
more consistent estimate of period fertility (Toulemon and Mazuy 2001; Sobotka et al.
2005). Its level in France is around 2.0 children per woman, close to the cohort total fertility of corresponding cohorts (Figure 1). Accurate data are not available to estimate its value since 1999, but it is probably close to or above 2.1 children per woman.
The current level of cohort fertility seems similar to that of cohorts born around 1900, but the number of surviving children is much higher. Infant mortality was very high a century ago. Nine percent of children born to women who were born in 1900 died during their first year of life, while the infant mortality rate is now less than 5 per thousand (0.5%). For women born in 1965, the French cohort total fertility (2.03) is among the highest in Europe, the highest being Ireland at 2.18, and is close to the levels in Norway (2.06) and Sweden (1.98). The cohort TFR could stabilize at 2.0 children per woman, and it is unlikely that it will fall below the level of 1.9, the current level of period TFR (Prioux 2005).
4 This chapter deals with mainland France, excluding the overseas départements. Thus, some figures might
Figure 1: Fertility since 1900 in France 1.2 1.4 1.6 1.8 2.0 2.2 2.4 2.6 2.8 3.0 3.2 1900 1872 1910 1882 1920 1892 1930 1902 1940 1912 1950 1922 1960 1932 1970 1942 1980 1952 1990 1962 2000 1972 C h ild re n p e r w o m a n
Period Total Tertility Rate PDTFR-PAP (1960-98) Cohort Completed Fertility
Year Cohort
Sources: INSEE, civil registration data. Daguet, 2002; INSEE, 2007; Toulemon, Mazuy, 2001
2.2 Population forecast for the next fifty years: heading towards a stationary population
This fertility figure is close to the ‘replacement level’ of 2.1 children per woman. In fact, France is currently experiencing a small net migration that adds to fertility. The current level of 100,000 net migrants per year is small by European standards: In 2005, the net migration rate was 1.6 per thousand, compared with a natural increase of 4.1, as against 3.7 and 0.7 respectively for the European Union as a whole (Eurostat 2006a). Nevertheless, this net migration is virtually equivalent to a surplus of 75,000 births leading to adults of reproductive age, and net reproduction at age 30, taking into account mortality and migration (Daguet 2002), is equal to one daughter per woman.
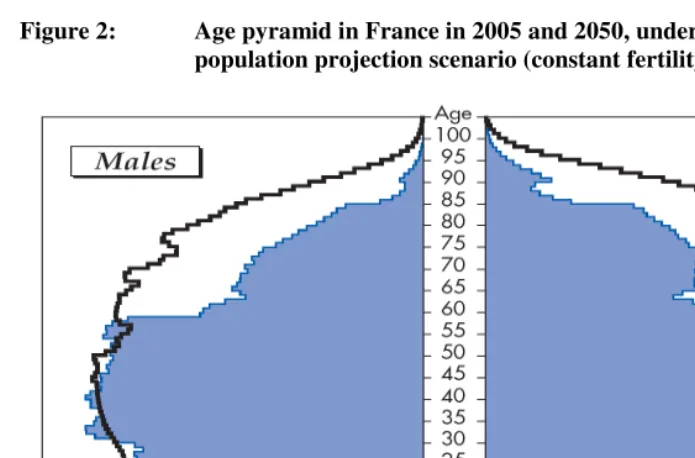
boomers reaching the end of their lifespan (Robert-Bobée 2006). Even in the very long run, when the baby boomers are dead, the population would remain quasi-stationary, with a constant population by age up to age 60, and a slightly increasing population at older ages if mortality goes on decreasing.
Figure 2: Age pyramid in France in 2005 and 2050, under medium
population projection scenario (constant fertility and migration)
Sources: INSEE, Population projection, medium scenario. Toulemon, Robert-Bobée, 2006
2.3 Ageing of fertility
the total fertility rate has been stable while the fertility schedule has moved to higher ages, with the shape of the fertility schedule becoming more and more symmetrical
around the mean age at childbirth. Several trends emerged during the 20th century, and
the current shift towards older ages is thus one among many other possible trends (Ní Bhrolcháin and Toulemon 2005).
Figure 3: Age-specific fertility rates in France, selected years
0 50 100 150 200 250
15 20 25 30 35 40 45 50
Age
P
e
r
th
o
u
s
a
n
d
1903 1923 1943 1963 1983 2003
Year
Sources: INSEE, civil registration data. Daguet, 2002; INSEE, 2007.
Figure 4: Partial TFR by age group (per 100 women), from 1900 to 2006
0 10 20 30 40 50 60 70 80 90 100
1900 1920 1940 1960 1980 2000
Year
15-19 20-24
25-29 30-34
35-39 40-49
Sources: INSEE, civil registration data. Daguet, 2002; INSEE, 2007; Toulemon, Mazuy, 2001
Figure 5: Mean age at childbirth from 1900 to 2006 in France, all births and first births
23 24 25 26 27 28 29 30 31
1900 1910 1920 1930 1940 1950 1960 1970 1980 1990 2000 Years of age
A
g
e
All births First births
Sources: INSEE, civil registration data. Daguet, 2002; INSEE, 2007; Toulemon, Mazuy, 2001. Authors’ projection for age at first birth after 1998
Women born in the 1940s had their first child earliest: During the 1960s, age at first sexual intercourse decreased, while no efficient contraceptive method was available. For subsequent cohorts, the mean age at childbirth rose, mainly due to an increasing age at first birth, while mean birth intervals did not change, according to the 1999 one percent survey on family histories (Toulemon 2001; see also 2.5 below). In the very recent period, no accurate estimate of the mean age at first birth is available, due to the lack of accurate data on birth order from civil registration (Prioux 2005).
2.4 Cohort fertility assumed to remain stable in future
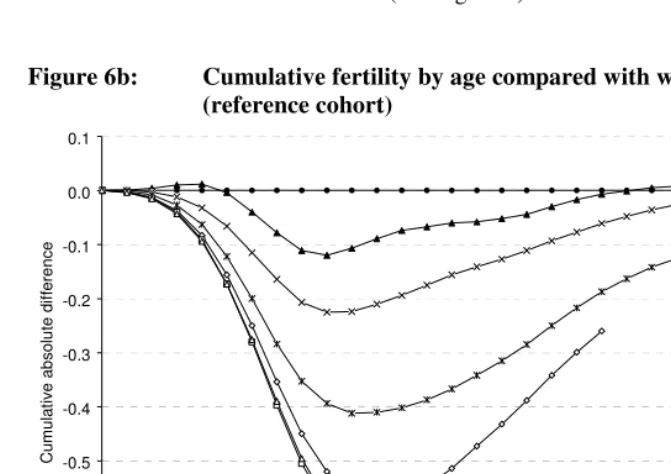
relative to cohort 1950, for women belonging to subsequent cohorts, at all ages. Cohorts were followed up to the end of 2004, and additional dots at ages 35, 40, and 45 present the results of the projection shown in Figure 1 for cohorts 1960, 1965 and 1970.
Figure 6a: Cumulative fertility by age
0.0 0.5 1.0 1.5 2.0 2.5
15 20 25 30 35 40 45
Age
C
u
m
u
la
ti
v
e
c
o
h
o
rt
f
e
rt
ili
ty
1945 1950 1955 1960 1965 1970 1975 1980 Cohort
longer decreasing for cohorts born after 1975. As fertility is still increasing at higher ages (see Figure 4), the total fertility rate is increasing too, and cohort fertility could stabilize for cohorts born after 1970 (see Figure 1).
Figure 6b: Cumulative fertility by age compared with women born in 1950
(reference cohort)
-0.7 -0.6 -0.5 -0.4 -0.3 -0.2 -0.1 0.0 0.1
15 20 25 30 35 40 45
Age
C
u
m
u
la
ti
v
e
a
b
s
o
lu
te
d
if
fe
re
n
c
e
1950 1955 1960 1965 1970 1975 1980
cohort
Sources: INSEE, 2007; Prioux, 2005
2.5 Fertility by parity
almost stable (Figure 7). The progression to the first child seems to decline, but the changing age at first birth shown in Figure 5 leads to a likely downward bias. The subsequent parity progression ratios, based on duration-specific fertility rates, are stable: The probability of a progression to a second, a third, and a fourth child has not changed since 1975. A comparison with parity progression ratios among cohorts of mothers shows that the cohort parity progressions ratios for women born after 1950 look like moving averages of the period parity progression ratios during the 1980s and 1990s (Toulemon and Mazuy 2001).
Figure 7: Period parity progression ratios based on age-specific first birth
rates and parity- and duration-specific rates for births of higher order (PDTFR)
0 10 20 30 40 50 60 70 80 90 100
1960 1970 1980 1990 2000
Year
P
e
r
c
e
n
t
a0 a1
a2 a3
a4
Source: Toulemon, Mazuy, 2001
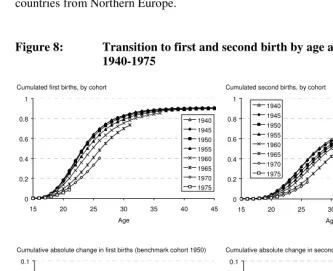
decline in fertility at young ages was not fully compensated at age 35: 84% of women born in 1960 were already mothers at age 35, compared with 88% of women born in 1950. The proportion of women who have a first child before age 50 could remain stable at 90% for cohorts born during the 1950s. It is likely that among younger cohorts more women will have no children at all, but the projected increase in childlessness is very limited: 11% of women born in 1970 may ultimately remain childless (see Figure 9 below). Cohort childlessness has increased in most Western European countries, except in Northern European states (Sweden, Denmark, Norway), and it is very likely to increase in countries of Central and Eastern Europe (Frejka and Sardon 2006). The evidence for increasing childlessness in France is still very limited, and it is possible that France will experience a very limited increase in childlessness, along with countries from Northern Europe.
Figure 8: Transition to first and second birth by age among women born in
1940-1975
Cumulated first births, by cohort Cumulated second births, by cohort
Cumulative absolute change in first births (benchmark cohort 1950) Cumulative absolute change in second births (benchmark cohort 1950) 0 0.2 0.4 0.6 0.8 1
15 20 25 30 35 40 45 Age 1940 1945 1950 1955 1960 1965 1970 1975 -0.4 -0.3 -0.2 -0.1 0.0 0.1
15 20 25 30 35 40 45 Age 1950 1955 1960 1965 1970 1975 -0.4 -0.3 -0.2 -0.1 0.0 0.1
15 20 25 30 35 40 45 Age 1950 1955 1960 1965 1970 1975 0 0.2 0.4 0.6 0.8 1
15 20 25 30 35 40 45 Age 1940 1945 1950 1955 1960 1965 1970 1975
This delay in first births does not lead to a decline in second births. On the contrary, the changes in cumulated second births are smaller, and the proportion of women with two children or more at age 35 moves from 66% to 65% for women born in 1940 and 1950, respectively. The decline is only 1% at age 35 and it is likely that women born in 1950 will have, at the age of 50, as many second children as women born in 1940. As a consequence, the proportion of women with one child could decrease (Figure 9).
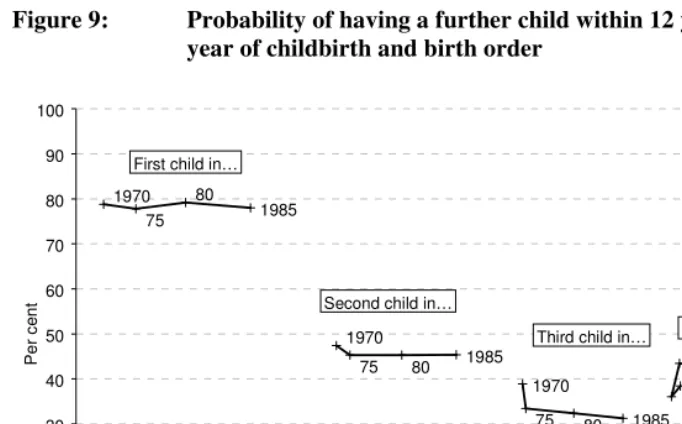
Figure 9: Probability of having a further child within 12 years of a birth, by
year of childbirth and birth order
80
751970 80
75 1970 80
75 1970 80
75 1970
1985
1985 1985
1985
0 10 20 30 40 50 60 70 80 90 100
23 24 25 26 27 28 29 30 31 32 33
Age at childbirth
P
e
r
c
e
n
t
First child in…
Fourth child in... Third child in…
Second child in…
Source: Toulemon, Mazuy, 2001
Looking at the progression to the next birth not among periods, but among parity cohorts (children born during the same year) (Figure 9), we see how the increasing mean age at childbirth is linked in France to a stable progression to the next birth, for all birth orders. Since the year 1980, as well as since cohorts of mothers born in 1950, fertility by birth order appears to be very stable, despite an increasing age at childbirth.
In all, cohort fertility is stable around or a little above 2.0 children per woman, while the mean age at birth increases. This stable average fertility is due to a stable distribution of family size. Among women born in 1950, 10% are childless, 20% have one child, 40% two children, 20% three children, and 10% have four or more children (Figure 10). A projection of fertility rates shows that the distribution is likely to remain stable, with the childless proportion showing a slight increase from 10% among women born in 1960 to 12% for cohort 1980.
Figure 10: Percentage distribution of women according to the final number
of children, by cohort
Childless 1 child
2 children
3 children
4+ children
0 5 10 15 20 25 30 35 40 45
1900 1910 1920 1930 1940 1950 1960 1970 1980
Cohort
P
e
r
c
e
n
t
Projection
This projection is based on parity- and duration-specific fertility rates observed during the 1990s. If the recent increase in fertility is taken into account, the estimate of the proportion of childless women might be even lower. However, women born in 1980 are now aged 25 and their future demographic behaviour is unknown.
2.6 Educational differentials in fertility are small and decreasing
Adult education is not common in France; hence, the final educational qualification achieved is a good proxy for social group. Using a methodology pioneered by Britta Hoem (1996), it is possible to construct a variable for level of education that is not correlated with birth cohort, such that it is possible to identify groups of men or women of lower or higher education relative to members of their own birth cohort. To do so, Robert-Bobée and Mazuy (2005) constructed groups with what they termed ‘short’, ‘long’ and ‘medium’ education, as follows: Men and women with two years less than the mean age at the end of enrolment among their cohort were considered to have short education; those with two years more than the mean age were considered to have long education; and those who stopped their education at the median age for their cohort, plus or minus one year, were considered to have a medium education. This enabled them to build groups with around 30% of the cohort on each side, compared to a
medium group5.
For men as well as women, the mean number of children has declined among all educational groups (Figure 11). The contrasts are much larger among women than among men. Among women born in 1950-54, who were aged 44-48 at the time of the 1999 FHS survey, the mean number of children ranges from 1.8 among women of long education to 2.4 for women of short education. This constitutes a difference of 0.6 children per woman, as against 0.8 for women born in 1940-44. The contrasts are thus slowly decreasing. Among men, the contrasts almost vanish for recent cohorts.
Among cohorts born in the 1950s, men of short education remain childless a little more often than others, and they also more often have three or more children. The differences are small, but significant due to the large sample size, and the group of less educated men is the most heterogeneous (Figure 12). The contrasts are greater among women: Females of long education are often childless, while their counterparts of short education often have large families. Women of medium education are likely to have exactly two children. Note that, among mothers (92%, 89%, and 83% of women with short, medium and long education, respectively), the distribution by number of children
5 Among men the distribution is about 40%, 35%, and 25% for short, medium, and long enrolment; among
is almost similar for women of long or medium education, while less educated mothers have more children. In all, the differences are small compared with other European countries. For instance, France does not exhibit such great polarization as Britain, where more women decide to remain childless, especially among the most educated
groups (Breton and Prioux 2005; Ekert-Jaffé et al. 2002).
Figure 11: Mean number of children by sex, level of education, and birth
cohort 1.7 1.9 2.1 2.3 2.5 2.7 2.9 3.1 1 9 1 5 -1 9 1 9 2 0 -2 4 1 9 2 5 -2 9 1 9 3 0 -3 4 1 9 3 5 -3 9 1 9 4 0 -4 4 1 9 4 5 -4 9 1 9 5 0 -5 4 1 9 5 5 -5 9 1 9 1 5 -1 9 1 9 2 0 -2 4 1 9 2 5 -2 9 1 9 3 0 -3 4 1 9 3 5 -3 9 1 9 4 0 -4 4 1 9 4 5 -4 9 1 9 5 0 -5 4 1 9 5 5 -5 9 Women Men N u m b e r o f c h ild re n Short Medium Long
Figure 12: Distribution of men and women born in 1950s by number of children, according to level of education
0.0 5.0 10.0 15.0 20.0 25.0 30.0 35.0 40.0 45.0
0 1 2 3 4 or
more
0 1 2 3 4 or
more
Women Men
P
e
r
c
e
n
t
Short
Medium
Long
Relative education
Source: Adapted from Robert-Bobée, Mazuy, 2005. Authors’ computations
2.7 Immigrant and native fertility
are already in France before having their intended children. Alternatively, the migrants’ behaviour may change upon their arrival in France, due to their experiencing new
conditions, such as living as a couple, having access to health services, etc. Given that
we do not have any information on immigrants before their migration, it is impossible to disentangle these interpretations, which are not mutually exclusive.
The TFR does not take this discontinuity in migrants’ life event histories into account: Age-specific fertility rates are based on exposures in France following migration and do not consider fertility before migration. Furthermore, immigrants arrive in France at various ages, so that for each age group there are newcomers ready to catch up on their fertility, which was delayed before migration. The TFR of immigrants is based on a non-consistent ‘synthetic cohort’ that would, at all ages, catch up for a nonexistent delay. It thus overestimates the lifetime fertility of immigrants (Toulemon 2006). Taking into account the duration since migration to France to construct a consistent index of lifelong fertility, the estimated excess fertility of immigrants, compared with women born in France, was 0.46 children per women during the 1990s (2.16 vs. 1.70). This is in contrast with the usual TFR, which suggests an apparent difference of 0.85 for lifelong fertility (Table 1). The excess fertility of immigrant women is thus less than 0.5 child per woman. Women from other European countries have a lower total fertility than natives, with the exception of those born in Portugal. Women born on other continents have a higher fertility; the excess is small for women born in Asia (0.1 children) and large for women born in Africa (around 1.0 children). For most countries of origin, immigrants’ fertility falls behind the fertility in their country of birth and the overall level of fertility in France, except for women born in Portugal, in Tunisia and in Turkey, whose fertility is higher. All in all, if we compute the fertility in the countries of origin of all female immigrants, each country being weighted by the number of immigrant women in France, the level of fertility ‘in
countries of birth’ is much higher than for immigrant women living in France (2.82 vs.
2.26). This average difference in fertility of 0.66 (2.82 - 2.26) is larger than the 0.44 difference between immigrant and native fertility in France (2.26 - 1.70). The fertility of immigrant women in France is closer to the fertility of women born in France than to the overall level of fertility in their countries of origin.
Even if net migration increased in the years 2000-2005, the current level of the TFR (1.92) would surely be higher than 1.8 if it were computed only for women born in France.
Table 1: Fertility differentials between immigrant women and women
born in France
Fertility differential with women born in France
of which:
Birthplace
Average number of
children per woman
(1)
total differential
pre- migration
post- migration
Fertility of women in the country
of origin (2)
Distribution of women aged 18-49 in 1999 (per cent)
All females 1.74 100
Women born in France 1.70 - - - 86.3
Immigrant women 2.16 0.46 -0.09 0.55 2.82 9.4
Other* 1.86 0.16 0.01 0.15 4.3
Country of birth of immigrants Spain 1.52 -0.18 -0.26 0.08 1.23 0.4
Italy 1.60 -0.11 -0.34 0.23 1.24 0.4
Portugal 1.96 0.25 0.12 0.14 1.49 1.3
Other European Union country 1.66 -0.05 -0.32 0.27 1.44 0.7
Other European country 1.68 -0.03 -0.20 0.18 1.41 0.5
Algeria 2.57 0.87 0.08 0.79 3.64 1.2
Morocco 2.97 1.26 0.23 1.03 3.28 1.3
Tunisia 2.90 1.20 0.12 1.07 2.73 0.4
Other African country 2.86 1.16 0.06 1.10 5.89 1.1
Turkey 3.21 1.51 0.23 1.28 2.90 0.5
Other Asian country 1.77 0.07 -0.18 0.25 2.85 0.9
America or Oceania 2.00 0.29 -0.31 0.61 2.54 0.4
France: excluding overseas departements (DOM) * : born French abroad or born in the DOM
(1) : total period fertility rate allowing for age at entry into France Scope: women and births, 1991-8
(2) : Standard period total period fertility rates, 1990-9 ; source United Nations, 2003
3. Changes in family behaviour since the 1970s
In the late 1960s, young people, and especially young women, in France as elsewhere in
Europe, wanted more autonomy and greater gender equality. This period marks the
beginning of substantial changes in gender and generational power relations.
Educational practices changed over the next few decades. An emphasis on relatively
strict discipline with children was replaced by a more rational, reasoning approach. The
child became an equal member of the family. Nowadays, more time and attention is
devoted to children and parenting is increasinglyvalued (de Singly 1996, 2000). Gender
relations have changed as well;women have entered the labour market, and men have
taken on some educational tasks (Ferrand 2004). Anthropologists and sociologists
report that norms regulating sexual behaviour tend to reflectexisting social hierarchies
(Godelier 2004). It is thus understandable that these changes in power relations were
accompanied by a change in sexual behaviour, thanks also to the ‘contraceptive
revolution’ which made effective, new medical methods available to women (Leridon et
al. 1987). Sexuality was separated from reproduction in the late 1960s. This change led
to, and in turn was greatly facilitated by, the introduction of medical contraception and
thelegalization of abortion. Contraception was legalized in France in1967 and abortion
in 1975.
The functions of the family have changed over the last few decades. It has become
less of a place to reproduce generational and gender hierarchies, andmore of a special
space where individuals forge their identity (deSingly 1996; 2000; Kaufmann 2004).
Feelings and love have become the centre of the family, a trend that explains the weakening of the conjugal bond, the loss of popularity of marriage, and the growing
complexity of marital trajectories. Contemporary French family sociologists do not
view these changes as signifying the ‘end of the family’. On the contrary, the family seems to have adapted rather well to the increased weight put on individual autonomy
(Attias-Donfut 2002; Segalen 2000). Although the conjugal bond has grown weaker,
the parent-child relationhas become stronger, a trend that may be seen, for example, in
the greateracceptance of social parenthood, including homosexual parenting(Godelier
2004).
3.1 Decline of marriage
computed from first marriage probabilities (life table estimates), was as low as 0.64 first marriages per woman in 2005. The intensity of first marriage increased in 1996, due to a change in the income tax rules. However, since 2000, the downward trend that began
in the mid-1970s has again been evident (Prioux 2005; Beaumel et al. 2006). It shows
that marriage is no longer a norm that applies to everyone. Since the mid-1980s, only one first union out of 10 has begun with a formal marriage, while nine out of 10 have begun with a period of unmarried cohabitation. It remains an open issue whether female first marriages will become more common after the age of 50, given that more and more unmarried women are living as a couple and inheritance taxes are very unfavourable to unmarried couples (Toulemon 1997). However, no such trend is apparent at present
(Beaumel et al. 2006). First unions are taking place later than before and the proportion
of men and women who will not live in a union before the age of 50 may increase slightly, from 6% among women born in 1950 to 7% for women born in 1970 (Prioux 2003). This decline in the proportion of women living in union is very limited compared to the decline of marriage. The number of births outside of marriage began to increase at the end of the 1970s and by 2010 they will probably outnumber births within marriage (Figure 13).
Figure 13: Annual number of marriages and births, France, 1960-2006
0 100 200 300 400 500 600 700 800 900 1.000
1960 1965 1970 1975 1980 1985 1990 1995 2000 2005
Year
T
h
o
u
s
a
n
d
s
All births Births within marriage Births out of marriage Marriages
Sources: INSEE, 2007, civil registration data.
It is too early to estimate the impact on family behaviour of the new form of union called Pacte civil de solidarité (Pacs), which is available for homosexual couples but also chosen by many heterosexual couples. This is all the more so, given that it is not, up to 2007, possible to obtain accurate figures on unions and disruptions by sex of partners (Festy 2001).
As a consequence of the decline of marriage, the proportion of married couples is falling steadily (Table 2). Between 1990 and 2004, the proportion of unmarried couples rose from 11% to 19%. The increase was more pronounced for unmarried couples with one child or, even more, two children and over, while the number of married couples living with children continued to decrease.
The changes in de facto conjugal situations are much less pronounced than for de
Table 2: Distribution of 100 couples by legal status and number of children living with a couple. France, 1990-2004
1990 1992 1994 1996 1998 2000 2002 2004
All couples 100 100 100 100 100 100 100 100
Odds Ratio 2004/1990
Unmarried 10.7 13.0 14.1 15.0 16.4 17.2 18.2 19.6 2.05
Married 89.3 87.0 85.9 85.0 83.6 82.8 81.8 80.4 0.49
With no child 55.0 56.0 56.8 57.3 57.8 58.6 58.6 59.3 1.19
With one child 19.5 19.2 18.6 18.6 18.3 17.9 18.2 17.5 0.88
With children 25.5 24.8 24.6 24.1 23.9 23.6 23.1 23.3 0.88
Unmarried, no child 6.8 7.8 8.4 8.7 9.1 9.2 9.6 10.2 1.54
Unmarried, one child 2.3 3.1 3.4 3.6 4.0 4.4 4.7 4.9 2.17
Unmarried, 2 children or more 1.5 2.1 2.3 2.8 3.3 3.6 4.0 4.5 3.14
Married, no child 48.1 48.2 48.4 48.6 48.7 49.4 49.1 49.1 1.04
Married, one child 17.1 16.1 15.1 15.0 14.3 13.5 13.6 12.5 0.69
Married, 2 children or more 24.1 22.7 22.3 21.4 20.6 19.9 19.2 18.8 0.73
Sources: Authors’ computations from INSEE, employment surveys
Note: The odds ratios OR in the last column compare, for each indicator, the proportion p1 in 1990 and p2 in 2004. They are
computed as [p2/(1-p2)] / [p1/(1-p1)]. They allow to compare proportions spread along the whole spectrum ]0;1[. The OR is near
to 0.5 for married couples and to 2 for unmarried couples, whose proportion almost doubled. The increase appears to be more pronounced for unmarried couples with children.
and 9% of women aged 18-49 are living with children and without a partner (Table 3), and stepfamilies more often comprise a mother and a stepfather rather than a father and a stepmother (Toulemon and Knudsen 2006).
The declining trend in marriages and the increase in unmarried cohabitation,
divorces, and de facto separation (Lefèvre and Filhon 2005; Prioux 2005; Sardon 2004)
are similar to that which is occurring in many other European countries. Hence, the conclusion that France is an outlier in all demographic behaviours is unwarranted.
3.2 Contraceptive use and abortion
change observed is the shift from non-medical to reversible medical methods. The pill and the IUD were used by 36.9% of women aged 20 to 44 in 1978, and 62.7% in 2000, the IUD mainly by women with children. Sterilization for the purpose of contraception was formally legalized only in 2001, but 4.7% of women aged 20 to 44 were sterilized in 2000 (Leridon et al. 2002; Bajos et al. 2004). The reconstitution of cohort series from the retrospective contraceptive data collected in the 1988 survey shows that among women born in 1938-1942, 49% have used the pill or an IUD before age 50, while 95% of women born in 1963-1967 will have done so (Toulemon and Leridon 1991). The replacement of ‘natural’ methods (withdrawal and periodic abstinence) by medical methods of contraception was achieved at the end of the 1980s. The proportion of users of medical methods continued to increase slightly in the 1990s at young ages, due to the delay in fertility. Following the emergence of the AIDS epidemic, the condom became the most popular means of contraceptive sexual initiation: While 23% of women who had their first intercourse between 1968 and 1974 used a condom, 59%
did in 1995-2000 (in combination with the pill or alone) (Rossier, Leridon et al. 2004).
This trend did not result in a fall in the proportion of young women who used medical contraception after they had been in a relationship for a time.
Table 3: Total population and distribution of 100 men and women aged 18
to 49 by conjugal status and presence of children and stepchildren
Men Women
Thousands
All
Not in couple
Married couple
Unmar. couple All
Not in couple
Married couple
Unmar. couple
All 10195 2595 5191 2410 11067 2660 5923 2485
No child 4613 2392 1110 1112 4299 1699 1476 1125
Children 5582 203 4081 1298 6768 961 4447 1360
Stepchildren 441 0 219 222 467 0 224 244
Men Women
Per cent
All
Not in couple
Married couple
Unmar. couple All
Not in couple
Married couple
Unmar. couple
All 100 25.5 50.9 23.6 100 24.0 53.5 22.5
No child 45.2 23.5 10.9 10.9 38.8 15.4 13.3 10.2
Children 54.8 2.0 40.0 12.7 61.2 8.7 40.2 12.3
Stepchildren 4.3 0.0 2.1 2.2 4.2 0.0 2.0 2.2
Sources: Authors’ computations from INSEE, employment survey, 2004. Men and women reference person of the household or his/her partner.
Table 4: Main contraceptive methods used in 2000, France, for 100 women in each age group
All All Age at 1.1.2001 18-19 20-24 25-29 30-34 35-39 40-44
18-44 20-44
Year of birth
1981-1982 1976-1980-
1971-1975
1966-1970
1961-1965
1956-1960
1956-1982
1956-1980
Proportion of women:
Currently using a reversible method : 63.3 79.3 76.1 72.4 74.5 70.6 73.6 74.5
of which
Pill and condom 15.0 6.5 1.3 1.4 0.9 0.2 2.9 2.0
Pill 38.9 61.8 55.4 42.3 32.3 27.8 42.9 43.3
IUD 0.0 0.9 7.5 18.3 27.6 29.6 16.1 17.4
Condom 9.2 8.6 7.7 8.0 6.2 6.7 7.5 7.4
Local feminine methods 0.2 0.0 0.1 0.4 0.5 0.9 0.4 0.4
Periodic abstinence 0.0 0.8 0.8 0.4 2.9 1.7 1.2 1.3
Withdrawal 0.0 0.2 3.2 1.4 3.5 2.6 2.1 2.2
…Other methods, unspecified 0.0 0.5 0.1 0.2 0.6 1.1 0.5 0.5
Not using a reversible method: 36.7 20.7 23.9 27.6 25.5 29.4 26.4 25.5
of which
Sterilized 0.0 0.0 0.3 0.9 5.7 16.3 4.5 4.8
Sterile 0.0 0.0 0.6 0.5 1.7 4.2 1.3 1.5
Pregnant 1.5 1.8 7.1 6.9 3.3 0.4 3.8 3.9
No sexual relations 33.3 17.1 6.6 8.4 6.5 3.5 10.0 8.2
Seeking to conceive 0.0 1.4 7.0 6.9 4.6 1.9 4.1 4.4
Other situations 1.9 0.4 2.3 4.0 3.7 3.1 2.7 2.7
All 100.0 100.0 100.0 100.0 100.0 100.0 100.0 100.0
N 98 336 578 629 668 554 2863 2765
Source: INSERM-INED, Cohorte Contraceptive, September 2000 to January 2001, women aged 18-44.
Abortion rates diminished during the 1980s from 19 abortions per 1000 women of reproductive age in 1981 to 14 per 1000 in 1991. They have remained stable since 1991 (Rossier and Pirus 2007, Table 5). The fall in the rates of induced abortions during the 1980s corresponds to the rising incidence of the use of medical contraception and hence to the diminution of the rate of unintended pregnancies, whose frequency remained stable during the 1990s (Reignier-Loilier 2005). At younger ages, the propensity to end an unwanted pregnancy has increased since the 1970s, which reflects the greater demand for fertility control due to the delay in fertility. After the rate of unintended pregnancies stopped falling at the end of the 1980s, the abortion rate at younger ages increased slightly during the 1990s (Kafé and Brouard 2000). In summary, young people, like the rest of the population, overwhelmingly use medical contraception to prevent unintended pregnancies (only 2% of women aged 18 to 19 and at risk of an unintended pregnancy do not use contraception, Table 4) but, when an accidental pregnancy occurs, they are ever more likely to interrupt it. France has today a relatively high rate of induced abortion by European standards, with an abortion rate of 14 per 1000 women a year in 2003 (Vilain 2005), which places France just after English-speaking and Nordic countries (Henshaw, Singh, and Haas 1999). Blayo (1995) attributes this relatively high rate to the absence of sterilization in France, Bajos (et al. 2004) to the difficulties met by women in managing their daily contraception and to the rather poor quality of contraceptive services.
Table 5: Frequency of induced abortion in France, 1976-2003
Year
Number of abortions declared in the
bulletin (1)
Number of abortion estimated by
INED (2)
Ratio of abortion per 100
births
Abortion rate per 1000 women aged
15 to 49
Total Abortion Rate (3)
1976 134 173 246 000 34.1 20.0 0.67
1981 180 695 245 000 30.4 19.0 0.64
1986 166 797 221 000 28.4 16.0 0.54
1991 172 152 206 000 27.1 14.0 0.49
1996 162 792 207 000 28.2 14.2 0.50
2002 137 497 207 000 27.2 14.0 0.51
2003 203 300 26.7 14.1 0.50
1) http://www.ined.fr/statistiques_ivg/.
4. Female and youth participation in the labour force
Cross-nationally, female participation in the labour force has become positively correlated with the level of fertility in Europe (Billari, Kohler 2004; OECD 2005; Fürnkranz-Prskawetz, Engelhardt, and Mamolo 2005). This positive correlation is also
observed in France, when different regions are compared (Del Boca et al 2004).
As in other European countries, women’s participation in the labour force has shown a long continuous upward tendency since the 1970s (OECD 2005). The level of female professional activity is high: In 2005 the activity rate of women aged 15 to 59 was 76.5%6. This level is lower than that of Northern European countries, such as Finland, Sweden or Denmark. It is similar to that of Portugal or Austria. The increase in female participation in the labour force has occurred irrespective of the number of children: From 1985 to 2002 it rose from 72% to 84% for mothers with one child, from 66% to 80% for women with two children and from 45% to 63% for those with three children. Indeed, the majority of women still work after they have had children; their employment is less often disrupted by childbearing than in other continental European
countries. Fourteen percent of working mothers aged 20-49 in 2005 had stopped
working after a first birth, 26% after a second birth, 41% after a third one (Pailhé and Solaz 2006). Working mothers of young children are well-accepted socially, both by individuals and by firms, whereas the ‘housewife’ model has become discredited socially. Attitudes towards female work have changed dramatically. According to CREDOC opinion surveys, 41% of French people thought in 1978 that women should not work while their children were young. This figure fell to 17% in 2004. More than 60% think that women should have the free choice to work. So, the dominant model is the two-career one. Among couples aged 20-49 where at least one partner has a job, both partners have jobs in 70% of cases. The man is the sole earner in 25% of couples, while the woman is the sole earner in 5% of couples (Eurostat, labour force survey).
4.1 Impact of 1994 child care allowance reform on fertility and participation in the labour force
However, this increasing trend in female participation in the labour force was interrupted in the mid-1990s, due to a reform in family policy with respect to childcare allowance. Since 1994, the childcare leave allowance, which previously could be
6 The female employment rate is lower than the activity rate, because the latter includes unemployed women
claimed by working women who stop working or begin to work part-time after the birth of a child of order three or more, until the child is three, has also been made available to mothers who give birth to or adopt a second child. This reform has had a great impact on the number of recipients: It tripled in three years, to about 500,000 (of whom only 2% are fathers). It is estimated that this leave has been an incentive to withdraw from the labour force for at least 112,000 women per year (Afsa 1998; Piketty 2005). The parental leave allowance was extended to mothers of a first child in 2004, for a period of six months after the birth. Even if it does not reach the level of Northern countries, the take-up rate is quite high: 10% after a first birth, 30% for second births, and 39% for births of order 3 and over (Mahieu 2005). The take-up rate for part-time parental leave is rather low: 5%, 20%, and 10%, respectively. The 1994 reform led to a large decline in young mothers’ participation in the labour force (Figure 14). Participation in the labour force has decreased rapidly for mothers of two children who have at least one child under three (within three years, the activity rate fell from 69% in 1994 to 54% in 1997, its level 15 years before). Nevertheless, job breaks are relatively short on average. Half of parity 1 mothers who stop work return to work after 18 months, and half of mothers of parity 2 or 3 do so after two years (Pailhé and Solaz 2006). Among mothers of one child, women who had their baby after 1994 resume work faster than those who had their baby before. That may be analysed as a cohort effect. However, among mothers of two children, this cohort effect seems to have been counterbalanced completely by the effect of the policy: Over the three years after the birth there is no difference whether the child was born after or before 1994.
The women who are more likely to leave the labour force are those who are less educated, have insecure jobs, poor working conditions, or poor work schedules. A combination of factors affects the decision to leave the labour force. Although women’s wages, and to a lesser degree those of their partners, do play a role, the worsening of working conditions and employment opportunities has contributed greatly to the success of the 1994 child care allowance reform (Marc2004). Parental leave is taken under duress for a large share of women. One half of mothers who have taken paid parental leave declare that they would have preferred to keep on working if their work conditions had been different or if childcare had been available (Méda, Simon, and Wierinck 2003).
Figure 14: Activity rate of women aged 20-49 living in couple with at least one child under 3, 1990-2005
0 10 20 30 40 50 60 70 80 90
1990 1991 1992 1993 1994 1995 1996 1997 1998 1999 2000 2001 2002 2003 2004 2005 Year
P
e
rc
e
n
t
1 child, aged under 3
2 children, youngest aged under 3 3 + children, youngest aged under 3
Source: INSEE, Employment surveys
4.2 Economic situation of young adults
The average length of studies has increased in France over the course of the last century. However, the median age at the end of schooling stopped increasing for cohorts born after 1975 (Durier 2006). Today, one person in two is still in full-time
education after age 20 (Robert-Bobée and Mazuy 2005). Compared with other
European countries, young adults are more often students or unemployed in France
(Chambaz 2001). Indeed, the unemployment rate of people less than 25 years old is
22% in France, compared with an average of 18% in the Euro Zone (Eurostat,
http://epp.eurostat.ec.europa.eu/). This could beattributed to the relative difficulty that
the rigid Frenchlabour market is experiencing in adapting to globalization (Kieffer et al
2005). However, social benefits received by the young are close to the European
average: 51% of people aged 18 to 29 receive some form of social support from the state (Chambaz, 2001). Age at departure from the parental home is also close to the
European average: Women born in 1968 left the parental home at a medianage of 22.6
and men did so at a median age of 24.5 (Villeneuve-Gokalp 2005). Altogether, 52%of
people 18 to 29 lived with their parents in 1996 (Chambaz 2001). Thehousing market
does not prevent young people from leaving their parents’ home. Combining job
incomes, state support, and parental support,Chambaz (2001) found that young French
people have, on average, one ofthe highest living standards in the European Union.
4.3 Age and gender inequalities in unemployment and wages
As in other European countries, the share of working men and women by profession differs. Women are more present in health- and education-related professions (INSEE 2004). Women are often white-collar at low or medium level, while men are more often blue-collar and high-level white-collar or self employed.
Figure 15: Unemployment rate of men and women aged 15-64, by sex and age group. France, 1990-2004
0 5 10 15 20 25 30 35 1 9 9 0 1 9 9 1 1 9 9 2 1 9 9 3 1 9 9 4 1 9 9 5 1 9 9 6 1 9 9 7 1 9 9 8 1 9 9 9 2 0 0 0 2 0 0 1 2 0 0 2 2 0 0 3 2 0 0 4 2 0 0 5 1 9 9 0 1 9 9 1 1 9 9 2 1 9 9 3 1 9 9 4 1 9 9 5 1 9 9 6 1 9 9 7 1 9 9 8 1 9 9 9 2 0 0 0 2 0 0 1 2 0 0 2 2 0 0 3 2 0 0 4 2 0 0 5 Women Men P e r All ages 15-24 25-49 50 and over
Source: INSEE, Employment surveys. http://www.insee.fr/fr/ffc/chifcle_fiche.asp?ref_id=NATCCF03302&tab_id=313&souspop=2
Despite there being many laws against gender discrimination at work, women’s wages are, on average, 19% lower than men’s in private firms (INSEE, Employment surveys). Controlling for experience, time schedule, and other possible confounders leads to a remaining difference of 15%. Among civil servants, the difference is around 14% (INSEE, 2004).
4.4 Gender roles within family
A Eurostat report on gender equity (Eurostat 2006b; Aliaga 2006) provides a number of
comparativeindicators on the gender division of domestic tasks. Because of women’s
lower activity rate compared to men and their greater propensity to work part-time, French women aged 20 to 74 spend, on average, less time each day (2h 31m) than men
(4h 03m) in employment (or studying). However, women spend 4h 30m a day on
domestic chores, compared with 2h 22m for men, a difference of 2h 08m a day,so that
have an additional 38 minutes of leisure a day compared with women. Men’s domestic
time is spent on gardening, repairing, and shopping, while women spend more time
preparing meals and cleaning.
French women are better off than Italian women (whose total working time is
higher and who workone and a half hours more a day than men, and have an hour less
leisure), but worse off than Swedish women (who work the same numberof hours a day
as men, and whose domestic work time exceeds that ofmen by ‘only’ one and a quarter
hours).
5. Social and population policies
The most obvious explanation for France’s relatively high fertility is its active family policy. We will consider family policies in a broad sense, in that we include social and public policies that may help to maintain high fertility. Indeed, some measures, with respect to such matters as education or housing, which were not designed to help families to have children, in fact have an effect on fertility7.
5.1 Current consensus
France has a long tradition of family policy. The State tends to stand in for families, with the aim of social equality as well as pro-natalism (Rosental 2003). French family policy is the result of the centuries-long political will of an early-formed central state to affirm itself against the power of the Catholic Church (Commaille and Martin 1998; Commaille, Strobel, and Villac 2002; Strobel 2004). By regulating the family sphere, the Republican state sought to beat the Church on its preferred ground and affirm its own power. These efforts were aided at the end of the 19th century by a strong pronatalist movement that stemmed from the early end of the historical fertility transition in France and the country’s defeat in the 1870 war against Germany (Rosental 2003). The family policy that was finally implemented after the Second World War was a compromise between a Catholic vision of the family and more progressive ideals of social equality. For example, the entire policy was based on the male breadwinner and female caregiver pattern, but the development of kindergartens, introduced at the same time, was meant to promote equal opportunities among French children. Family policy
7 Some companies’ practices may also be included in ‘family policies’. Some firms give allowances or
has always been a tool for regulating women’s place between the private and work spheres, and has been connected with employment policy (Commaille, Strobel, and Villac 2002). From the 1930s to the 1960s, this policy reinforced the pattern of the non-working mother, because family allowance was paid from the first child when the woman did not work. The policy was adapted further in the 1980s to accommodate the massive influx of women into the labour market. Collective and private care arrangements were developed for children under three, which helped women to reconcile family and work with almost no increase in men’s participation in childcare.
Current French family policy is a result ofa compromise between various political
trends. The yearly Conférence de la famille is the place where new family policy
measures are set out. Extensive dialogue with family movement associations, social protection bodies, union and management elected representatives, and experts precedes this conference. Religious institutions play a rather minor role.
This intervention of the State in the private sphere has long been accepted as legitimate. The State is perceived as the main stakeholder responsible for children (Letablier, Pennec, and Büttner 2003). The consensus on the importance of the family and State intervention goes beyond the political divide between right and left. However, there are divergences. Left-wing parties consider that family policy should be directed towards the poorest and adapt to changes in the family and behaviour. Considerations of gender equality have recently been advanced. Right-wing parties exhibit their pronatalist views more openly. Family policy should allow women to both raise their children and have more children. Moreover, right-wing parties argue for universal coverage for family policy, which should be distinguished from social policy.
In spite of a relatively high level of fertility compared with other European countries, the probirth tendency is still present in the political arena. It is more present in right-wing parties, but it is also deeply rooted in some left-wing parties. This tendency expresses both family and collective morality, and is more rationalistic than religious (Büttner, Letablier, and Pennec 2002). Its supporters are still anxious about the insufficient replacement of generations, and argue for increased support for families, particularly large families (Godet and Sullerot 2006; Franco 2006).
Current concerns have shifted gradually from the number of births to reconciling
work and family (Ministère de la famille, 2005). Family policy is designed to encourage
5.2 Mix of tools
France has a rather generous and diversified family benefit system. Public expenditure on the family is quite high. According to Eurostat data, it was 2.8% of the GDP in 2003, which is higher than the EU-25 average (2.1%), behind only Denmark, Sweden, Finland, Luxemburg, and Germany. However, the Eurostat nomenclature does not take
into account all benefits for families (such as the quotient familial or early schooling).
Including fiscal support for families, the State contribution is estimated to be 3.6% of the GDP. Hence, France may be seen as the European country with the most substantial family policy (Adema and Ladaique 2005).
The originality of French family policy is that it mixes probirth objectives and objectives of family assistance (Hantrais and Letablier 1996). This compromise between promoting families versus promoting the work-family balance and women’s employment has repercussions for the types of measure offered to families (see Appendix 1 for a summary of legal family benefits).
5.2.1 Measures encouraging women’s employment
Since the 1970s, a whole range of facilities, services, and allowances linked with working status have accompanied increasing female participation in the labour force. First, the early socialization of children through crèches and écoles maternelles or
nursery schools is encouraged. The number of crèches has increased since 1983. Crèche
feesare means-tested and parents may also claim tax deductions. Unlike in Northern countries, this type of care is available immediately after the end of maternity leave, i.e. from when the baby is two or three months old, and the hours covered are extensive: on
weekdays from 7:00-8:00 to 18:00-19:00. The école maternelle is a specifically French
‘leisure centres’ take over. In 2002, 37% of children aged two were enrolled and 97% at age three, despite the fact that this schooling is not compulsory (Blanpain 2006).
France dedicates only one quarter of its family expenditure to in-kind benefits and the share of cash benefit has grown over the years. As childcare facilities are costly and in order to create employment, private systems that are more individualized and flexible have been developed. Subsidized child-minders, allowances, and tax deductions have become new tools of family policy. Since 1980, an allowance paid to families with children under three (and then six) years old who are cared for at the home of a registered childminder has significantly reduced childcare costs. In 1986, another allowance was introduced for families who employ nannies to look after their children in the family home. Moreover, parents could deduct half of the cost incurred from their income tax. Some 70% of the total cost of childcare may be covered (Fagnani 1998). Moreover, families who employ someone to look after their children after school or on
Wednesday may claim tax deductions (the chèque emploi service universel). Finally,
according to a recent survey on child care, on weekdays, 61% of children under three years of age are cared for mainly by their parents, 21% by subsidized child-minders, 10% in a crèche, 7% by their grand-parents or family, and 1% by nannies at home (Blanpain 2006; Ruault and Daniel 2003).
In 1994, the family policy came to a crossroads. The reform of family policy, which had been implemented in a context of high unemployment, had the opposite intention of creating incentives to leave the labour force. The Allocation parentale d’éducation (APE) was designed to allow one of the parents (in practice, mothers) to devote themselves entirely to bringing up the newborn child until its third birthday. For a period of three years after a birth of order 3 or more, a fixed amount of money is given to a parent who stops working to raise their youngest child. Parents who decide to work part-time receive a partial allocation. This allocation has existed since 1985, but before 1994 it was available only after the third child. In 1994, it was made available to parents of a second child. Its goal was mainly to reduce public expenditure. In 2004, all existing infancy benefits were unified into a single one: the Prestation d’accueil du
jeune enfant (PAJE). The APE was replaced by the Complément libre choix d’activité
de la Prestation d’accueil du jeune enfant (PAJE) and was made available for the first
child for six months after birth8. A debate arose regarding the need to encourage
high-income men and women to be entitled to the leave and to reduce its negative effect on the career path. So, since 2006, parents of 3 children have been able to choose to have a one-year leave and receive a higher benefit or a three-year leave and receive a lower
8 Both entitlement conditions and benefits amounts remained unchanged, except for the mothers of a first
benefit. As we have seen before, this measure has been a success, even if the take-up rate is far behind those in Northern countries.
5.2.2 Measures encouraging large families
Beyond the measures that aim to reduce tensions between work and family, several measures have been designed to reduce the cost of children, since the end of the Second World War. As in Southern countries, these allowances are directed specifically towards families that have three or more children (Breton and Prioux 2005). They vary with the age of the children. Universal family benefits are available, but in France they are available only from the second child and are progressive. For instance, the allowances paid for families that have three children are 2.3 times higher than those for families that have two children. They are 3.6 times higher for families that have four children. Several means-tested allowances are also available as the core allowance of
PAJE for families that have at least one child under three. The complément familial is
substituted for these allowances for families that have at least three children when the youngest reaches the age of three. A means-tested allowance is also dedicated to single mothers until the youngest child reaches the age of three. On the other hand, a special tax rule named quotient familial favours families that have at least three children and that pay tax. The French tax system is not individual-based but family-based and from the third child, each additional child counts for one tax unit (instead of one half before),
which leads to significant tax deductions. This measure is a purely probirth one 9.
5.2.3 Other social policy measures
Other measures of social policy, which are not directly targeted at ‘family’ or ‘maternity’ risks, create transfers towards households according to their composition. For instance, the situation of the family has been taken in account in housing policies since 1948 (Aglietta, Blanchet, and Héran 2003). Some basic welfare benefits also take into account the number of children.
9 Income tax is not paid by individuals, but by households. The members of the household sum their incomes