Democracy and Environment Quality in Selected
Countries: An Application of Panel Data
Saeed Ghodrati1, Javad Harati*2, Azim Nazari 3
Received: May 31, 2016 Accepted: March 5, 2017
Abstract
his study investigates the relationship between quality of environment and democracy among different countries over the period of 2002 - 2012. Democracy and accumulated democracy indices have been considered as political inequality variables influencing the quality of the environment among different countries in the reduced form of Kuznets’ environmental curve (EKC) hypotheses model. The empirical analysis is conducted using four panel data sets for countries with different HDI from 2002 to 2012. The results indicate a significant positive relationship between the level of democracy and capital accumulation of democracy among all country groups. This relationship in group of countries with high human development index acts in form of N reversed which is the environmental Kuznets curve. This relationship in groups of countries with high, medium and low human development indices is in form of N. Based on the results, improvement of democracy indices leads to a better environment quality. Therefore, applying the relevant policies with democracy condition improvement in different countries, specifically in countries with low and medium human development indices, can make a positive impact on improving the quality of environment in these countries
Keywords: Environment Quality, Environmental Kuznets Curve Hypothesis, Democracy Level, Democracy Stock.
JEL Classification: K33, O13 C23.
1. Introduction
In the literature on environmental economics, the environmental Kuznets curve (EKC) hypothesis plays an important role in analyzing the environmental consequences of economic development (income
3. Department of Economics, University of Bojnord, Bojnord, Iran ([email protected]). 2. Department of Economics, University of Bojnord, Bojnord, Iran (Corresponding Author: [email protected]).
3. Department of Economics, University of Bojnord, Bojnord, Iran ([email protected]).
growth) .The EKC postulates an inverted-U shaped relationship between economic growth and certain types of pollution. In examining the EKC, studies initially rely on a simple reduced-form model in which measures of environmental quality (e.g., SO2 and CO2 emissions) are specified as only a function of income (e.g., Grossman andKrueger,1991; Shafik,1994; Agras and Chapman, 1999).
Although the recent EKC literature has identified several variables other than income affecting environmental outcomes, a less widely recognized variable is democracy, and stock of democracy (Gallagher and Thacker, 2008).Therefore, in this study, democracy and democracy stock have been considered as political variables which affect environment quality, in different countries. The countries studied, are classified into four categories based on the human development index including the countries with very high human development index, the countries with high human development index, the countries with medium human development index and countries with low human development index. Given that studies conducted on the environmental Kuznets curve have appraised the simple pollution indices like CO2 and SO2 (e.g. Stern et al., 1996;
Kaufmann et al., 1998; Zarzoso and Morancho, 2004), in the present study, the intended model is evaluated using the environmental quality composite index (EPI).
The remainder of this paper is organized as follow: Section 2 investigates the literature review; Section 3 highlights modeling and methodology, Section 4 highlights empirical results, and the last one concludes with a summary of the main findings and policy implications.
2. Literature Review
environmental pollution should proceed rapidly. When incomes reach higher levels later in time, they are able to lower their levels of environmental degradation.
A wide literature has been developed around the notion of the EKC, and it is not well understood in policy circles (Holtz-Eakin, Selden, 1995; Stern et al., 1996; Kaufmann et al., 1998 and List and Gallet, 1999).
In later studies, the models were analyzed using cross-sectional and panel data separately for every country to show the ECK hypothesis between pollution and income. Cole et al. (1997) found the evidence showing that only local pollution was consistent with EKC hypothesis. Herbagh et al. (2002) stated that the existence of an inverted U-shaped curve pattern is very sensitive to the changes in nations, cities and the sampled periods. The existence of EKC was investigated by Martinez-Zarzoso and Bengochea-Morancho (2004) in 22 member countries of OECD. No evidence was found for the existence of EKC in Turkey using the data of time series between the period of 1963 and 2003 related to the carbon emission and the panel data related to the sulfur emission between the period of 1992 and 2001.
Liao and Cao (2013) proved through the evidence of panel data for 132 countries that as the income increases, the amount of Carbon emissions per capita increases as well and when income reaches a specific level, the increase in Carbon stops. It also states that the results would depend on time and the countries. EKC is the common assumption in experimental literature regarding the pollution–income models. The explanatory variables have been less investigated in the mentioned models. Therefore, researchers have recently surveyed the democracy variables as effective political inequality variables for environmental quality in reduced model of Kuznets hypothesis.
The studies related to the effectiveness of democracy in environment are limited to two types: adverse effect or ineffectiveness of democracy in environmental quality and direct and positive effect of democracy on environment quality. First studies against the effectiveness of democracy in environmental quality are reported. Robert and Park's (2007) state that democracy almost has no impact on the emission rate of the pollution index CO2. Scrogges (1998)
between environmental quality indices (dissolved oxygen demand, particulate matter and waste pollution) and democracy controlling for the impact of income inequality.
individually or together control environment consequences via government. The results showed that democrat regimes produce less pollution than autocrat ones.
Yelin Tan (2012) investigated whether transparency policy can be created in the presence of domineering policy and how the transparency policy affects environment space improvement. He states although transparency is less expected in bureaucratic atmosphere of China with its dictatorship, non-governmental organizations (NGO) are able to create the international chain to help the environment.
Chen (2013) studied the relationship between democracy and environmental performance and the factors that has made this relationship. He concluded that democratic countries which have higher environmental performance are more effective in environmental health section.
However, some studies have reported different findings in terms of the relationship between democracy and environmental quality. Midlarsky (1998) declared that the indices of deforestation, CO2 emission and soil erosion by water show a negative and significant relationship between democracy and environment. Nevertheless, the protected area index indicates a positive and meaningful relationship and the indices of the water availability and soil erosion by toxic chemicals do not show any significant relationship between democracy and environment. Pelegrini and Gerlagh (2005) stated that the impact of democracy on environment is not considerable; however, corruption can seriously affect the environment. Therefore, the increase in democracy indices must be accompanied by the decrease in corruption to motivate the strict environmental policies. Pavitkina et al. (2013) declared that generally the impact of democratic government policies on marine environment is negative. This negative effect can decline when the level of income changes from low to average. Wealthy countries with the net national income of over 20,000 dollars, nevertheless, report a positive effect.
3. Theoretical Principles and Model Structure
3.1 Environmental Kuznets Curve (EKC)
that when per capita income increases, income inequality, at first, increases and then after reaching the certain level (turning point) it starts to decline. It means that, at early stages of the growth, income distribution becomes more and more unequal. It goes towards equality by the continuation of the economic growth.
The relationship between the per capita income and the income inequality can be depicted with a bell-shaped curve, well-known as Kuznets curve. Kuznets curve has found a new concept since1990s. The experimental samples regarding the relationship between the environmental degradation and the per capita income showed an inverted U-shaped relationship similar to the relationship between the per capita income and the income inequality in early Kuznets curve. After that, Kuznets curve has been used to describe the relationship between environmental quality levels and per capita income, named Environmental Kuznets Curve (EKC) for the first time in Panauto’s research, 1993 and Dinda, 2007. Accordingly, at the first stage of the economic growth, environment is not taken into account because of the low level of environmental awareness and inaccessible environmental technologies. Environmental degradation increases by the income growth, declining after reaching the certain level of income, shown with an inverted U– shaped curve.
At the higher levels of economic growth, advanced environmental technology and higher level of environmental awareness would reduce the environmental degradation and environmental quality would be improved by income reaching the turning point. This process is indicative of natural economic development from an agriculture based economy to a polluting industrial economy and finally to a clean economy based on services (Dinda, 2007).
Studying the experimental studies about Kuznets hypothesis based on the simple theoretical model introduced by Andreoni and Levinson (2001) showed the following reduced formula is used to determine the relationship between income and environmental quality.
The classical reduced functional form representing the EKC is given by Eq(1)
𝐸𝑄 = 𝛼 + 𝛽1𝑌𝑡+ 𝛽2𝑌2
Where EQ represents the general level of environmental stress and Y the income per capita. The inverted U-shaped curve deriving from such a formula requires β1 to be positive and β2 to be negative.
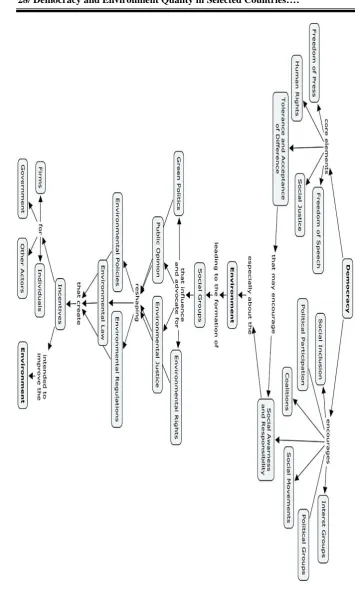
3.2 How is Environmental Quality Affected by Democracy?
Different discussions about democracy and environment imply that the relationship is not clear and ambiguous. For instance, Battig & Bernauer (2009) believed that although the impact of democracy on political commitment towards environment is positive, its impact on consequences of policies including the pollutants emission is ambiguous. On the other hand, some economists such as Glenditsch and Sverdrup (1995) insist on the positive relationship, and others such as Dinda (2011) mentioned the inverse relationship between democracy and environmental quality and other researchers like Mildarsky (1998) stated that if the groups playing the most important role in governments are not interested in environmental legislation, democracy may not have any effect on the increase in environmental quality.
F
ig
ure
1
: Demo
cr
a
cy
a
nd
t
he
E
nv
iro
nm
Callejas (2010) believed that the relationship between democracy and environmental quality can be investigated in four aspects. First, democracy highlights the problems with the political rights and freedom of information; hence people can hold political parties to access more information. Therefore, politicians have to pass environmental laws to satisfy the people. Second, democracy causes the division of political power, because it empowers not only one special class but all the citizens. Therefore, the environmentalists can cooperate more in enhancing the environmental quality. Third, democratic societies have more respect for regulations, private property rights and international agreements.
Finally, democracy can lead to economic equality. Therefore, the absolute power of the specific class would reduce, compelling the politicians to pass the social and economic laws according to the public opinions. By reducing the political corruption and collusion, they have to follow the regulations (including the environmental regulations), so that the environmental quality would be enhanced. Positive effect of democracy on the improvement of environmental quality is shown in Figure 2.
Env iron m e nt al Qual ity and, thus, incr ea si ng Env iro n me nt Pr o -E nv iro n me na l B e ha vio r fa vor in g t h e En vir on m e n ta l P ol ici e s En vir on m e n ta l R e gu la tion s Eli te s M aki n g n ow P ol iti ca lly fe asi b le C on tr ol D om in at ion low e rin g In cl u si on Eq u ali ty fos te r Em p ow e r in d u ci n g P ro -M ar ke t P ol ici e s In d iv id u al fr e e d om A re m or e R e sp e ct fu l of A gr e e m e n ts (In te rm at ion al) P riv at e P rop e rt y R u le of L aw e n co u ra gin g D e mo cr ati c S o citi e
s Soc
ie ty ’s E n vir on m e n ta l D e m an d s Th u s all ow in g f or a fa st e r re sp on se to En co u ra ge an d a llow for Sca tt e re d P ol iti ca l P ow e
r Pol
states that improvement of environmental quality parallels the economic growth and we need to follow the economic growth’s footsteps to improve the environmental standards. The higher level of income basically increases demand for a better environmental quality, which means the acceptance of environmental regulations and criteria.
The third approach, brought up in 90s, shows an inverted u-shaped relationship between environmental pollution and economic growth known as environmental hypothesis. According to the Kuznets curve hypothesis, economic growth is at first accompanied by the environmental degradation until it reaches the maximum point, then the environment improves at the higher level of growth which is observable in figure (3) – (Pazhoyan and Morad Hasel, 1386).
Figure 3: Inverted U-Shaped Relationship between Pollution and Income
The aim of this study is to show how democracy impacts the environmental quality for a group of countries with different levels of income classified based on the human development indices during (2002-2012) evaluated and analyzed in panel data. Therefore, the relationship can be clarified by the following formula according to Galacker and Tacker’s study (2008).
ln(𝑃𝑂𝐿/𝑃)𝑖𝑡 = 𝛼𝑖𝑡+ 𝛽1ln(𝑌/𝑃)𝑖𝑡+ 𝛽2(ln(𝑌/𝑃)𝑖𝑡))2+ 𝑍𝑖𝑡+ 𝜀𝑖𝑡 (2)
Where
P POP
an index of environmental quality is,
P Y
is the level
of income per capita, i shows the target countries and t is the time period. Z is also a vector of variables such as democracy affecting
Quadratic function (inverted-U shape) Pollution
environmental quality. Researchers have introduced different indices to measure the environmental quality. These indices are divided into two groups of the simple ones (such as CO2, SO2 …) and the compound ones such as environmental performance index (EPI) and environmental sustainability index (ESI), designated for the model depending on the aim of the research and statistics limitations. EPI is the index of environmental performance and its data are obtainable from www.epi.yale.edu. Environmental performance index, published in 2002, classifies countries based on the importance they attach to the environment including two aspects. One providing protection for human health against environmental threats and the other one is protection for ecosystem.
Different indices are used to measure democracy freedom house (FH) and polity 2 is the most important one. Some economists worked on this FH index. This index indicates the level of democracy as well as satisfying the citizens’ requests for supporting their environment. This index comprises freedom of speech, information transparency and the level of corruption formed by two sections, private right (PR) and civil freedom (CF) resulting in FH index. This index ranges from 2 to14, from the most democratic to the most autocratic country, respectively. Moreover, polity2, used in many studies, ranges from – 10 to +10, from the full autocracy to the full democracy, respectively. According to this, following model is used to appraise the impact of democracy on environment in the studied countries.
(3)
ln(𝑃𝑂𝐿/𝑃)𝑖𝑡 = 𝛼𝑖𝑡+ 𝛽1ln(𝑌/𝑃)𝑖𝑡+ 𝛽2(ln(𝑌/𝑃)𝑖𝑡))2+ 𝛽3(ln(𝑌/
𝑃)𝑖𝑡))3 + 𝛽4𝐷𝐸𝑀𝐿𝐸𝑉𝐸𝐿𝑖𝑡+ 𝛽5𝐷𝐸𝑀𝑆𝑇𝑂𝐶𝐾𝑖𝑡+ 𝜀𝑖𝑡
where, POL is the level of Environmental Performance Index. ∝𝑖𝑡
Intercept, Y per capita income, P population and DEMSTOCKit and
DEMLEVELit the level of democracy and democracy stock,
respectively. Bi is the model parameter which must be estimated. i is
democracy stock and applying the annual depreciation rate of 1% from the previous era to it.
DEMSTOCK index is separately calculated for each country according to the following equation:
(4)
𝐷𝐸𝑀𝑆𝑇𝑂𝐶𝐾𝑡 = ∑𝑇𝑡=1𝐷𝐸𝑀𝐿𝐸𝑉𝐸𝐿𝑡− 1
100∑ 𝐷𝐸𝑀𝑆𝑇𝑂𝐶𝐾𝑡 𝑇−1
𝑡=1
DEMSTOCKt and DEMLEVELt are democracy stock and the level
of democracy in the intended year, respectively. On the right side of the equation, the sum of the DEMLEVEL indices are separately calculated up to the specific year calculated separately for each country up to the intended year. Sum of the DEMSTOCK indices up to the year before intended year are calculated afterwards and 1% rate of depreciation is applied to it. Finally, the difference between the DEMLEVEL indices and the depreciated democracy stock is the democracy stock index in the intended year. DEMSTOCK calculation is important, because the current DEMLEVEL does not have a considerable effect on human resources development (Gerring et al., 2012), although the historical experiences of a country influence more on the human resources development than democracy. DEMLEVEL was only applied as an explanatory variable to the model in the previous studies, but the economists such as Gering et al. (2005) and Gallacker and Thacker (2008) also applied the DEMSTOCK to the model and tested its meaningfulness. System formation is a historical phenomenon and its structure is constructed during a time period regardless of the temporary changes, hence future and past effects are something to be considered. From this point of view, the whole democracy for a system must be considered as a stock variable not the DEMLEVEL for a specific period of time. The present democratic and autocratic thoughts are the concepts inherited from the past decades and centuries (Gerrring et al., 2005). The cumulative effect of the previous systems and the present conditions can clearly depict the democracy conditions and its impact on society, politics and economics.
and significant. As a result, considering the other circumstances to be constant, we anticipate that the increase in democracy during a period of time in a country can result in the improvement of environmental quality.
4. Experimental Results Analytics
4.1 Distinction Tests
An important advantage of panel data compared to time series or cross-sectional data sets is that it allows identification of certain parameters or questions, without the need to make restrictive assumptions. That is, panel data are not only suitable to model or explain why individual units behave differently but also to model why agiven unit behaves differently at different time periods (for example, because of a different past).
4.2 Experimental Results Analysis
Target countries are divided into four groups based on the human development index including countries with very high human development index, high human development index, medium human development index and low human development index. Kuznets environmental hypothesis model has been evaluated for four groups with DEMLEVEL and DEMSTOCK indices.
Countries introduced by UNO include 168 (out of 192) members of UNO. 24 members of UNO are excluded due to the lack of information regarding the human development index. Target countries are divided into different groups based on the UNO classification. Iran belongs to the group of countries with high human development index, according to the countries classification by UNO.
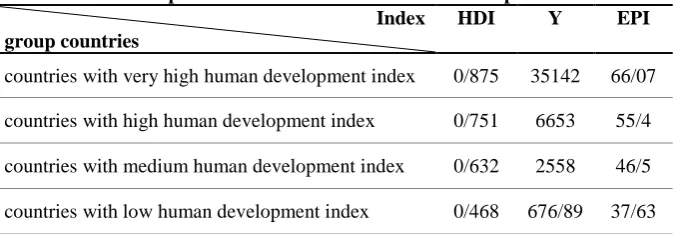
Table 1: A Comparison of Indicators between the Groups of Countries EPI Y
HDI Index
group countries
66/07 35142
0/875 countries with very high human development index
55/4 6653
0/751 countries with high human development index
46/5 2558
0/632 countries with medium human development index
37/63 676/89
Table 1 shows the means of the human development indices, per capita income and EPI in four groups of the target countries.
A reduction in human development index (HDI), as seen in table 1, is observable moving from the countries with very high human development index towards the countries with low human development index. It means the maximum of this index belongs to the countries with very high human development index and the minimum belongs to the countries with low human development index. Maximum and minimum of environmental performance indices belong to the countries with every high and low human development indices, respectively. Hence, we see that the change in environmental performance is in accordance with the change in human development index among the target countries.
4.3 Environmental Performance Index
Environmental performance index (EPI) comprises two main groups, environmental health and ecosystem vitality. Environment health calculates the protection for human health against the hazards induced towards environment. It calculates the ecosystem vitality, resources management and ecosystem protection. These two groups are divided into nine subgroups including the most important environmental issues such as weather quality, forests, aquatics, environmental variation, water resources and so forth. These nine groups are calculated by 20 indices for different countries. Total classification and subgroups of the environmental performance index are shown in Figure 4.
The EPI index ranges from 0 to 100,as zero is the indicative of the maximum distance from the aim (minimum value) or the worst environmental performance and 100 is the indicative of the minimum distance from the aim (maximum value) or the best environmental performance. Figure 5 shows this concept.
Figure 5: Performance Benchmarks EPI
4.4 Model Kind Identification Tests
Before estimating the model, it is necessary to determine the appropriate approach based on fixed or random effect models.
4.4.1 Individual Fixed Effect Test
F-Limer test has been used in this paper to find the features of the data as being pooled or panel. The findings show all data related to the countries group are panel. F-limer indicates the rejection of hypothesis (H0). Rejection of null hypothesis means that the intercept for each test is different, so the model is a panel.
4.4.2 Fixed Effects Test vs. Random Effects Test
For the panel analysis, the F test and Hausman test is employed to determine whether Fixed Effect model or Random Effect model is more appropriate to be employed. Table 2 shows the results for Fixed Effects Model, Random Effects Model, and Pooled Model.
We use the F-limer and Hausman tests for each group respectively, based on table 2 regarding the EPI index in different countries group.
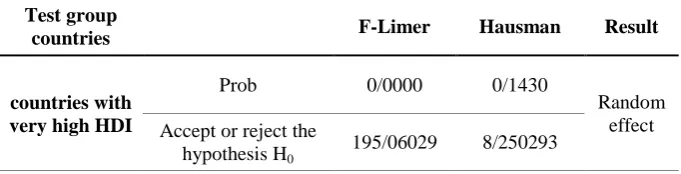
Table 2: F-limer and Hausman Test Results in Regard to EPI Result Hausman
F-Limer Test group
countries
Random effect 0/1430
0/0000 Prob
countries with very high HDI
8/250293 195/06029
Accept or reject the hypothesis H0
The performance of the country
Worst Performer
0 50 Best Performer 100
Proximity-to-Target Method
International Area
P
er
fo
rm
a
n
ce
b
en
c
h
m
ar
k
s
P
er
fo
rm
a
n
ce
b
en
c
h
m
ar
k
Fixed effect 0/0034
0/0000 Prob
countries with high HDI
17/639184 283/092568
Accept or reject the hypothesis H0
Fixed effect 0/0325
0/0000 Prob
countries with medium HDI
12/170765 528/615004
Accept or reject the hypothesis H0
Random effect 0/5925
0/0000 Prob
countries with low HDI
706024/3 850513/765
Accept or reject the hypothesis H0
In countries with very high human development index, F-limer shows the rejection of H0 and the model is panel. Moreover, Hausman test
confirms the hypothesis (H0) and the model is random regarding the
random and fixed effects in every segment. F-Limer and Hausman tests show the rejection of the hypothesis (H0) in countries with high
human development index and the model fixed effects. In countries with medium human development index, F-Limer and Hausman tests indicate the rejection of hypothesis (H0) and the model is fixed effects.
In countries with low human development index, F-Limer test also indicates the rejection of hypothesis (H0) and the model is panel;
Hausman test confirms the hypothesis H0 and the model is random in
each segment.
4.5 Model Evaluation
As mentioned before, the model introduced in this paper is evaluated for EPI index between 2002 and 2012 in four country groups. Kuznets environmental Curve model is in the following form with EPI index:
ln(𝐸𝑃𝐼/𝑃)𝑖𝑡 = 𝑥𝑖𝑡+ 𝛽1ln(𝑌/𝑃)𝑖𝑡+ 𝛽2(ln(𝑌/𝑃)𝑖𝑡))2+ 𝛽3(ln(𝑌/
𝑃)𝑖𝑡))3 + 𝛽4𝐷𝐸𝑀𝐿𝐸𝑉𝐸𝐿𝑖𝑡+ 𝛽5𝐷𝐸𝑀𝑆𝑇𝑂𝐶𝐾𝑖𝑡+ 𝜀𝑖𝑡
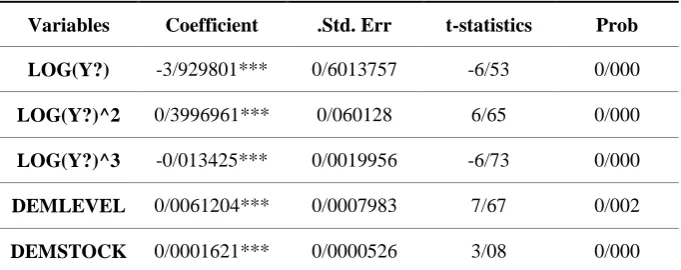
Table 4: Estimate for EPI Model Indicates in Group of Countries with Very High Human Development Index
Prob t-statistics
Std. Err .
Coefficient Variables
0/000 -6/53
0/6013757 -3/929801***
LOG(Y?)
0/000 6/65
0/060128 0/3996961***
LOG(Y?)^2
0/000 -6/73
0/0019956 -0/013425***
LOG(Y?)^3
0/002 7/67
0/0007983 0/0061204***
DEMLEVEL
0/000 3/08
0/0000526 0/0001621***
DEMSTOCK
Note: Significance at the 1% level is denoted by ***, **denoted significance at the level 5% ,
and * significance at the 10% level.
This relation aims to find out if the relationship among the variables such as 𝐷𝐸𝑀𝐿𝐸𝑉𝐸𝐿𝑖𝑡 and 𝐷𝐸𝑀𝑆𝑇𝑂𝐶𝐾𝑖𝑡 is significant with EPI index for target countries. The results are depicted in the following tables. After conducting multicollinearity and other specification tests, the results are show in Tables 4 to 7.
According to the results of table 4, there is a positive and significant relationship between the environment quality and the level of democracy, so the increase of one percent in the level of democracy index can make a change of 0/0061204 percent in environment performance index. Conclusively, when the democracy conditions improve, environmental quality improves too in countries with very high human development index. Similarly, democracy stock has a positive and significant effect on environmental quality. The increase of one percent in democracy stock can make a change of 0/0001621 percent in environmental quality.
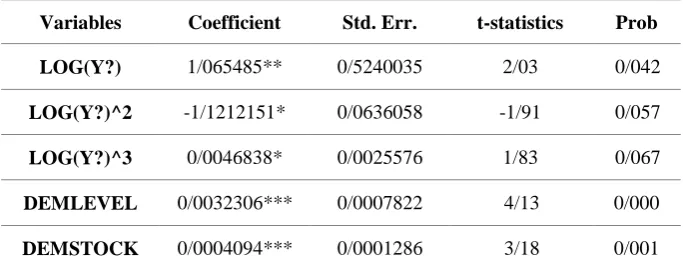
The model with EPI as the dependent variable has been estimated with GLS method and autoregressive process in order to remove the autocorrelation and heteroscedasticity for the countries with high human development index. The results indicate the positive and significant relationship between democracy and the environmental
Table 5: Estimate for EPI Model Indicates in Group of Countries with High Human Development Index
Prob t-statistics
Std. Err. Coefficient
Variables
0/042 2/03
0/5240035 1/065485**
LOG(Y?)
0/057 -1/91
0/0636058 -1/1212151*
LOG(Y?)^2
0/067 1/83
0/0025576 0/0046838*
LOG(Y?)^3
0/000 4/13
0/0007822 0/0032306***
DEMLEVEL
0/001 3/18
0/0001286 0/0004094***
DEMSTOCK
Note: Significance at the 1% level is denoted by ***, **denoted significance at the level 5% ,
and * significance at the 10% level.
relationship between pollution and income in all target countries. We study the relationship between the level of democracy and democracy stock with dependent variable, after we examined the relationship between the per capita income and the environmental performance index.
There is a positive and significant relationship between environmental quality and the level of democracy. According to table 5, increase of one percent in the level of democracy index can make a change of 0/00032306 percent in environmental performance index, which means when democracy condition improves, environmental quality improves too in the countries with high human development index. Similarly, democracy stock has a positive and significant effect on environment quality, so the increase of one percent in democracy stock can make a change of 0/0004095 percent in environment quality.
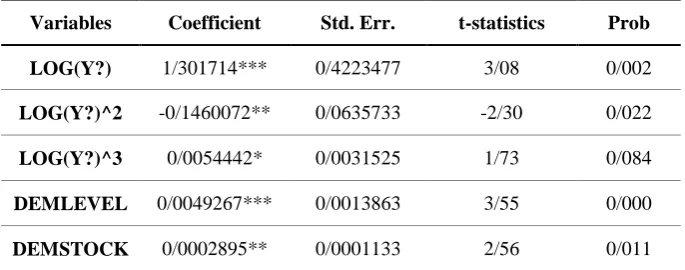
Table 6: Estimate for EPI Model Indicates in Group of Countries with Medium Human Development Index
Prob t-statistics
Std. Err. Coefficient
Variables
0/002 3/08
0/4223477 1/301714***
LOG(Y?)
0/022 -2/30
0/0635733 -0/1460072**
LOG(Y?)^2
0/084 1/73
0/0031525 0/0054442*
LOG(Y?)^3
0/000 3/55
0/0013863 0/0049267***
DEMLEVEL
0/011 2/56
0/0001133 0/0002895**
DEMSTOCK
Note: Significance at the 1% level is denoted by ***, **denoted significance at the level 5%
, and * significance at the 10% level.
the two independent variables, the dependent variable increases. However, there is a negative relationship between the logarithm of the second exponent of the per capita income and environmental performance index (EPI), meaning that by the increase in per capita income, environmental quality decreases. Hence, there is an N-shaped relationship between pollution and income in all target countries. We examined the relationship between the level of democracy and democracy stock with dependent variable, after we investigated the relationship between the per capita income and the environmental performance index.
According to table 6, there is a significant and positive relationship between the environmental quality and the level of democracy, so the increase of one percent in the level of democracy index can make a change of 0/0049267 percent in the environmental performance index. It means that when democracy condition improves, environment quality improves too in countries with medium human development index. Similarly, democracy stock has a positive and significant effect on environmental quality, as the increase of one percent in democracy stock can make a change of /0002895 percent in environmental quality.
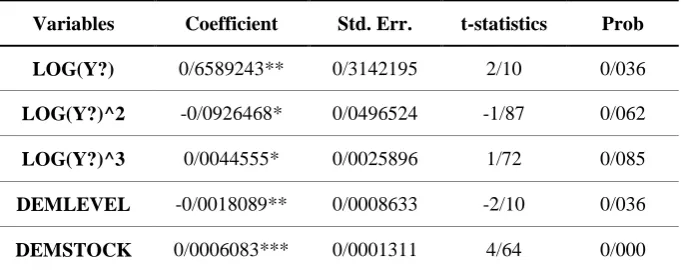
Table 7: Estimate for EPI Model Indicates in Group of Countries with Low Human Development Index
Prob t-statistics
Std. Err. Coefficient
Variables
0/036 2/10
0/3142195 0/6589243**
LOG(Y?)
0/062 -1/87
0/0496524 -0/0926468*
LOG(Y?)^2
0/085 1/72
0/0025896 0/0044555*
LOG(Y?)^3
0/036 -2/10
0/0008633 -0/0018089**
DEMLEVEL
0/000 4/64
0/0001311 0/0006083***
DEMSTOCK
Note: Significance at the 1% level is denoted by ***, **denoted significance at the level 5% ,
and * significance at the 10% level.
variables, the dependent variable increases. However, there is a negative relationship between the logarithm of the second exponent of the per capita income and environmental performance index (EPI) meaning that by the increase in per capita income, environmental quality decreases. Results show that there is an N-shaped relation between environmental performance index and gross income. Hence, there is an N-shaped relationship between pollution and income in all target countries. We examined the relationship between the level of democracy and democracy stock with dependent variable, after we study the relationship between the per capita income and the environmental performance index.
According to table7, there is a negative and meaningful relationship between the environmental quality and the level of democracy. The increase of one percent in the level of democracy index can make a change of %-0/00180089 in environmental performance index, meaning that the environmental quality decreased in countries with low human development index, when democracy condition improves. On the contrary, democracy stock has a positive and significant effect on environmental quality, as the increase of one percent in democracy stock can make a change of 0/0006083 percent in environment quality.
5. Conclusion and Policy Implications
countries are classified in four groups: countries with very high human development index, countries with high human development index, countries with medium human development index and countries with low human development index. The model used is based on the reduced form of Kuznets environmental hypothesis (EKC) and the level of democracy and democracy stock indices are considered as political inequality variables affecting the environmental quality. These two indices are calculated with the data of polity2 index. Combinational indices of environmental performance are used as a criterion for environmental quality. The index is calculated using 20 factors for different countries, ranging from 0 to 100, which zero shows the low performance and 100 shows the high performance. The index is better in comparison to the simple indices such as C𝑂2and S𝑂2, because apart from the air quality, it comprises other aspects of environment such as water and sewage quality, water resources and forests quality and so forth.
The results of the F-test indicate the suitability of panel model for estimation model in all four groups of the target countries. The results of the Hausman test shows the suitability of the estimation method with fixed effects for two groups of the countries with high and medium human development index and the suitability of the method with random effects for two groups of the countries with very high and low human index. What is more, the model regarding the environmental performance index is analyzed in different countries. Statistically, the results show that there is a significant relationship between the level of democracy and the democracy stock with EPI. When the democracy conditions improve, environment quality improves too.
income reaches a certain level, the environmental performance index starts to increase. The increase in EPI is considered as an improvement in environmental quality, and the decline shows poor environmental performance. Hence, the increase in EPI is in accordance with the reduction in environmental pollution.
The results of the model estimation in the groups of countries with high, medium and low human development index depict that all variables related to per capita income are statistically significant and there is an N-shaped relationship between per capita income and environmental performance index. At first by the increase in per capita income EPI increases too and after the per capita income reaches a certain level, EPI starts to decrease. Democracy makes more space for political participation raising awareness. It also attaches more importance to public opinions in a country, encouraging them to be more responsible for their surroundings. Therefore, the followings are highly recommended. Forming social groups and political organizations supporting the environment in different countries lead to raising awareness, environmental rights and justice. In different countries group, when the mean of per capita income increases, the society demands higher environment quality. The environment quality improvement in different countries group is the result of the formation of social groups, political organizations supporting the environment and the increase in income. Therefore, applying the policies regarding the improvement of democracy and public participation especially in countries with medium and low human development index results in the improvement of environmental quality and sustainable development. Moreover, facilitating the formation of NGOs leads to extension activities within the different domains of democracy such as environment in different countries group.
environment hypothesis curve to transform in the presence of the environmental combinational indices.
References
Barrett, S., & Graddy, K. (2000). Freedom, Growth, and the Environment. Environment and Development Economics, 5(4), 433– 456.
Bättig, M., & Thomas, B. (2009). National Institutions and Global Public Goods: Are Democracies More Cooperative in Climate Change Policy? International Organization, 63(2), 281–308.
Bernard, S., Hotte, L., & Winer, S. L. (2012). Democracy, Inequality and the Environment when Citizens can Mitigate Privately or Act Collectively. European Journal of Political Economy, 34, 142-156.
Bernauer, T., & Koubi, V. (2009). Effects of Political Institutions on Air Quality. Ecological Economics, 68(5), 1355–1365.
Bohn, H., & Deacon, R. T. (2000). Ownership Risk, Investment, and the Use of Natural Resources. The American Economic Review, 90(3), 526–549.
Buitenzorgy, M., & Mol, P. J. (2011). Does Democracy Lead to a Better Environment? Deforestation and the Democratic Transition Peak. Environmental and Resource Economics, 48, 59–70.
Callejas, D. G. (2010). Democracy and Environmental Quality in Latin America: A Panel System of Equations Approach, 1995-2008. Borradores Departamento de Economia, 36, 234–249.
Chen, V. (2013). Democracy and the Environment: An Empirical Analysis and Observations from Taiwan’s Maturing Democracy (Unpublished Master Thesis). Stanford University, Stanford.
Congleton, R. D. (1992). Political Institutions and Pollution Control. The Review of Economics and Statistics, 74(3), 412–421.
Didia, O. D. (1997). Democracy, Political Instability and Tropical Deforestation. Global Environmental Change, 7(1), 63–76.
Dinda, S. (2004). Environmental Kuznets Curve Hypothesis: A Survey. Ecological Economics, 49, 431-455.
Downs, A. (1957). An Economic Theory of Democracy. Harpercollins College, Journal of Political Economy, 67(2), 208-211
Dryzek, J. S. (1992). Ecology and Discursive Democracy: Beyond liberal Capitalism and the Administrative State. Capitalism, Nature, Socialism, 3(2), 18–42.
Farzin, Y. H., & Bond, C.A. (2006). Democracy and Environmental Quality. Journal of Development Economics, 81(1), 213–235.
Fredriksson, P. G., & Wollscheld, J. R. (2006). Democratic Institutions Versus Autocratic Regimes: The Case of Environmental Policy. Public Choice, 130, 381–393.
Gallagher, K. P. & Thacker, S. C. (2008). Democracy, Income, and Environmental Quality. Working Paper, Political Economy Research Institute, Retrieved from http://www.peri.umass.edu/.
Gerring, J., Bond, P. H., Barndt, W., & Moreno, C. (2005). Democracy and Growth: A Historical Perspective. World Politics, 57(3), 323–364.
Gerring, J., Thacker, S. C., & Alfaro, R. (2007). Democracy and Human Development. The Journal of Politics, 74(1), 1–17.
Gleditch, N. P., & Bjorn, O. S. (1995). Democracy and the Environment. 36th Annual Convention of the International Studies Association, Retrieved from http://www.isanet.org/.
Harbaugh, W., Levinson, A., & Wilson, D. (2000). Reexamining the Empirical Evidence of the Environmental Kuznets Curve. The Review of Economics and Statistics, 84(3), 541-551.
He, J., Makdissi, P., & Quentin, W. (2007). Corruption, Inequality, and Environmental Regulation. Working Paper, Retrieved from
http://gredi.recherche.usherbrooke.ca/wpapers/GREDI-0713.pdf.
Holtz-Eakin, D., & Selden, T. M. (1995). Stokingthe Fires? CO2 Emissions and Economic Growth. Journal of Public Economics, 57, 85–101.
Kane, M. J. (1993). Promoting Political Rights to Protect the Environment. Yale Journal of International Law, 18, 389–411.
Kempf, H., & Rossignol, S. (2005). Is Inequality Harmful for the Environment in a Growing Economy? Economics and Politics, 19, 53–71.
Kaufmann, R. K., Davidsdottir, B., Garnham, S., & Pauly, P. (1998). The Determinants of Atmospheric SO2 Concentrations: Reconsidering the Environmental Kuznets Curve. Ecological Economics, 25, 209– 220.
Kinda, S. R. (2011). Democratic Institutions and Environmental Quality: Effects and Transmission Channels. Proceedings of the German Development Economics Conference, 46, 36-68.
Kuznets, S. (1963). Quantitative Aspects of the Economic Growth of Nations. Economic Development and Cultural Change, 11, 1–80.
List, J. A., & Gallet, C. A. (1999). The Environmental Kuznets Curve: Does one Size Fit all? Ecological Economics, 31, 409–423.
Liao, H., & Cao, H. S. (2013). How Does Carbon Dioxide Emission Change with the Economic Development? Statistical Experiences from 132 Countries? Global Environ Change, 23, 1073–1082.
Midlarsky, M. I. (1998). Democracy and the Environment: An Empirical Assessment. Journal of Peace Research, 35(3), 341–361.
Payne, R. A. (1995). Freedom and the Environment. Journal of Democracy, 6(3), 41–55.
Pellegrini, L., & Gerlagh, R. (2005). An Empirical Contribution, Democracy and Environmental Policy. Journal of Environment and Development, 15(3), 332–354.
Roberts, J. T., & Parks, B. C. (2007). A Climate of Injustice: Global Inequality, North-South Politics, and Climate Policy. Cambridge: MIT Press.
Roca, J., Padilla, E., Farre, M., & Galletto, V. (2001). Economic Growth and Atmospheric Pollution in Spain: Discussing the Environmental Kuznets Curve Hypothesis. Ecological Economics, 39, 85–99.
Scruggs, L. A. (1998). Political and Economic Inequality and the Environment. Ecological Economics, 26(3), 259–275.
Schumpeter, J. (1950). Capitalism, Socialism, and Democracy. New York: Harper and Row Publishers.
Selden, T. M., & Song, D. Q. (1994). Environmental-Quality and Development – is there a Kuznets Curve for Air-Pollution Emissions. Journal of Environmental Economics and Management, 27, 147–162.
Shen, J. Y. (2006). A Simultaneous Estimation of Environmental Kuznets Curve: Evidence from China. China Economic Review, 17, 383–394.
Song, T., Zheng, T., & Tong, L. (2008). An Empirical Test of the Environmental Kuznets Curve in China: A Panel Cointegration Approach. China Economic Review, 19, 381–392.
Stern, D. I., Common, M. S., & Barbier, E. B. (1996). Economic Growth and Environmental Degradation: The Environmental Kuznets Curve and Sustainable Development. World Development, 24, 1151– 1160.
Stern, D. I., & Common, M. S. (2001). Is there an Environmental Kuznets Curve for Sulfur? Journal of Environmental Economics and Management, 41, 162–178.
Torras, M., & Boyce, J. K. (1998). Income, Inequality, and Pollution: Reassessment of the Environmental Kuznets Curve. Ecological Economics, 25(2), 147–160.
Ward, H. (2008). Liberal Democracy and Sustainability. Environmental Politics, 17(3), 386–409.