in the population sciences published by the Max Planck Institute for Demographic Research Konrad-Zuse Str. 1, D-18057 Rostock · GERMANY www.demographic-research.org
DEMOGRAPHIC RESEARCH
VOLUME 10, ARTICLE 4, PAGES 83-120
PUBLISHED 17 MARCH 2004
www.demographic-research.org/Volumes/Vol10/4/
DOI: 10.4054/DemRes.2004.10.4
Descriptive Findings
Fertility behaviour of recent immigrants
to Israel: A comparative analysis of
immigrants from Ethiopia and the
former Soviet Union
Petra Nahmias
1 Introduction 84
2 Fertility changes of migrants 85
3 Fertility changes in country of origin 87
3.1 Fertility rates in the FSU 87
3.2 The proximate determinants of fertility in the FSU 88
3.3 Fertility rates in Ethiopia 89
3.4 The proximate determinants of fertility in Ethiopia 90
4 Fertility rates in Israel 92
5 Hypotheses 93
6 Data 93
6.1 Births 93
6.2 Abortions 94
6.3 Marriage 94
7 Fertility of new immigrants 95
7.1 Fertility changes in Israel 95
7.2 Changes in the proximate determinants of fertility in Israel 103
8 Discussion and conclusions 109
Notes 114
References 115
Descriptive Findings
Fertility behaviour of recent immigrants to Israel:
A comparative analysis of immigrants from Ethiopia and
the former Soviet Union
Petra Nahmias1
Abstract
The fertility practices of immigrants are a particularly interesting field of study for demographers, providing an insight into the fertility behaviour of individuals when both the society and the individual undergo a period of rapid change. This paper describes and compares the fertility behaviour of two large groups of immigrants, from the former Soviet Union (FSU) and from Ethiopia to Israel in the last 20 years. The changes in fertility behaviour undergone in the same society and at the same time by two very different groups are examined. The findings reveal that the fertility behaviour of immigrants is indeed changing. The fertility of FSU immigrants is increasing and that of the Ethiopian immigrants decreasing, with accompanying changes in the proximate determinants of fertility. Although the fertility of immigrants is becoming more similar to that of the receiving society, the methods employed to achieve the fertility change are not necessarily similar, and, in some cases, diverge from the norms of the receiving society.
1
1. Introduction
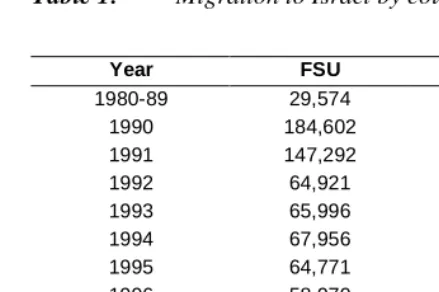
Fertility changes of migrants have long provided fertile ground for demographers. The sharp transition from one society to another, with the accompanying changes in individual status as well as the more obvious contextual differences, are of great interest to those studying fertility dynamics. Societies usually change at a slower rate than the changes experienced by migrants, so migrants provide a picture of fertility changes in a rapidly changing context. Israel, as a largely immigrant society, provides a perfect case study of the fertility changes experienced by migrants. In addition to the large numbers of migrants, the registration of vital events is of a high quality, including migration which is notoriously difficult to track. Israel has the added advantage of having received migration waves from countries with vastly differing fertility regimes, both from one another and from that in Israel.
Table 1: Migration to Israel by country of birth, 1980-2000
Year FSU Ethiopia
1980-89 29,574 16,971
1990 184,602 4,137
1991 147,292 20,014
1992 64,921 3,650
1993 65,996 864
1994 67,956 1,193
1995 64,771 1,319
1996 58,970 1,414
1997 54,586 1,659
1998 45,963 3,109
1999 66,706 2,292
2000 50,776 2,205
Source: Central Bureau of Statistics [Israel], 2001
These immigrants arrived from countries with widely differing fertility regimes to those prevalent amongst the Israeli Jewish population. The paper seeks to document the demographic data available, and to that end presents results on the main trends in fertility of immigrants to Israel from the FSU since 1989 and from Ethiopia since the 1980s, and also on their fertility in the country of origin. The paper hypothesizes, based upon established fertility theories and also the experiences of immigrants to other countries, that the fertility behaviour of immigrants will converge towards the norms prevalent amongst the Israeli Jewish population. It also aims to provide a contextual framework for the fertility behaviour of immigrants based on previous experience and empirical theories developed thereof. It then goes on to discuss these changes in terms of the fertility policy prevalent in Israel and the effect of the absorption process of the immigrants on fertility patterns and to predict future changes. The paper ends with a brief set of conclusions.
2. Fertility changes of migrants
process may be at work with a subsequent decrease in fertility to below the prevailing German levels.
Schoenmaeckers, Loedwijckx & Gadeyne (1999) in their research on first and second generation immigrants to Belgium from Morrocco and Turkey found that young women clearly preferred smaller families to older women and that this difference was more pronounced with Moroccan immigrants, who have higher fertility, than with Turkish. Migration to Belgium had a serious impact on contraceptive use with modern methods replacing traditional and overall usage increasing.
Abbasi-Shavazi & MacDonald (2000) gave precedence to cultural factors and the idea of ‘cultural maintenance’ in their analysis of the changing fertility practices of immigrant women in Australia. Amongst their findings was the increased fertility of immigrants from the Netherlands, both first and second generation, in Australia, which is pertinent for the FSU immigrants to Israel.
Immigrant women to Israel in the 1950s from North African and Asian countries experienced fertility decreases towards the veteran population whereas immigrant women from European countries in the same period experienced an increase in fertility towards the norm. Friedlander & Goldscheider (1978) attribute the changes in the fertility of immigrants mainly to economic conditions and furthermore, Friedlander et al (1980) found that socio-economic status, rather than cultural differences, is the determining factor of fertility decline amongst immigrants from Asia and Africa. Immigrants who were more exposed to elements of socioeconomic change in Israel, those who married after immigration or the more educated controlled their fertility through both spacing and stopping. However, the less educated and those married prior to immigration employed only stopping. In another study, it was found that immigrant women from Asia and Africa desired smaller families than their husbands. However, due to the prevalent gender power relations amongst such immigrants, women are not usually the reproductive decision makers. Thus fertility may be higher than desired or clandestine abortions may be sought (Okun, 1997a). Okun (1997b) asserts that socio-economic factors, or the adaptation approach, alone did not account for the fertility decline of Asia-Africa immigrants but acted in tandem with cultural factors, i.e. the innovation-diffusion approach. It is likely that the absorption of Ethiopian immigrants will resemble the patterns of absorption of these non-European groups (Weinstein, 1985) given the similarities in their original fertility regimes.
abortion as a means to control their fertility. However, although their abortion application rates were 26% higher than the average Israeli Jewish woman, the rates were significantly lower than those prevailing in the Soviet Union at the time. Interestingly, these immigrants preserved the pattern of early childbearing, followed by stopping rather than delaying childbearing. This immigrant group may provide less of a pre-cursor to the behaviour of the current immigration wave due to the heterogeneity of fertility behaviour within the FSU since a large majority of the immigrants of the 1990s, unlike the immigrants of the 1970s, came from the relatively developed European Soviet republics and especially from the large urban centres.
3. Fertility changes in country of origin
3.1. Fertility rates in the FSU
The fertility rates in the FSU are relatively low, even when compared with European countries. Although the fertility in some of the Asian republics is above replacement level, all other republics have fertility levels well below those of replacement level. That being said, childbearing is concentrated at younger ages, with high age specific fertility rates. Together with the low overall fertility rates, the fertility rates of older women will correspondingly be very low. Accordingly, the fertility control of FSU women has been achieved mainly through stopping rather than delaying childbearing.
The concentration of childbearing in younger ages has been increasing in recent years with rates at younger ages increasing along with decreasing overall levels. The decrease in fertility is accounted for by larger decreases in the older age groups, which decreased by more than 50% in the 35 and older age groups between the 1950s and the 1980s (Imbrogno & Imbrogno, 1989). By 1991, the fertility rates of the 15-19 age group exceeded the rates in all age groups above 30 (Zakharov & Ivanova, 1996).
Jewish women, in both the Ukraine and Russia have even lower fertility rates than those prevalent in the general population – in 1979 the Jewish fertility rate was about half that of the general population (Kostantinov, 1991). Between 1988-1989 and 1993-1994, the TFR of Russian Jewish women fell by 46% from 1.5 to 0.8 (lower than the overall urban TFR and lower even than overall TFR of Moscow and St. Petersburg) (Tolts, 1997). The situation is further complicated by the fact that the fertility of the FSU population is in a state of flux, with the FSU experiencing a substantial decline in fertility since the onset of the socio-economic transition in 1989, which of course coincides with the beginning of the mass emigration to Israel (Kohler & Kohler, 2002).
from European republics will have lower fertility than immigrants from Asian republics, in accordance with the prevailing fertility regimes in those countries. Nonetheless, the overall fertility of the FSU is still significantly lower than the Jewish Israeli norm of about 2.5, with the mostly Jewish immigrants from the FSU to Israel having even lower fertility than the general population. Additionally, fertility has decreased in the FSU during the 1990s (although has been showing signs of recovery in recent years), and thus new immigrants to Israel can also be expected to reflect these trends (at least in terms of tempo).
3.2. The proximate determinants of fertility in the FSU
The low fertility rate of the FSU is surprising given the high marriage rate. Prior to the 1990s, the prevalence of marriage was high and the mean age of marriage was low. During the 1990s, the marriage rates have decreased although the mean age of marriage has remained stable, indicating that people are not simply postponing marriage (Micevska, 2002). However, marriage may no longer play such an important role in childbearing as in the past. In 1993, nearly one in five babies were born out of wedlock (Kingkade, 1997), reaching nearly one in three by the end of the 1990s (Zbarskaya, 2001). Thus the governing proximate determinant is now the age of entry into sexual union, which unfortunately is not registered in vital statistics.
bring their first pregnancy to term in Eastern European countries than in other developed countries (Kulczychi, 1999:9). Abortions are thus often obtained by older, married women who want to end childbirth but who use less efficient, traditional contraceptive methods (Kulczychi 1999:9).
Contraceptive use is much harder to measure. In general, the method mix of FSU women is different to women in developed countries, with a heavy reliance on traditional methods. Amongst modern methods, the IUD was the main method employed, with the Pill and condoms featuring very low (Popov, 1991). Russian women (and presumably women from other Republics of the FSU) are increasingly using modern contraceptives to limit their fertility, with two thirds of married women using some form of family planning in 1994 compared with 60% in 1990 (Kingkade, 1997). The decline in fertility since 1988 has not been matched with an increasing abortion rate – in fact, the abortion rate has been decreasing (Zakharov & Ivanova,1996). Although the registration of induced abortions has deteriorated, evidence suggests that Russian women are indeed moving from abortion to efficient methods of contraception (Zakharov & Ivanova,1996; Kingkade 1997). Since these changes have been taking place whilst immigration from the FSU to Israel has been occurring, it is assumed that the fertility patterns of earlier immigrants will differ from those of later immigrants, and we can expect immigrants to arrive with higher levels of contraceptive use.
3.3. Fertility rates in Ethiopia
Table 2: Fertility Rates by Age and Place of Residence, Ethiopia, 2000
Age Specific Fertility Rates
Place of Residence
15-19 20-24 25-29 30-34 35-39 40-44 45-49
Total Fertility Rate
Urban 50.2 139.3 142 154.7 91.6 17.3 4.8 3.0
Rural 114.4 256.4 277.5 258.7 182.8 98.7 20.8 6.0
Total 100.5 234.8 250.6 243.3 167.8 88.6 18.8 5.5
Source: DHS, 2002
It can be seen that the differences between urban and rural localities are marked. Furthermore, Addis Ababa has particularly low fertility. In 1990, reported fertility in Addis Ababa was 2.6 and in the mid-1990s it had declined further to 1.8 – below replacement level fertility (Ashagrea, 2002).
3.4. The proximate determinants of fertility in Ethiopia
Marriage in Ethiopia is nearly universal and occurs at young ages, with a median age of 16.4 and less than 0.5% of women aged 40 and over never married. (DHS, 2002). The median age of marriage is the same age as the median age of entry into sexual union, indicating that there is little sexual activity and resulting childbirth outside of marriage, with only approximately 1% of Ethiopian women cohabiting. This is in stark contrast to the situation in many other countries of sub-Saharan Africa which are characterized by an informal polygamous mating system.
Fertility in Ethiopia may be lower due to pathological sterility. Mammo and Morgan (1986)state that childlessness in Ethiopia is high due to sexually transmitted diseases, particularly gonorrhoea. It is known that the prevalence of veneral disease resulted in remarkable levels of childlessness in Central Africa. The introduction of antibiotics reduced this phenomenon but fertility levels still remain depressed (Jones, 1992:138). Although it is difficult to gauge how much this affected the Jewish community, it is feasible that the improved health conditions and increased awareness in Israel may lead to a decrease in infertility and possibly a rise in the natural fertility of the population. Additionally there are parts of Ethiopia where malaria is endemic which would lead to higher rates of spontaneous abortion and thus depress fertility.
insusceptibility. In this case, urban women use contraceptives instead of breastfeeding to space their births so there is no overall rise in fertility.
Table 3: Selected demographic indicators, Demographic and Health Survey,
Ethiopia, 2000
Current use of contraceptives (% of currently married women) Desire to limit
childbearing (% of currently married women)
Age at 1st marriage (women aged 20-49)
Mean duration of postpartum insusceptibility
Any Modern
Urban 40.3 17.8 10.5 35.6 28.3
Rural 30.9 16.2 20.1 4.3 3.3
Total 32 16.4 19.6 5.9 4.7
Source: Demographic and Health Surveys (2002)
DHS data show that contraceptive use in Ethiopia varies widely between urban and rural localities, and the use of contraceptives by urban women is more than 8 times that of rural women. Amongst rural women, contraceptive use in 2000 is low, but still higher than the negligible 2.6% contraceptive use reported in 1990 (Ashagrea, 2002). The low level of urban fertility was achieved with one of the weakest family planning programmes in the world (Ashagrea, 2002) and even resistance by medical personnel to the introduction of contraceptives (Kebede, 2001).
particularly in Addis Ababa due to lower fertility desires and superior access to health services.
4. Fertility rates in Israel
Israel is a heterogeneous country in many respects, including the realm of fertility. The various population groups exhibit diverse fertility behaviour. For example, the population group ‘Jews and others’ had a TFR of 2.59 in 1999 as opposed to a TFR of 4.33 amongst the Arab population (note 2). Since the immigrants are absorbed into Israeli Jewish society, it is assumed that their fertility will become more like the society into which they are absorbed. It is important to note that fertility in Israel, even Jewish fertility, is still significantly higher than that of other developed countries.
However, even amongst ‘Jews and others’ fertility behaviour is not homogeneous. Friedlander and Feldman (1993) point out that religiosity and fertility are correlated in Israel. Rough estimates of the TFR of the ultra orthodox are around 7 children per women and those of the national orthodox about 4.5. FSU immigrants are, on the whole, non-religious and therefore it is to be expected that whilst there is an increase in the fertility rate it will not exceed the fertility rate of secular Jewish Israelis, which although higher than the FSU rate is about replacement level fertility. Many of the Ethiopian immigrants identify with more religious and traditional groups within Israeli society. Thus, although their fertility is expected to decrease, they may be more likely to adopt the fertility practices of the religious population rather than the secular population.
5. Hypotheses
As has been demonstrated, immigrants tend to adopt the fertility practices prevalent in the absorbing society. As such, it is expected that the immigrants from the FSU will increase their total fertility rate to the level of secular Israelis, about replacement level. However, they will do so by increasing the fertility rates at older ages and there may even be a decrease in rates at younger ages. Ethiopian immigrants will also converge to the levels of Israeli society, although the society in to which they are absorbed may also include national-religious society. As a result, I expect the fertility of Ethiopian immigrants to decrease to a level slightly higher than secular Israelis – around 2.5 children per women. In both cases, it is hypothesized that the average age of first birth will increase, along with the overall average age of birth amongst FSU immigrants due to the delaying of childbearing amongst both groups, and the increase in fertility in older age groups amongst FSU immigrants.
The methods used to achieve the changes are not necessarily the same as those of the general population. It is known that the methods used by immigrants are not always the same as the receiving society, particularly during times of change. However, I do expect a number of changes to occur. Firstly, the age of first marriage of both Ethiopian and FSU women will increase. In other words, women will delay entering marriage and as a result (or perhaps a result of) delay childbearing. FSU immigrants will replace the use of abortions with the use of modern contraceptives and as a result, abortion rates will decrease. On the other hand, Ethiopian immigrants will increasingly use abortion to control fertility in conjunction with increasing contraceptive use.
6. Data
The data used in this study is mainly based upon the birth files of the Israel Central Bureau of Statistics (ICBS) from 1980 to 2000. Other data has been calculated from ICBS abortion and marriage files. In some cases it has been possible to further supplement the data with data from various publications of the ICBS, with the aim of constructing a time series of changes in rates during the 1990s.
6.1. Births
child. Variables recorded include identification details of mother, place of birth, religion, place of birth of parents, year of aliya (immigration), birth history of mother. Since the registration of a birth is necessary in order to obtain various benefits, it is assumed that coverage is nearly complete. The registration of a birth is controlled by the Ministry of the Interior, who, once a month, transfer the file of all births registered in that month to the ICBS. Most of the data is of high quality following record linkage with the national population register to fill in unknown variables, apart from variables which cannot be linked such as schooling and occupation which are of such poor quality that they cannot be reliably used.
6.2. Abortions
The abortion data is supplied by means of a form that applicants fill out when applying to the pregnancy termination board. Some of the variables on the form, particularly those of direct relevance to the outcome of the application such as age and marital status are statistically reliable. Others, such as contraceptive use are unreliable. A problem with estimating abortion rates are illegal abortions. Sabatello (1995) estimated that there are an additional 5,000-6,000 illegal abortions each year in Israel, which represent about a quarter of all legal abortion applications. From conversations conducted with social workers attached to the boards, it is suspected that many FSU immigrants seek an immigrant doctor from the FSU, often those not yet authorized to practice medicine in Israel, to conduct the abortion. This opinion is backed up by Remennick et al (1995). Since the illegal abortion is most often performed under relatively safe and hygienic conditions, it is not possible to estimate the extent of this phenomenon from hospital emergency room admission records. Therefore we use data from applications to the board, but with the knowledge that it is an underestimation.
6.3. Marriage
marry in Israel are marrying abroad. On their return to Israel, they register their marriage with the Ministry of the Interior and this data also reaches the ICBS.
7. Fertility of new immigrants
7.1. Fertility changes in Israel
As expected, an increasing fertility rate is seen amongst immigrants from the FSU and a decreasing fertility rate is seen amongst immigrants from Ethiopia. Figure 1 shows the TFR of immigrants from the FSU and from Ethiopia compared with that of the Jewish Israeli population.
Figure 1: Total Fertility Rate by country of birth, 1986-2001
0 1 2 3 4 5 6 7
1986 1987 1988 1989 1990 1991 1992 1993 1994 1995 1996 1997 1998 1999 2000 2001
T
o
ta
l F
er
tilit
y
R
a
te
Israel (Jewish) FSU (immigrated 1990 onwards) Ethiopia Second large wave of
Whilst the Israeli Jewish TFR has remained constant at slightly above 2.5 children, the TFR of immigrants from Ethiopia has decreased from 4.60 in 1996 to 3.85 in 1999 – a decline of over 16% in 4 years. With immigrants from the FSU the picture is less clear and the TFR fluctuates from a low of 1.31 in 1991 to a high of 1.72 in 1995. However, due to the ongoing immigration both from the FSU during the 1990s and from Ethiopia during the 1980s and 1990s, these rates are obviously influenced by the continuous addition of new immigrants. Thus, the picture may be clearer if the population is divided according to immigration cohorts, as shown in table 4.
Table 4: TFR by year of immigration, immigrants from FSU,1990-2000]
Years Since Migration
1 2 3 4 5 6 7 8 9 10 11 1990 1.39 1.38 1.59 1.75 1.84 1.79 1.83 1.78 1.76 1.78 1.66 1991 1.42 1.51 1.62 1.77 1.81 1.87 1.84 1.74 1.72 1.61 1992 1.86 1.70 1.77 1.88 1.83 1.90 1.68 1.66 1.65 1993 1.79 1.63 1.77 1.80 1.91 1.71 1.78 1.71 1994 1.61 1.44 1.68 1.74 1.73 1.74 1.60 1995 1.50 1.62 1.81 1.75 1.75 1.83 1996 1.20 1.30 1.42 1.48 1.53 1997 1.17 1.24 1.31 1.32 1998 1.03 1.22 1.28 1999 1.07 1.10 Year of
immigration
2000 1.22
With Ethiopian immigrants it is not possible to analyse their behaviour by single year of immigration because their population size is much smaller. They are therefore grouped into two distinct groups by period of immigration – those who immigrated until 1989 and those who immigrated from 1989 and onwards(note 4). Figure 2 shows their TFR according to this division between 1996 and 2001.
Figure 2: TFR of immigrants from Ethiopia by period of immigration, 1996-2001
The data quite clearly show a significant decline in the TFR with time for both groups of immigrants. Although the TFR of both groups is still higher than that of Jewish Israelis, the 2001 TFR of immigrants who immigrated until 1989 is close to the Jewish TFR. The rate of decline of the TFR of new immigrants who immigrated since 1990 is greater and the gap between them and earlier immigrants is narrowing. Each additional year in Israel leads to a drop of 0.37 in TFR for newer immigrants and 0.21 for older immigrants.
0 1 2 3 4 5 6
1996 1997 1998 1999 2000 2001
Year
T
o
ta
l F
er
tilit
y
R
a
te
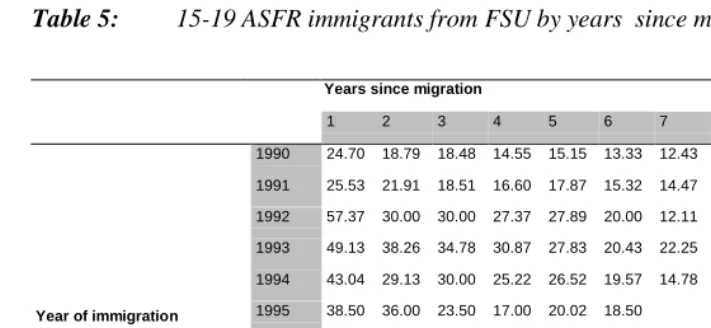
Although the age specific fertility rates (ASFR) are the constituents of the TFR, they are also an important indicator of reproductive behaviour in their own right and changes in TFR are not necessarily caused by proportional changes in the ASFRs. Amongst immigrants from the FSU the obvious trend is one of decrease amongst younger women, especially those in the 15-19 age group. This would seem to be contrary to the trend of increasing TFR, but the decrease amongst younger women is compensated for by increased fertility rates at older ages. These changes are in accordance with those expected since the age-fertility function is becoming comparable to that of the Jewish Israeli population.
Figure 3: ASFR selected years, FSU immigrants
These fertility changes hold true when a cohort analysis is conducted. The changes are greatest amongst the 15-19 age group which is presented in table 5. The 1992
0 20 40 60 80 100 120 140 160 180
15-19 20-24 25-29 30-34 35-39 40-44 45+
Age
Fe
rt
ilit
y Rat
e
immigration cohort stands out as having arrived with extremely high fertility rates for the 15-19 age group. Within 6 years this rate was more than halved.
Table 5: 15-19 ASFR immigrants from FSU by years since migration, 1991-2001
Years since migration
1 2 3 4 5 6 7 8 9 10 11 1990 24.70 18.79 18.48 14.55 15.15 13.33 12.43 12.42 8.79 8.79 8.95 1991 25.53 21.91 18.51 16.60 17.87 15.32 14.47 12.34 10.64 7.87 1992 57.37 30.00 30.00 27.37 27.89 20.00 12.11 14.23 10.00 1993 49.13 38.26 34.78 30.87 27.83 20.43 22.25 19.13 1994 43.04 29.13 30.00 25.22 26.52 19.57 14.78 1995 38.50 36.00 23.50 17.00 20.02 18.50 1996 37.37 27.89 15.81 17.92 11.58 1997 36.47 27.06 17.06 14.71 1998 28.13 18.75 17.50 1999 18.28 12.78 Year of immigration
2000 19.58
Figure 4: ASFR immigrants from Ethiopia, selected years 1986-2001
As with immigrants from the FSU, the amount of time in Israel is an indicator of fertility behaviour. When the immigrants are divided into two groups according to their period of immigration, their behaviour can be seen to be different.
Figure 5: ASFR by period of immigration, immigrants from Ethiopia, 1996 and
2001
0 50 100 150 200 250
15-19 20-24 25-29 30-34 35-39 40-44 45+
Age
Fe
rt
ilit
y
r
a
te
2001 1997 1991 1989 1986
age exaggeration
0 50 100 150 200 250
15-19 20-24 25-29 30-34 35-39 40-44 45+
Age
Fertility rate
For both groups of immigrants the age-fertility functions are fairly similar to one another, although the fertility of the new immigrants is higher. Both groups show elevated fertility amongst older women. The fertility of women aged 40-44 is almost the same as that of women aged 35-39, which results in an odd age-fertility function. This does raise suspicions of the misreporting of age but since the function is similar in both groups it is possible that this is an accurate reporting of fertility patterns. Further work needs to be carried out in order to determine the cause of the age-fertility function, which deviates from that usually witnessed in populations.
Figure 6: 15-19 ASFR by period of immigration, immigrants from Ethiopia,
1996-2001
Amongst younger women the process of convergence is apparent. The rates of women aged 15-19 are shown separately in Figure 6. In 1996, the 15-19 ASFR amongst women who immigrated after 1990 was over 50 per thousand, whereas that of veteran immigrants was slightly less than 10. In 2001 the ASFR of immigrants before 1990 had
0 10 20 30 40 50 60
2001 2000
1999 1998
1997 1996
Year
F
er
tilit
y
r
a
te
risen slightly to 11.7 and that of new immigrants had dropped dramatically to 16.1. However, this rate was still much higher than the Jewish Israeli rate in 2001 of 6.9 (which includes in it also the ultra-orthodox population with elevated fertility levels). Thus it can be seen that the immigrant groups are converging with each other in terms of the fertility behaviour of young women and not with secular Jewish Israeli society.
Figure 7: Average age at first birth, immigrants by country of birth, 1986-2001
The average age at first birth is another indicator of the changing age-fertility function. All immigrants show an increasing average age at first birth as Figure 7 shows. This demonstrates clearly that young immigrant women are increasingly delaying the commencement of childbearing. Interestingly, the veteran Ethiopian immigrants have overtaken veteran Jewish Israelis in the average age at first birth. Overall, the increase in age at first birth is more marked amongst immigrants from Ethiopia than amongst immigrants from the FSU. Amongst earlier immigrants from Ethiopia, each additional year in Israel adds 0.41 to the average age at first birth, whilst for later immigrants the
19 20 21 22 23 24 25 26 27 28 2001 2000 1999 1998 1997 1996 1995 1994 1993 1992 1991 1990 1989 1988 1987 1986 1985 Year A v er age age at f ir st b ir th
figure is 0.37, and for immigrants from the FSU 0.15. In all cases time spent in Israel explains more than 80% of the variance in average age at first birth. A cohort analysis by year of immigration for FSU immigrants reveals similar trends. With the exception of the earliest immigrants (1990 immigration cohort), who arrived with relatively high average ages at first birth, all cohorts increased the average age at first birth. Interestingly, one sees an initial increase followed by a decrease, although not to the previous levels.
Table 6: Average age at first birth, FSU immigrants by year of immigration and
years since migration, 1991-2001
Years since migration
1 2 3 4 5 6 7 8 9 10 11 1990 25.10 25.10 25.33 25.44 25.80 25.58 25.94 24.73 24.80 25.11 25.10 1991 24.56 25.15 25.66 25.75 25.81 26.07 25.34 25.18 25.46 25.52 1992 23.63 24.86 25.58 25.54 25.91 24.84 25.07 25.42 25.78 1993 23.71 24.53 24.73 25.81 24.20 24.65 24.84 24.63 1994 23.81 24.59 25.18 24.12 24.33 24.64 25.09 1995 23.98 24.49 24.37 24.64 25.06 25.17 1996 24.27 24.16 24.77 25.14 25.59 1997 23.84 23.83 24.40 24.93 1998 23.52 24.70 24.41 1999 23.95 25.05 Year of immigration
2000 23.85
7.2. Changes in the proximate determinants of fertility in Israel
Figure 8: Percentage of births to single women, by country of birth, 1990-2000
Overall, extra-martial childbearing is much less prevalent in Israel than in other developed countries, although the phenomenon is on the increase. Immigrants from the FSU show an increase in the percentage of unmarried mothers between 1990 and 2000 from 3.3% of all births in 1990 to nearly 10% in 2000, compared with only 3% of all births for veteran Jewish women. Although there is an overall trend amongst the veteran Jewish population of increasing births to unmarried mothers, the proportional increase amongst immigrants from the FSU is greater. Ethiopian immigrants who immigrated since 1990 show a similar trend although the rise is more moderate and fluctuates, increasing from 4% to 8% between 1990 and 2000. Amongst Ethiopian immigrants who immigrated up to 1989, there is no clear trend, with a decrease between 1990 and 1993, an increasing rate until 1998 when it reached a high of 8.7%, and a small decrease since then. In all cases the percentage of unmarried mothers is higher than in the overall Jewish population and there is no obvious narrowing of the differentials. Unfortunately, we do not have data on cohabitation at the time of birth, in other words we do not know if the mother is indeed a single parent or living in a household with the
0 2 4 6 8 10 2000 1999 1998 1997 1996 1995 1994 1993 1992 1991 1990 Year P ercen t o f b ir th s t o s in g le wo m en
father of the newborn. Nonetheless, marriage cannot be ignored, even if only for the simple fact that we do not have accurate data on the age of entry into sexual union and it still forms the framework within which majority of births take place.
As expected, veteran and new immigrants from Ethiopia and immigrants from the FSU have an increasing median age of first marriage, as shown in Figure 9. Although the median age of marriage of Israeli Jewish women has also been increasing, the proportional increase of all the immigrants is greater. Additionally, the median age of marriage of veteran Ethiopian immigrants has overtaken that of veteran Israelis, indicating that veteran Ethiopian women are delaying marriage to the same extent that they are delaying childbearing. The increase in median age of first marriage is particularly impressive for new Ethiopian immigrants, which increased by 6 years between 1990 and 2000.
Figure 9: Median age at first marriage, immigrants by country of birth, 1990-2000
Abortion behaviour is also showing signs of change, although the years available are more limited than with births (1994-2001). While abortion rates (abortions per thousand women of childbearing age) are interesting in their own right, the abortion ratio (percent
17 18 19 20 21 22 23 24 25
1990 1991 1992 1993 1994 1995 1996 1997 1998 1999 2000
Year
Me
d
ian
age
of
f
ir
st
m
a
rr
iage
of known pregnancies aborted) is more appropriate in this case, as it provides more information on the role of abortion as a proximate determinant. Amongst Israeli Jewish women, the percent of pregnancies aborted is declining slowly, from 11.3% in 1994 to 10.1% in 2001. The trend amongst all immigrant women is the opposite, with new Ethiopian immigrants clearly showing the greatest increase in the percentage of pregnancies aborted (from 10.5% in 1994 it nearly tripled to 29.2% in 2001).
Figure 10: Abortion ratios, immigrants by country of birth, 1994-2001
In addition to the total abortion ratio, the age distribution of the abortion ratio also differs. Israeli Jewish women display a U-shaped curve, with the highest percentages of pregnancies aborted at the extremities of the fertility range, whereas immigrant women do not show this pattern. Ethiopian women have an l-shaped function. The percentage of pregnancies aborted amongst young women are extremely high and, especially amongst new immigrants, showing no signs of decreasing. The ratios are particularly high amongst veteran immigrants – in 1997 the percentage of pregnancies aborted amongst women under 19 was over 90% (compared with around 30-40% for all Israeli Jewish women). FSU immigrants also have a unique age function. In this case it
0 5 10 15 20 25 30 35
1994 1995 1996 1997 1998 1999 2000 2001
Year
P
ercen
ta
g
e o
f k
n
o
w
n
p
reg
n
a
n
ci
es
a
b
o
rt
ed
resembles a J-shaped function. There is a slight peak amongst younger women, but the percentages increase rapidly amongst older women. The function is slowly becoming similar to the Israeli Jewish function. However, this is through an increase in the percentage of pregnancies aborted amongst younger women rather than a decrease amongst older women, which fluctuates but shows no clear signs of change.
Figure 11: Abortion ratios by age, immigrants by country of birth, 2001
Another interesting feature of abortion applications is the marital status of the applicant. Throughout the 1990s, Ethiopian immigrants were much more likely to be never-married women than either Israeli Jewish women or FSU immigrants, with new Ethiopian immigrants having the highest percentage (72.% of all applicants were never married in 2001). On the other hand, FSU immigrants were less likely than Israeli Jewish to be never-married. This perhaps indicates the use of abortion by Ethiopian immigrants to delay the commencement of childbearing and by FSU immigrants to cease childbearing. By 2001, all groups (including Israeli Jewish women) had seen an increase in the percentage of never-married women amongst applicants.
0 10 20 30 40 50 60 70 80 90 100
15-19 20-24 25-29 30-34 35-39 40-44 45+
Age group
P
ercen
ta
g
e o
f p
reg
n
a
n
ci
es
a
b
o
rt
ed
Figure 12: Percentage of never-married women amongst abortion applicants, immigrants by country of birth, 1991-2001
Data on contraceptive use are particularly hard to come by. No nation-wide fertility surveys were conducted during the 1990s with the most recent nation-wide survey being conducted in 1987/1988. Unfortunately the data available do not include information on contraceptive use. However, we do have information on contraceptive use for women applying to pregnancy termination committees. Obviously women applying for pregnancy terminations are not representative of the whole population, and a higher representation of less reliable types of contraception is expected. Additionally, there are problems with the quality of responses to the questions on contraceptive use but, since information on contraceptive use is so sparse, it does at least allow us to compare respondents by their country of birth. Chi-square tests on use of contraceptives (whether contraceptives were used since the last period and which type of contraceptives) show no significant differences according to country of birth. In other words, there was no difference according to immigration group on the overall use of all kinds of contraceptives (both modern and traditional). Nonetheless, there are significant differences in the method mix amongst those reporting contraceptive use in 2001. Ethiopian applicants have high rates of Pill use (over 50%) and FSU applicants low 0 10 20 30 40 50 60 70 80 2001 2000 1999 1998 1997 1996 1995 1994 1993 1992 1991 Year P ercen ta g e o f a p p li ca n ts
usage rates (28.8%) compared with the Israel Jewish average (35.1%). Condom use for both FSU and Ethiopian applicants was lower than the Israel Jewish average (39.6%, 40.3% and 44.5% respectively). The I.U.D. was more popular amongst FSU immigrants (23.7%) than for Jewish women (10.8%) and its use was very low amongst Ethiopian women (less than 1%). Given that I.U.D. use is not user dependent, its failure rate tends to be low. Thus the fact that nearly a quarter of FSU applicants for an abortion reported I.U.D. use seems particularly high.
8. Discussion and conclusions
Israel has an unusual fertility regime. On the one hand, it is a developed country with high levels of education and female labour force participation amongst secular Jewish women, but on the other hand fertility remains higher than countries of comparable status. The situation in Israel is unique since there are sub-populations with persistent high fertility cultures and there is also an emphasis on the demographic outcomes, in political and ethnic terms, of differences in fertility (Yishai, 1978). Additionally, Israel is a reproductively paternalistic country with those in the establishment determining, to a large extent, what is correct reproductive behaviour for women (Amir & Benjamin, 1997). Within this framework, it is expected that Russian women cease using abortions as a means of birth control, now that they have the option of effective contraceptives and that Ethiopian women limit their family size to that prevalent in the absorbing society. Basker (1980) shows that the expected norm in Israel was (and is still maybe today) to have as many children as one could afford to have. In that context, Ethiopian women would be expected to reduce their fertility to a level that they could support in a modern economy.
As hypothesized, FSU immigrants are indeed increasing their fertility, although the increase is small and less than I would have predicted. However, there is no doubt that the age-fertility function has become much more similar to that of Israeli Jews. The decrease in the 15-19 age group is clearly seen. The changes in the age distribution of the births probably account for the lack of a clear trend in the TFR. I expect that in the future, as young women who delayed childbearing enter the peak childbearing ages, there will be an increase in overall fertility.
depressed due to the prevailing conditions in the FSU. For example, the shortage of housing in the FSU may have had a limiting effect on fertility rates, particularly in the big cities. However, many immigrants experienced a decrease in their relative standard of living and their status, which would probably lead to a desire to control fertility. It is unlikely that the child allowances (see appendix) in Israel had much effect on the fertility of FSU immigrants. The child allowances are graduated by parity of the child, with the percentage of the average net household income rising from less than 2% for the first child to 15% and above for the fourth and higher parity children. Since so few FSU families have four or more children, this is unlikely to provide an incentive. In 2001, only about 5% of FSU immigrants had 4 or more children, compared with 22.5% for Israeli Jewish mothers. Admittedly, there is an increase in higher parity births with time amongst FSU immigrants, but the increase is small. If anything, the child allowances would act as a support to the high fertility of the Ethiopian immigrants, both due to the larger families and also their relatively low income levels, which has not been the case.
The Israeli cultural milieu can contribute much to our understanding of the fertility changes of FSU immigrants. Higher fertility is both accepted and encouraged in Israel. Even amongst secular Jews, fertility rates are still above replacement level, with few one child families. Much of the conflict in Israel is represented in demographic terms, with an emphasis on the need to increase the fertility of Jews in order to preserve the numerical majority. Additionally, Israel may be perceived as a more dangerous country, due to army service for young people and the threat of terrorist attacks. Thus parents may feel the need for an additional child to ‘insure’ that their desired number reach mature adulthood.
contraceptive use has appeared to decrease (Remmenick 1995). This would also account for the extremely low known pregnancy rate (abortions and live births) amongst Russian immigrants, rather than illegal abortion being the main cause of the low rate.
The changes amongst Ethiopian immigrants are surprising, although the fact that the data are of poorer quality and the population smaller than immigrants from the FSU needs to be taken into account. A decrease in fertility is indeed being witnessed. This decrease is mainly accounted for by decreases in fertility at older ages, particularly 40 and over. The proportional decrease in births amongst younger women is much less. As with FSU immigrants, the same issue of culture versus socio-economic conditions arises. However, in this case, the same environment is being used to explain a decrease in fertility. Ethiopian immigrants arrived from a rural, less developed country, where traditionally children have an important economic role to play. Obviously, within a developed urban economy, children are a net economic burden upon the parents until early adulthood and there is an emphasis on the future returns to investment in the education of children. Thus the economic incentive to reduce fertility exists. Additionally, infant and child mortality rates are low in Israel especially in comparison with Ethiopia (7 and 179 deaths of children under 5 per thousand live births in Israel and Ethiopia, respectively (World Bank, 2003)). Thus couples need to give birth to less children as ‘insurance’ for death in early childhood. However, in addition to factors encouraging fertility decline, there are also incentives to preserve the high fertility rates. In the case of Ethiopian immigrants, where large families are common (in 2001, 45% of births to Ethiopian immigrants were parity 4 or greater), child allowances may provide a greater support to high fertility, than they do an incentive to FSU immigrants. Additionally, assuming that the prevailing cultural values in Israel are pro-natalistic, then we would expect further supports to the high fertility of Ethiopian immigrants. In fact, the opposite is true, with Ethiopian immigrants undergoing a rapid fertility decline. It is possible that, in the absence of the supports to high fertility, the fertility decline would be even faster.
regarding sexual issues that seems to be exacerbated amongst young Ethiopian women. It must be remembered, however, that Ethiopian women arrived from a country with extremely low contraceptive prevalence, and even lower modern contraceptive usage (UNFPA, 2001). Henshaw et al (1999) point out that it is common during periods of rapid fertility decline for populations to increase their use of abortion and contraceptives to meet the desire for smaller families and to time births more exactly. Thus, for a substantial period of time, as fertility is declining, both the abortion rate and contraceptive prevalence may increase. This would indeed seem to be the case with immigrants from Ethiopia. Fertility is rapidly declining and this can be accounted for by both increasing abortion rates, but accompanied also by increasing use of contraceptives. Ethiopian immigrants are turning to abortion to regulate fertility, most likely in conjunction with contraceptive use. The declining fertility indicates an adaptation to the prevailing fertility regime in Israel with the Ethiopian immigrant population undergoing a transition from natural to controlled fertility. Many populations are thought to pass through a period of increased recourse to abortion during their demographic transition (Kulczychi, 1999:7). This same trend was also witnessed in the decline to below-replacement fertility in Addis Ababa, in conditions where abortion is less accessible and more risky than in Israel (Ashagrea,2002) and in the transition of immigrants from Asia and Africa in the 1950s and 1960s (Friedlander et al, 1997) . It is most likely that with increased contraceptive use, the abortion rate will eventually decline as witnessed in other populations that underwent a rapid fertility decline such as in South Korea. Taking the fertility and abortion rates of young Ethiopian women together, the known pregnancy rate is elevated, indicating a high level of sexual ignorance amongst young women.
expected. That being said, the age specific analysis shows that the majority of this decrease is accounted for by decreasing fertility amongst older age groups with the fertility of younger age groups high.
Notes
1. The majority of Jews in Ethiopia lived in the Gonder and Tigray regions of Northwest Ethiopia (Hobart, 1995).
2. The population group Jews and Others includes Jews, non-Arab Christians and those not classified by religion and the population group Arabs includes Moslems, Arab Christians, Druze and Lebanese citizens who arrived in Israel in May 2000.
3. Both Basker (1980) and Portuguese (1998:125) have noted the difficulty in obtaining official statistics on the contraceptive use in Israel.
References
Abbasi-Shavazi, M.J. & MacDonald, P. (2000) “Fertility and Multiculturalism: Immigrants Fertility in Australia, 1977-1991” International Migration Review 2000 34(1):215-242
Agadjanian, V. & Qian, Z.C. (1997) “Ethnocultural Identity and Induced Abortion in Kazakhstan” Studies in Family Planning 28(4):317-328
Amir, D. & Benjamin, O. (1997) “Defining Encounters: Who are the Women Entitled to Join the Israeli Collective?” Women’s Studies International Forum 20 (5/6):639-650
Amir, D.; Remmenick, L. & Elimelech, Y. (1997) “Educating Lena: Women Immigrants and ‘Integration’ Policies in Israel – The Politics of Reproduction and Family Planning” in Lewin-Epstein, N.; Yaacov, R. & Ritterband, P. (eds) “Russian Jews on Three Continents” (Frank Cass, London) :495-509
Ashagrea, Y. K. (2002) “The Quite Revolution: An Analysis of the Change Towards Below-Replacement Fertility in Addis Ababa” PhD Thesis, Australia National University http://thesis.anu.edu.au/uploads/approved/adt-ANU20011218.163822 /public/02whole.pdf (accessed 12/3/02)
Basker, E. (1980) “Belief Systems, Cultural Milieu and Reproductive Behvaiour: Women Seeking Abortions in a Hospital in Israel” PhD Theis, Hebrew University of Jerusalem, Jerusalem, Israel
Basker, E. (1986) “The ‘Natural’ Control of Fertility” Sociology of Health and Illness 8(1):3-25
Bystydzienski, J. M. (1989) “Women and Socialism: A Comparative Study of Women in Poland and the USSR” Signs 14(3) :668-684
Central Bureau of Statistics [Israel], 2001 “Statistical Abstract of Israel, 2000” Jerusalem, Israel
Demographic and Health Surveys (2002) “Survey Indicators STAT compiler - Ethiopia 2000”. www.measuredhs.com/data/indicators (accessed 1/7/2002)
Dinkel, R.H. & Lebok, U.H. (1997) “The Fertility of Migrants Before and After Crossing the Border” International Migration 35(2) 1997:253-270
Friedlander, D. & Feldmann, C. (1993) “The Modern Shift to Below-Replacement Fertility: Has Israel’s Population Joined the Process?” Population Studies 47:295-306
Friedlander, D. & Goldscheider, C. (1978) “Immigration, Social Change and Cohort Fertility in Israel” Population Studies, 32, 2 :299-317
Friedlander, D.; Eisenbach, Z. & Goldscheider, C. (1980) “Family-Size Limitation and Birth Spacing: The Fertility Transition of African and Asian Immigrants in Israel” Population and Development Review 6(4):581-593
Goldenberg, V. & Saxe, L. (1996) “Social Attitudes of Russian Immigrants to the United States” Journal of Social Psychology 136 (4):451-434
Henshaw, S. K.; Singh, S. & Hass, T. (1999) “Recent Trends in Abortion Rates Worldwide” International Family Planning Perspectives 25(1):44-48
Hobart, G. T. (1995) “The Evolution of Ethiopian Jews: A History of the Beta Israel (Falasha) to 1920”. www.sistahspace.com/jewish/evolu.html(accessed 10/8/02)
Imbrogno, S. & Imbogno, N. L. (1989) “Soviet Women and the Autonomous Family” International Journal of Sociology of the Family (19):1-20
Jones, H. (1990) “Population Geography” (Chapman Publishing, London) 2nd ed.
Kebede, T. (2001) “Teens pay the deadly price of religious taboo” in Panos Institute, London, Features, July 2001. www.panos.org.uk/news/July2001/Ethiopiayouth. htm (accessed 8/7/02)
Kingkade, W. (1997) “International Brief. Population Trends: Russia” United States Bureau of the Census. http://www.census.gov/ipc/prod/ib96-2.pdf (accessed 2/2/2003)
Kohler, H. & Kohler, I. (2002) “Fertility Decline in Russia in the Early and Mid 1990s: The Role of Economic Uncertainty and Labour Market Crises” European Journal of Population 18:223-262
Kostantinov, V. (1991) “Jewish Population on the Eve of the Great Exodus” in Jews and Jewish Topics in the Soviet Union and Eastern Europe 3 (16) (The Hebrew University of Jerusalem, Centre for Research and Documentation of East European Jewry)
Mammo, A. & Morgan, S. P. (1986) “Childlessness in Rural Ethiopia” Population and Development Review 12(3):533-546
Micevska, M. B. (2002) “Marriage, Uncertainty and Risk Aversion in Russia” Presented at VII Spring Meeting of Young Economists 2002. http://smye2002.univ-paris1.fr/program/paper/c6_mic.pdf (accessed 2/2/2003)
National Insurance Institute (2003) “Child Insurance”. www.btl.gov.il (accessed 2/2/2003)
Okun, B. (1997a) “Family Planning in the Jewish Population of Israel: Correlates of Withdrawal Use” Studies in Family Planning 28(3) :215-227
Okun, B. (1997b) “Innovation and Adaptation in Fertility Transition: Jewish Immigrants to Israel from Muslim North Africa and the Middle East” Population Studies 51(1997) :317-335
Paltiel, A. M.; Sabatello, E. F. & Tal, D. (1997) “Immigrants from the Former USSR in Israel in the 1990s: Demographic Characteristics and Socio-Economic Absorption” Lewin-Epstein, N.; Yaacov, R. & Ritterband, P. (eds) Russian Jews on Three Continents (Frank Cass, London):284-321
Popov, A. (1991) “Family Planning and Induced Abortion in the USSR: Basic Health and Demographic Characteristics” Studies in Family Planning 22 :368-377
Popov, A. (1996) “Family Planning and Induced Abortion in Post-Soviet Russia of the Early 1990s: Unmet Needs in Information Supply” in DaVanzo J. (ed) “Russia’s Demographic ’Crisis’”. www.rand.org/publications/CF/CF124/CF124.chap3 (accessed 1/7/02)
Population Reference Bureau (2001) “World Population Datasheet“. www.prb.org /Content/NavigationMenu/other_reports/2000-2002/2001_World_Population_D atasheet (accessed 1/7/02)
Remmenick, L. (1993) “Patterns of Birth Control” in Kon, I. & Riordan, J. (eds) “Sex and Russian Society” (Indiana University Press, Bloomington)
Remmenick, L.; Amir, D.; Elimelech, Y. & Novikov, Y. (1995) “Family planning practices & attitudes among former Soviet new immigrant women in Israel” Social Science & Medicine 41(4):569-577
Sabatello, E. F (1992) “Immigration from the Former Soviet Union – How Many Additional Abortions in the 1990s?” in Health and Women in Israel: 87-95 (Women’s Lobby in Israel, Jerusalem), in Hebrew
Sabatello, E. F.(1995) “Continuity & Change in Reproductive & Abortion Patterns of Soviet Immigrants in Israel” Social Science & Medicine 40(1):117-124
Scherbov, S. & van Vianen, H. (2002) “Period Fertility in Russia since 1930: an Application of the Coale-Trussel Fertility Model” Demographic Research 6(16). www.demographic-research.org (accessed 10/6/02)
Schoenmaeckers, R.C.; Loedwijckx, E. & Gadeyne, S. (1999) “Marriages and Fertility among Turkish & Moroccan Women in Belgium: Results from Census Data” International Migration Review 33, 4(128) : 901-928
Tolts, M. (1997) “The Interrelationship between Emigration and the Socio-Demographic Profile of Russian Jewry” in Lewin-Epstein, Noah; Yaacov, Ro’I & Ritterband, Paul (eds) “Russian Jews on Three Continents” (Frank Cass, London) :147-176
UN (1999) “Abortion Policy: A Global Review”. www.un.org/esa/population/publicati ons/abortion (accessed 1/7/02)
Weinstein, B. (1985) “Ethiopian Jews in Israel: socialization and re-education” Journal of Negro Education 54(2):213-224
World Bank (2003) “World Development Indicators – Data Query”. http://www. worldbank.org/data/dataquery.html (accessed 1/4/2003)
Yisia, Y. (1978) “Abortion in Israel: Social Demand and Political Responses” Policy Studies Journal 7(2) :270-290
Zakharov, S. V. & Ivanova, E. I. (1996) “Fertility Decline and Recent Changes in Russia: On the Threshold of the Second Demographic Transition” in DaVazo J. (ed) “Russia’s Demographic ‘Crisis’”. www.rand.org/publications/CF/CF124 /CF124.chap2 (accessed 1/7/02)
Appendix: National insurance child allowances
The table below shows the national insurance payments according to number of children in Israel. It should be noted that these payments have undergone a number of changes during the 1990s, although they have been fairly stable since 1992 until recently. Between 1989 and 1992 child allowances for the first two children were cancelled unless a family had at least three children. The allowances were reinstated in 1992, regardless of size. However, the graduated increase in the allowance for each child with increasing number of children remained. Only recently, with the economic downturn, have child allowances been cut, particularly those for larger families. Considering that the average monthly household income (from all sources) was nearly $2000 in 2000, the child allowance represents a large percentage of household income, particularly for families in the lower income deciles (Central Bureau of Statistics, 2001). For example, the child allowances represented more than 100% of the average household income of a 6 child or more family in the bottom 3 income deciles.
Table A1: National Insurance Child Allowances, by Number of Children, 2000
Number of children Child Allowance (US$) per month
Percent of average monthly net household income
1 36.5 1.8
2 73.0 3.6
3 145.3 7.3
4 292.0 14.8
5 473.1 23.9
6 654.2 33.1
Each additional child 181.1 9.2


![Table 4: TFR by year of immigration, immigrants from FSU,1990-2000]](https://thumb-us.123doks.com/thumbv2/123dok_us/8942511.1851879/16.612.72.431.224.336/table-tfr-year-immigration-immigrants-fsu.webp)