University of New Orleans University of New Orleans
ScholarWorks@UNO
ScholarWorks@UNO
University of New Orleans Theses and
Dissertations Dissertations and Theses
5-22-2006
Performance and Total PM Emission Factor Evaluation of
Performance and Total PM Emission Factor Evaluation of
Expendable Abrasives
Expendable Abrasives
Kalpalatha Kambham
University of New Orleans
Follow this and additional works at: https://scholarworks.uno.edu/td
Recommended Citation Recommended Citation
Kambham, Kalpalatha, "Performance and Total PM Emission Factor Evaluation of Expendable Abrasives" (2006). University of New Orleans Theses and Dissertations. 385.
https://scholarworks.uno.edu/td/385
This Dissertation is protected by copyright and/or related rights. It has been brought to you by ScholarWorks@UNO with permission from the rights-holder(s). You are free to use this Dissertation in any way that is permitted by the copyright and related rights legislation that applies to your use. For other uses you need to obtain permission from the rights-holder(s) directly, unless additional rights are indicated by a Creative Commons license in the record and/ or on the work itself.
PERFORMANCE AND TOTAL PM EMISSION FACTOR EVALUATION OF EXPENDABLE ABRASIVES
A Dissertation
Submitted to the Graduate Faculty of the University of New Orleans in partial fulfillment of the requirements for the degree of
Doctor of Philosophy in
Engineering and Applied Science
by
Kalpalatha Kambham
B.S., S.V.University College of Engineering, 1999 M.S., University of New Orleans, 2002
ACKNOWLEDGEMENTS
I would like to express my sincere gratitude to my advisor, Dr. Bhaskar Kura from the
Department of Civil and Environmental Engineering, whose advice, support, and encouragement have provided me with an invaluable source of motivation over the last five years.
I am grateful to Dr. Donald E. Barbé, Dr. Gianna M. Cothren, Dr. William H. Busch, and Dr. Matthew Tarr for serving on my Ph.D. Examining Committee and providing me with further assistance. I am also grateful to Dr. Tumulesh Solanky from the Department of Mathematics for his advice on statistical analysis.
I would like to thank my friends Sivaramakrishnan Sangameswaran, Xavier Silvadasan and Babruvahan Hottangada, without whose help my research work would not have been successful.
I would especially like to thank my parents, whose love and great support was indispensable, and who have provided me with lifetime motivation and inspiration. I would also like to thank my sister and brother for their boundless love and encouragement. I would like to dedicate this work to my family.
TABLE OF CONTENTS
List of Tables ... v
List of Figures ... vi
Abstract... vii
1. Introduction... 1
2. Scope and Objectives... 3
3. Literature Review... 5
3.1. Dry Abrasive Blasting... 5
3.2. Pollutant Outputs and Their Effects on Health and Environment ... 5
3.2.1. Air Emissions... 5
3.2.2. Solid/ Hazardous Waste... 6
3.3. Important Parameters in Dry Abrasive Blasting... 7
3.3.1. Abrasive Material... 7
3.3.2. Process Parameters and Equipment ... 9
3.3.3. Initial Surface Contamination... 12
3.3.4. Desired Surface Finish... 13
3.3.5. Waste Generation Potential... 14
3.3.6. Reusability ... 14
3.4. Regulations ... 15
3.4.1. Federal Regulations ... 15
3.4.2. State Regulations and Guidelines ... 19
3.5. Available Data for Emission Factors ... 21
3.5.1. U.S. EPA Emission Factors ... 22
3.5.2. Emission Factors from State/ Environmental Agencies ... 25
3.6. Available Data for Productivity and Consumption... 26
3.7. Previous Studies at UNO ... 28
4. Methodology... 29
4.1. Abrasive Materials ... 29
4.1.1. Coal Slag... 29
4.1.2. Copper Slag... 30
4.1.3. Specialty Sand... 30
4.2. Equipment ... 31
4.2.1. Test Chamber ... 32
4.2.2. Blasting Equipment... 32
4.2.3. Test Plates ... 34
4.2.4. Air Compressor... 35
4.2.5. Exhaust Duct System ... 35
4.2.6. Stack Sampling System... 36
4.2.7. Particulate Collection System ... 37
4.3. Experimental Parameters ... 38
4.3.1. Variable Parameters ... 38
4.3.2. Constant Parameters... 38
4.4. Experimental Procedure... 39
4.4.1. Abrasive Blasting... 39
4.5. Statistical Analysis... 42
5. Results and Discussion ... 45
5.1. Emission Factors... 52
5.1.1. Emission Factors in kg/m2... 52
5.1.2. Emission Factors in kg/kg... 59
5.2. Productivity... 67
5.1.1. Variation of Productivity with Pressure... 67
5.1.2. Variation of Productivity with Feed Rate ... 69
5.1.3. Variation of Productivity with Pressure and Feed Rate... 71
5.3. Consumption... 74
5.3.1. Variation of Consumption with Pressure... 74
5.3.2. Variation of Consumption with Feed Rate ... 76
5.3.3. Variation of Consumption with Pressure and Feed Rate ... 78
6. Conclusions and Recommendations ... 81
References... 84
APPENDIX A: Field Observations and Stack Calculations... 89
APPENDIX B: Results of Statistical Analysis ... 93
APPENDIX C: Material Data Safety Sheets ... 103
APPENDIX D: Example for Calculation of Blasting Costs... 118
List of Tables
Table 1: NAAQS for PM10 and PM2.5... 16
Table 2: Summary of Test Data for Abrasive Blasting Operations ... 23
Table 3: Particulate Emissions Factors for Abrasive Blasting... 25
Table 4: Available Emission Factors for PM... 26
Table 5: Experimental Results for Coal Slag... 46
Table 6: Mean and Standard Deviation (SD) of Experimental Results for Coal Slag... 47
Table 7: Experimental Results for Copper Slag ... 48
Table 8: Mean and Standard Deviation (SD) of Experimental Results for Copper Slag ... 49
Table 9: Experimental Results for Specialty Sand ... 50
Table 10: Mean and Standard Deviation (SD) of Experimental Results for Specialty Sand ... 51
Table 11: Coefficients for Emission Factors in (kg/m2) for Equation 2... 59
Table 12: Coefficients for Emission Factors in (kg/kg) for Equation 3 ... 65
Table 13: Coefficients for Productivity (m2/hr) for Equation 4... 73
List of Figures
Figure 1: Emissions Test Facility ... 31
Figure 2: Blast Pot ... 33
Figure 3: Exhaust Duct System... 36
Figure 4: Two-Stage Particle Collection System... 38
Figure 5: Variation of Emission Factors (kg/m2) with Pressure at 3 Turns... 52
Figure 6: Variation of Emission Factors (kg/m2) with Pressure at 4 Turns... 53
Figure 7: Variation of Emission Factors (kg/m2) with Pressure at 5 Turns... 54
Figure 8: Variation of Emission Factors (kg/m2) with Feed Rate at 80 PSI... 55
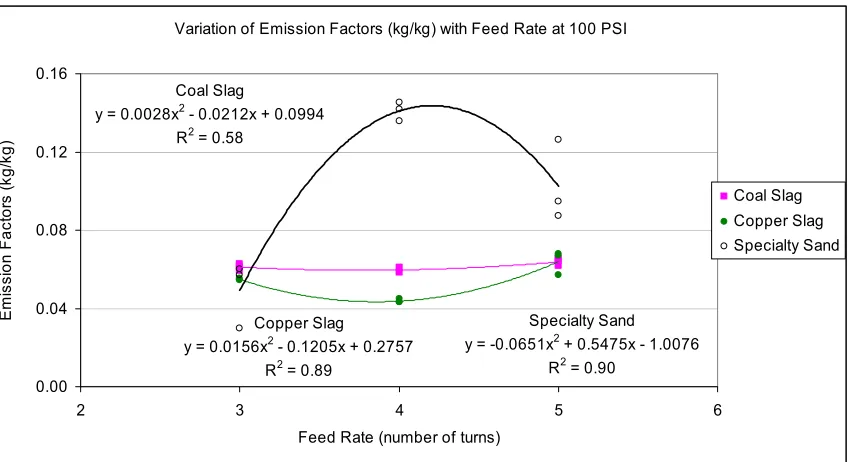
Figure 9: Variation of Emission Factors (kg/m2) with Feed Rate at 100 PSI... 56
Figure 10: Variation of Emission Factors (kg/m2) with Feed Rate at 120 PSI... 56
Figure 11: Coal Slag-Variation of Emission Factors (kg/m2) with Pressure and Feed Rate ... 57
Figure 12: Copper Slag-Variation of Emission Factors (kg/m2) with Pressure and Feed Rate.... 58
Figure 13: Specialty Sand-Variation of Emission Factors (kg/m2) with Pressure and Feed Rate 58 Figure 14: Variation of Emission Factors (kg/kg) with Pressure at 3 turns... 60
Figure 15: Variation of Emission Factors (kg/kg) with Pressure at 4 turns... 61
Figure 16: Variation of Emission Factors (kg/kg) with Pressure at 5 turns... 61
Figure 17: Variation of Emission Factors (kg/kg) with Feed Rate at 80 PSI ... 62
Figure 18: Variation of Emission Factors (kg/kg) with Feed Rate at 100 PSI ... 63
Figure 19: Variation of Emission Factors (kg/kg) with Feed Rate at 120 PSI ... 64
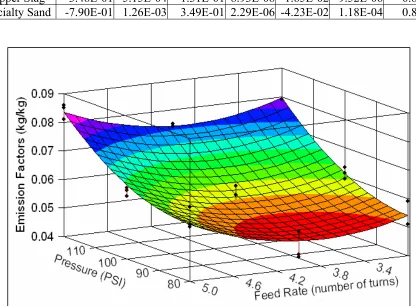
Figure 20: Coal Slag-Variation of Emission Factors (kg/kg) with Pressure and Feed Rate... 65
Figure 21: Copper Slag-Variation of Emission Factors (kg/kg) with Pressure and Feed Rate .... 66
Figure 22: Specialty Sand-Variation of Emission Factors (kg/kg) with Pressure and Feed Rate 66 Figure 23: Variation of Productivity with Pressure at 3 Turns... 68
Figure 24: Variation of Productivity with Pressure at 4 Turns... 68
Figure 25: Variation of Productivity with Pressure at 5 Turns... 69
Figure 26: Variation of Productivity with Feed Rate at 80 PSI... 70
Figure 27: Variation of Productivity with Feed Rate at 100 PSI... 70
Figure 28: Variation of Productivity with Feed Rate at 120 PSI... 71
Figure 29: Coal Slag-Variation of Productivity with Pressure and Feed Rate ... 72
Figure 30: Copper Slag-Variation of Productivity with Pressure and Feed Rate ... 72
Figure 31: Specialty Sand-Variation of Productivity with Pressure and Feed Rate ... 73
Figure 32: Variation of Consumption with Pressure at 3 Turns ... 74
Figure 33: Variation of Consumption with Pressure at 4 Turns ... 75
Figure 34: Variation of Consumption with Pressure at 5 Turns ... 76
Figure 35: Variation of Consumption with Feed Rate at 80 PSI ... 77
Figure 36: Variation of Consumption with Feed Rate at 100 PSI ... 77
Figure 37: Variation of Consumption with Feed Rate at 120 PSI ... 78
Figure 38: Coal Slag - Variation of Consumption with Pressure and Feed Rate ... 79
Figure 39: Copper Slag - Variation of Consumption with Pressure and Feed Rate ... 79
Abstract
Dry abrasive blasting is one of the most widely used methods of surface preparation. Air
emissions from this process include particulate matter (PM) and metals. Spent abrasive generated from this process may be hazardous in nature. With increasing concern on health effects due to silica emissions from sand, use of alternative materials is suggested by health and regulatory agencies.
The objective of this research was to evaluate performance of expendable abrasives and determine PM emission factors. Dry abrasive blasting was performed in an enclosed chamber and total PM samples were collected. Three commonly used expendable abrasives, coal slag, copper slag and specialty sand, were used to evaluate cleaner alternatives. Blast pressure and abrasive feed rate, two important process conditions were varied to study their effect on performance of an abrasive. Productivity, consumption and emission factors (performance parameters) were calculated and their variation with pressure and feed rate was evaluated. Two dimensional and three dimensional predicted models were developed to estimate the
performance at intermediate blast pressure and feed rate conditions. Performance of the three abrasives was compared with respect to emission potential, productivity and consumption.
The productivity and consumption models will help is estimating life cycle costs including material cost, equipment cost, energy cost, labor costs, waste disposal cost, and compliance costs. Consumption models will also help in determining the quantity of spent abrasive
1. Introduction
Dry abrasive blasting is one of the widely used methods of surface preparation for steel or metal surfaces. This process is used to create a rough profile and to remove contaminants such as rust or old coating before applying a new coating to ensure proper bonding between the surface and coating. Several industries such as aerospace, automobile, bridge construction, metal finishing, shipbuilding and ship repair use dry abrasive blasting for preparation and maintenance of steel or other metal surfaces (U.S. ACE 1995, U.S. EPA 1997a). In this process, abrasive materials are propelled at high velocities with the aid of compressed air. The energy transfer between the abrasive grains and base plate results in removal of contaminants and creation of rough profile (U.S. ACE 1995).
Some of the commonly used abrasives are coal slag, copper slag, garnet, silica sand, specular hematite (barshot), steel grit, steel shot, aluminum oxide, silicon carbide etc. (U.S. EPA, 1997a). Dry abrasive blasting process results in air emissions (particulate matter and metals) and spent blast media which may be harmful to human health and environment (U.S. EPA 1997b). Silica sand has been widely used as an abrasive material due to its low cost and abundant
occurrence in nature. However, silica dust emissions from abrasive blasting with silica sand have been of great concern due to adverse health effects on workers upon exposure to these emissions. Thus, use of alternative materials to silica sand is suggested by several health organizations and environmental agencies (NIOSH 1998, Abrasive Blasting, 1995) to protect worker health as well as the environment.
purchasing (EPP), which means considering the environmental impacts (air and water pollution, toxic wastes), energy-efficient technologies and material performance prior to purchasing materials. This will result in resource conservation, waste minimization, minimization of energy consumption, and extension of landfill capacity. In addition, costs incurred due to material purchase, energy consumption, waste management and disposal can be reduced by EPP (U.S. EPA 1994, U.S. EPA 2001).
In order to address and achieve the above mentioned objectives, namely, protect worker health, environment and make EPP, it is important to evaluate waste generation potential (air emissions and spent abrasive) and performance of alternate abrasive materials as well as understand the effect of various parameters that affect performance and waste generation potential. Performance of abrasive in dry abrasive blasting depends on properties of abrasive material (size, shape, hardness, and chemical composition), blast pressure, abrasive feed rate, nozzle size, base plate (substrate), surface contamination, quality of desired finish and others (U.S. ACE 1995). While some abrasives can be reused in abrasive blasting, others can not be reused due to their properties such as hardness and dust generation rate. These materials are called expendable or non-reusable abrasives. The goal of this research was to evaluate
2. Scope and Objectives
Existing literature provides limited data on performance, process conditions and test procedures adopted for evaluating the performance of alternative materials for dry abrasive blasting. This research was focused on evaluating performance of three of the most commonly used expendable (single use) abrasive materials, namely coal slag, copper slag and specialty sand, on painted mild steel surfaces.
The primary objectives of this research were:
Objective 1: The first objective of this research was to determine emission factors for total particulate matter (TPM). Emission factors help in quantifying the emissions released from a process and these are important input
parameters in developing emission inventories.
Objective 2: The second objective of this research was to determine productivity. Productivity (or cleaning rate) determines how fast the surface can be cleaned (area cleaned per unit time). The higher the productivity, the faster the cleaning rate and less consumption of energy. Higher productivity also results in reduced labor and energy costs.
Objective 3: The third objective of this research was to determine consumption. Consumption is the amount of material used to clean a unit area. Lower consumption results in better conservation of resources, reduced amounts of wastes generated and
efficient use of landfills for waste disposal. In addition, lower consumption results in reduced material costs, waste management and disposal costs.
emissions and abrasive consumption, and maximize productivity. Since the performance of an abrasive depends of process conditions, it is
important to study the variation of performance with process conditions to achieve maximum efficiency through process optimization.
Objective 5: The fifth objective of this study was to develop predictive mathematical models to estimate total PM emission factors, productivity and
consumption at intermediate operating conditions for a specific abrasive material. These models will help industries and regulatory agencies in determining accurate TPM emissions and assist in life cycle cost and assessment methodologies with more accurate data on productivity and consumption.
3. Literature Review
3.1. Dry Abrasive Blasting
Surface preparation methods are used to remove impurities such as rust, corrosion, and old coatings from a substrate and create a rough profile (or anchor pattern) that will help better adhesion of new coating as well as improve the performance of new coating. Some of the most commonly used methods are dry abrasive blasting, wet abrasive blasting, hydro blasting (water blasting), chemical stripping, and vacuum blasting. Dry abrasive blasting is one of most effective and widely used methods of surface preparation. In this method, an abrasive material is mixed with compressed air and this mixture is projected onto the surface. The pressurized air
(compressed air) imparts high velocities to the abrasive particles. The mass of abrasive particles and high velocity imparted by the compressed air create kinetic energy, which is given by ½ mV2, where m is the mass and V is the velocity of the abrasive material. The energy transfer between the abrasive material and the surface is responsible for removing the contaminants and creating the required profile (U.S. ACE 1995, U.S. EPA 1997a). The equipment used in this process is discussed in the Methodology Section.
3.2. Pollutant Outputs and Their Effects on Health and Environment
3.2.1. Air Emissions
NSRP 1999, Vallyathan et al 1999, Conroy et al 1996, MacKay et al 1980). Particulate
emissions are of great concern due to the health effects, visibility impairment, ecosystem imbalance and aesthetic damage. Fine particulates can be carried over long distances and settle on ground or water. This may make lakes and streams acidic, change nutrient balance is coastal waters, and deplete nutrients in soil. Inhalation of particulate matter causes respiratory problems, asthma, chronic bronchitis, and decreased lung function (U.S. EPA, Dockery et al 1993,
Oberdorster 1995, Pope et al 1995). Recent studies (Wilson et al 1985, Daigle et al 2003, U.S.
EPA, 2004a, U.S. EPA, 2004b, Voutilainen et al 2004) on health effects of PM show that fine
(PM less than 2.5 μm in diameter) and ultrafine particles (PM less than 0.1 μm in diameter) have significantly greater effects on respiratory systems and lung functions because finer particles are absorbed into the respiratory system and lungs as compared with coarser particles. Moreover, ultrafine particles deposited in lungs release toxic compounds (associated with PM) faster than fine and coarse particles. The emissions may be toxic due to heavy metals present in airborne particulates and exposure to these emissions may cause adverse health effects (specific) (Hubbs
et al 2001, Vallyathan et al 1999, Conroy et al 1996, MacKay et al 1980, NIOSH 2001). Most
importantly, exposure to silica dust emitted from sandblasting, abrasive blasting with silica sand, causes silicosis (NIOSH 1974, Lipton and Herring 1996, Rappaport et al 2003).
3.2.2. Solid/ Hazardous Waste
While lighter particles get airborne, heavier particles fall off and this waste (spent
the waste generated may be hazardous (U.S. EPA 1997b). The spent abrasive media may be recycled or reused for blasting operations or other purposes if the material is clean enough and meets the regulatory requirements for recycling and reusing options. If the spent abrasive cannot be recycled or reused, it must be disposed of as a solid or hazardous waste in landfills depending on the toxic characteristics of the waste, which are determined by Toxicity Characteristic
Leaching Procedure (TCLP) tests (Townsend 1997, NFESC 1996, Angie and Wayne 1999).
3.3. Important Parameters in Dry Abrasive Blasting
3.3.1. Abrasive Material
Proper selection of abrasive material is essential to achieve maximum efficiency in dry abrasive blasting. Some of the important parameters are: abrasive cost, abrasive type,
characteristics of the material, surface to be cleaned, contaminants to removed, level of contamination, surface finish desired (cleanliness and profile), waste generation potential, consumption rate, reusability, and others. Significance of some of these parameters is discussed in this section.
3.3.1.1. Abrasive type
materials are enhanced by washing and grading the material. Synthetic abrasives include aluminum oxides, aluminum silicates, calcium silicate, crushed glass, glass beads, and others. The performance of these abrasives depends on the surface type and contamination to be removed (U.S. EPA 1997a, Paddison 2000, Hansink 2000)
3.3.1.2. Abrasive particle size
Particle size of abrasive material is an important factor in selection of abrasives. The size of abrasive particles varies widely between 0.06 to 2 mm. Too fine or coarse particles may not be effective in removing contamination and creating the desired profile. While larger particles cut deep into the surface and create deep surface profile, smaller particles create shallow profiles. In addition, if the particle size is too high, a smaller number of particles impact the surface which increases material consumption and decreases productivity as compared to smaller particles that result in greater number of impacts per unit surface area. Since abrasive particles breakdown into smaller particles upon striking the surface, too fine abrasive materials may release very fine PM, which is of great concern due to associated health effects. While a mixed size of particles may result in better performance, particle size is important when selecting reusable or expendable (single use) abrasives. In case of reusable abrasives, it is important to select an abrasive particle size which results in efficient size of reusable abrasive material after breaking down into smaller particles (U.S. ACE 1995, Paddison 2000, Hansink 2000).
3.3.1.3. Abrasive particle shape
as steel grit, slags, and other metallic grits are effective for creating a rough profile (U.S. ACE 1995, Hansink 2000).
3.3.1.4. Hardness
Hardness of an abrasive material indicates its resistance to abrasion by other materials. Hardness of abrasives is measured on Mohs scale of hardness. Metallic and slag abrasives have higher hardness (6 – 8 Mohs) and cut deeper and faster than soft or brittle abrasives such as organic or plastic abrasive media (2 – 4 Mohs) reducing their cleaning efficiency (U.S. ACE 1995, Paddison 2000, Hansink 2000).
3.3.1.5. Specific gravity
As mentioned earlier in Section 3.1, the kinetic energy of the abrasive particles is given by ½ mV2. Mass of abrasive material, m, is proportional to specific gravity (SG) of the abrasive particles. Abrasives with higher SG are more efficient and clean faster, which increase
productivity (Paddison 2000, Hansink 2000).
3.3.1.6. Density
Density of abrasive material is important in selecting the size of blast pot and storing the abrasive material. Since lower density abrasives occupy more volume for the same mass, bigger blast pot and greater storage area are needed as compared to abrasives with higher density, which occupy less volume and need smaller blast pots and storage areas (Hansink 2000).
3.3.2. Process Parameters and Equipment
3.3.2.1. Blast pressure
pressures, the particles may suffer more damage due to collision of these particles with
rebounding particles before striking the surface and reduce productivity, increase consumption, and results in higher emissions. In addition, blasters may not be able to handle these high
pressures and must be provided with additional protection. At very low pressures, the velocity of particles is less and the particles may not strike the surface with sufficient impact to remove contaminants and create required profile. This will result in decreased productivity and increased consumption since more material is required to clean a unit surface area. Very low pressures may also result in fewer emissions due to less breakdown rate at lower velocities (Clemco Industries 1989, Hansink 1995, Holt and Austin 2001, Paddison 2000, Seavey 1985). Thus, it is important to select an optimum pressure that results in high productivity, low consumption, and low emissions while providing a safe working environment for workers.
3.3.2.2. Abrasive feed rate
Feed rate determines the mass flow rate of abrasive. Very low feed rates may result in uneven distribution of particles and decrease productivity while consuming more material. As the feed rate is increased, more abrasive is released which increases productivity and more number of abrasive particles breakdown, causing increase in emissions. However, at very high feed rates, the same effect may not be observed because abrasive particles collide with
3.3.2.3. Nozzle size
Nozzle sizes used in abrasive blasting typically range from 1/8 inch to 1/2 inch orifice diameter. While larger nozzles may increase productivity by increasing the number of impacts per unit time by allowing more abrasive to flow through the nozzle, smaller nozzles may also increase productivity due to increase in blast pressure. However, for the same volume of air, larger nozzles require high capacity compressors to provide required blast pressure to achieve higher productivity (U.S. ACE 1995, Gorripati 2000). Thus, selecting the proper size of nozzle is important in maintaining required blast pressure and determining the capacity of air compressor.
3.3.2.4. Nozzle type
Venturi and straight-bore nozzles are two types of nozzles used in abrasive blasting process. Venturi nozzles converge to specified orifice diameter at the center of the nozzle and then diverge. This enables an increase of exit velocity of abrasive particles and thus increases the productivity. Straight-bore nozzles have uniform diameter throughout the length of the nozzle. Thus, venturi nozzles provide higher cleaning rate as compared to straight-bore nozzles. Blast nozzles are available in various lengths, diameters and lining materials. The life of a nozzle depends on the lining materials. Nozzles lined with tungsten or boron carbides have longer life than the nozzles lined with ceramic or cast iron (U.S. ACE 1995, Gorripati 2000).
3.3.2.5. Angle of deflection
45 to 60 degrees (U.S. ACE 1995). In some cases, nozzles held at an angle of greater or lesser than 90 degrees may scour the surface (Gorripati 2000).
3.3.2.6. Stand-off distance
Stand-off distance is the distance between the nozzle and the work piece or surface. This may vary from 6 to 24 inches (15 to 60 cm). The closer the distance, the smaller the blast pattern. In case of removing mill scale or heavy levels of contamination, a lesser stand-off distance creates greater impact and increases cleaning power. However, this may reduce productivity due to decreased blast pattern. For removing smaller levels of contamination, this distance may be increased to increase the blast pattern and thus achieve higher productivity. Hence, optimum stand-off distance is important since it affects the blast pattern, productivity and impact of the abrasive material (U.S. ACE 1995, Gorripati 2000).
3.3.2.7. Dwell time
Dwell time is the amount of time spent cleaning a particular area on the surface to achieve required cleanliness and profile. For removing lightly adhered contaminants or smaller levels of contamination, shorter periods will achieve the desired finish. When removing tightly adhered contaminants or greater levels of contamination, it may take longer time to clean the surface. In addition, if the nozzle is held close to the surface, lesser dwell time is required as compared to when nozzle is held far from the surface. Thus, angle of deflection and stand-off distance also affect dwell time (Gorripati 2000, Technology Publishing Company 1999). 3.3.3. Initial Surface Contamination
generated. The type of contamination being removed such as rust, mill scale or paint determines the toxic characteristics of the emissions and spent abrasive generated. In the case of removing lead-based paints, resulting wastes may be toxic due to the presence of lead.
In addition, depending on the properties of abrasive such as particle size, shape and hardness, a particular abrasive may be more effective in removing rust while another abrasive may be more effective in removing paint. Thus, it is important to determine level and
composition of the contaminants being removed to achieve maximum efficiency from an abrasive material and the dry abrasive blasting process.
3.3.4. Desired Surface Finish
Proper adhesion of new coating is important to its life and effectiveness. Thus, the surface must be free of underlying dust and contamination. In addition, surface roughness or profile is important for the new coating to adhere to the surface since it provides more surface area for adhesion. For commercial steel structures, the Society of Protective Coatings provides surface preparation standards in terms of quality of the finish. For example, SP-5 refers to a white metal blasting, which involves removal of all visible rust, mill scale, paint and
free of all visible residues (SSPC). The higher the quality of surface finish, the higher abrasive consumption will be, air emissions, quantity of spent abrasive, and the lower productivity will be since more material and time are consumed to clean a unit surface area. Thus, desired surface finish or degree of cleaning is an important factor that must be considered while selecting an abrasive material, process conditions and evaluating performance of abrasive materials.
3.3.5. Waste Generation Potential
Waste generation potential of an abrasive is important to evaluate health, safety and environmental impact of the material as well as environmental compliance and waste disposal costs in dry abrasive blasting. This depends on a number of factors including breakdown rate, dust generation rate, and chemical composition. Abrasives with smaller particle size and brittle properties generate more dust since they breakdown easily into very fine particles. In addition, composition of the abrasive material such as metals, free silica content and other toxic chemicals is important to assess the toxicity of both air emissions and spent abrasives. With increasing concern on health effects due to silica emissions, abrasives with less free silica content (<1%) must be used to protect worker health. Abrasive materials with less potential for waste
generation and decreased health risk due to exposure to toxic emissions, reduce the quantities and concentrations of hazardous waste generated. Industries can reduce the costs incurred due to environmental compliance and waste disposal (U.S. ACE 1995, NIOSH 1998, Appleman et al.
1998).
3.3.6. Reusability
too low or if the breakdown rate abrasive is too high, the spent abrasive generated may be too fine to create the desired surface finish. And abrasives with high breakdown rates generate significant amounts of dust, decrease productivity and increase abrasive consumption. Slag abrasives such as coal slag and copper slag generate high dust and breakdown easily. Thus, the materials are not reused. Harder abrasives such as steel grit and garnet may be reused for a number of times based on their particle size and breakdown rate (U.S. ACE 1995, Paddison 2000, Hansink 2000). While non-reusable abrasives are cheaper than reusable abrasives, overall costs incurred due to reuse of abrasives and cost of recycling the spent abrasive for reuse must be considered while selecting an abrasive.
3.4. Regulations
3.4.1. Federal Regulations
3.4.1.1. Clean Air Act (CAA)
The Clean Air Act and the Clean Air Act Amendments (CAAA) of 1990 are intended to protect and enhance the nation’s air resources, promote public health, and protect the
The size and composition of PM varies widely and particulates less than 10 micrometers in diameter (PM10) cause serious health effects. Larger particles cause irritation to eyes, nose,
and throat (U.S. EPA, 2003). Exposure to PM has been associated with various health effects including asthma, chronic bronchitis, premature death, decreased lung function, and severe respiratory problems (U.S. EPA 2003, Pope et al. 1995, Atkinson et al. 2001, Schwartz 2004,
Dockery et al. 1993). Thus, in order to regulate these PM concentrations, NAAQS established
new standards for PM10, PM2.5. Two types of standards, primary standards and secondary
standards are developed to protect public health, and to prevent environmental damage respectively. Current NAAQS for PM10, PM2.5, and lead are shown in Table 1.
Table 1: NAAQS for PM10 and PM2.5
Pollutant Primary Standard Secondary Standard Averaging Time PM10 50 µg/m3 Same as Primary Annual
150 µg/m3 24-hour
PM2.5 15.0 µg/m3 Same as Primary Annual
65 µg/m3 24-hour
Lead (Pb) 1.5 µg/m3 Same as Primary Quarterly
an abrasive and process conditions, PM emissions can be reduced thereby attaining the emission limits and NAAQS.
3.4.1.2. Resource Conservation and Recovery Act (RCRA)
Resource Conservation and Recovery Act regulates the waste generated from industrial processes. Based on the characteristics of the waste, it is categorized as solid waste or hazardous waste. Removal of coating may result in hazardous waste based on composition of the coating. In case of hazardous waste, waste must be properly contained and disposed of to comply with the generator, transporter, treatment, storage, and disposal (TSD) regulations. Facilities that generate at least 100 kilograms of hazardous waste per month must comply with the hazardous waste generator requirements according to 40 CFR Part 262 (PCRC, U.S. EPA, 1997b). Some of sources of hazardous waste in dry abrasive blasting are toxic metals and blast media
contaminated with paint chips. Based on the consumption of abrasive materials, industries will be able to estimate the quantities of spent abrasives and hazard wastes generated. With proper selection of materials and process conditions, waste generation and costs incurred due to waste management can be minimized.
3.4.1.3. Clean Water Act (CWA)
present in the wastewater generated from dry abrasive blasting. Facilities must periodically monitor the wastewater to demonstrate compliance with the regulations. In case of exceeding the effluent limits, facilities must treat the wastewater prior to final discharge (PCRC, Shipbuilding Sector Notebook). Material substitution and process optimization will help in minimizing both quantities and characteristics of wastewater generated and storm water contamination during abrasive blasting.
3.4.1.3. Occupational Safety and Health Administration (OSHA)
In order to protect worker health from exposure to PM, silica dust, lead and other toxic emissions, the Occupational Safety and Health Administration regulates health hazards due to abrasive blasting. Abrasives with higher free silica content generate silica dust, which is
3.4.2. State Regulations and Guidelines
Due to significant hazards from silica-based abrasives and enormous amounts of dust generated during abrasive blasting, many state agencies restrict the use of silica sand for outdoor blasting and suggest using alternative materials to reduce silica emissions and their health effects on workers and public. Regulations and guidelines by some of the state environmental agencies are discussed in this section.
3.4.2.1. Bay Area Air Quality Management District (BAAQMD)
BAAQMD protects public health environment in San Francisco Bay region. BAAQMD provides permit requirements, and performance standards for facilities that carry out abrasive blasting operations (BAAQMD 1990, BAAQMD 1998). Abrasive materials used for unconfined blasting operations must comply with particle size standards. According to these standards, before blasting “Before blasting, the abrasive shall not contain more than 1% by weight material
passing a #70 U.S. Standard sieve when tested in accordance with “Method of Test for Abrasive
Media Evaluation,” Test Method No. California 371-A. Certified abrasives re-used for dry
unconfined blasting must conform with Section 12-4-305.1”. In order to control size of PM
emissions after blasting, “the abrasive shall not contain more than 1.8% by weight material five micron or smaller when tested in accordance with “Method of Test for Abrasive Media
Evaluation”, Test Method No. California 371-A. Certified abrasives re-used for dry unconfined
blasting are exempt from Section 12-4-305.2”. All abrasive materials used for unconfined
3.4.2.2. Louisiana Department of Environmental Quality (LDEQ)
LDEQ regulates environmental quality of Louisiana State to protect the environment, public health, and safety. Steel fabrication, shipbuilding, metal cleaning and any activity that uses abrasives blasting must comply with regulations specified in LAC 33:III.1305.3 (LDEQ 1998). Some of the applicable regulations are discussed in this section. In case of outdoor blasting, shrouds must be used at all the times during blasting to confine air emissions from escaping into atmosphere. These shrouds (a) must be placed close to blast area to prevent dispersion of emissions in larger areas, (b) must have overlapping seams to prevent leakage of PM emissions, and (c) must repair tears greater than one foot in length before blasting is carried out. Industries must use abrasives that contain less than 1% (by mass) of fines that would pass through a No.80 sieve. Abrasive with less dust generation rates must be used. Materials derived from hazardous, toxic, medical or municipal wastes are prohibited from use as abrasive
materials. In case of indoor blasting, the blast cabinets must be equipped with exhaust systems and emission control equipment.
Industries must maintain a daily record of actual operating times and monthly records of abrasive material usage with percentage mass of fines as specified by the manufacturer. During blasting, precautions must be taken to prevent PM from becoming airborne. To minimize hazardous waste generation, personnel must maintain optimum blast pressure levels, minimize contamination of abrasive materials with hazardous wastes or lead paints, and remove spent abrasives prior to working with surface that contain lead-based coatings.
3.4.2.3. Texas Natural Resource Conservation Commission (TNRCC)
submit information on type abrasive blasting, abrasive materials and quantities used, size of blast cabinet (in case of enclosed blasting), control equipment data, exhaust system data and methods of disposal of wastes generated in order to obtain an operating permit (TNRCC 1993).
Facilities must estimate hourly and annual TSP and PM10 emissions using emission
factors specified by TNRCC. In addition, off-property concentrations of all chemicals must be estimated. The off-property concentrations of PM cannot exceed 400 μg/m3 for any one-hour period and cannot exceed 200 μg/m3 for any three-hour period. In addition, the facilities must comply with NAAQS for PM10, PM2.5, and lead emissions.
3.5. Available Data for Emission Factors
Emission inventories are important tools for air quality management. These are used to determine applicability of permitting programs, identify major sources of pollutants, and develop emission control technologies. Emission factors (EF) are key input parameters for developing emission inventories. Since 1972, U.S. EPA has been compiling and publishing emission factors for various pollutants from a variety of stationary point and area sources in AP-42 documents (U.S. EPA 1997c). An emission factor is defined as the quantity of pollutant released to the atmosphere from a source in relation to an activity. Generally, emission factors are expressed in terms of weight of pollutant emitted per unit weight, duration, volume or distance of the activity that emits the pollutant. Usually, emission quantities are estimated using Equation 1 given below:
⎥ ⎦ ⎤ ⎢
⎣ ⎡
⎟ ⎠ ⎞ ⎜ ⎝ ⎛ − =
100 1
*
*EF ER
A
E (1)
where: E = emissions, A = activity rate, EF = uncontrolled emission factor, and ER = overall
Emission factors can be developed using mass-balance approach, emissions monitoring, engineering calculations, or a combination of these methods. AP-42 documents provide emission factor ratings to indicate the robustness, or appropriateness of emission factors based on source operation, sampling procedures, sampling and process data, analysis and calculations. These ratings are given from A through E.
A = Excellent. B = Above average. C = Average. D = Below average. E = Poor.
Since emission factors represent average emission rate for an entire process or source category, actual emissions may vary widely from one source to another.
3.5.1. U.S. EPA Emission Factors
Section 13.2.6, Emission Factor Documentation for AP-42, provides emission factor data applicable for abrasive blasting processes (U.S. EPA 1997a). Emissions factors for TPM, PM10
PM2.5, derived from various studies conducted on sand and garnet are compiled in this document.
Table 2: Summary of Test Data for Abrasive Blasting Operations
(Table 2 continued..)
TP = total particulate matter. RP = respirable particulate matter (# 3.5 µmA) as determined using a 10-mm nylon cyclone followed by a 37-mm filter cassette.
Table 3: Particulate Emissions Factors for Abrasive Blasting
Source: U.S. EPA, AP-42
3.5.2. Emission Factors from State/ Environmental Agencies
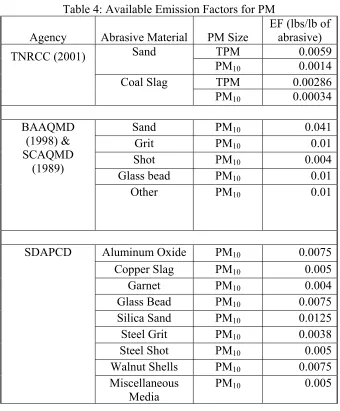
Available emission factors from environmental agencies from various states (TNRCC, BAAQMD, SCAQMD, SDAPCD) are shown in Table 4. National Shipbuilding Research
Program developed emission factors for coal slag, copper slag, garnet, hematite, and sand at blast pressures of 80 and 122 PSI for PM1, PM2.5, PM4, and PM10. The disadvantages of available
data on emission factors are some of the data are very general and do not provide process
condition information. While NSRP provided more information on process conditions, the data is not continuous. Thus emissions cannot be estimated at intermediate operating conditions.
Table 4: Available Emission Factors for PM Agency Abrasive Material PM Size
EF (lbs/lb of abrasive)
TPM 0.0059 Sand
PM10 0.0014
TPM 0.00286 TNRCC (2001)
Coal Slag
PM10 0.00034
Sand PM10 0.041
Grit PM10 0.01
Shot PM10 0.004
Glass bead PM10 0.01
BAAQMD (1998) & SCAQMD
(1989)
Other PM10 0.01
Aluminum Oxide PM10 0.0075
Copper Slag PM10 0.005
Garnet PM10 0.004
Glass Bead PM10 0.0075
Silica Sand PM10 0.0125
Steel Grit PM10 0.0038
Steel Shot PM10 0.005
Walnut Shells PM10 0.0075
SDAPCD
Miscellaneous Media
PM10 0.005
3.6. Available Data for Productivity and Consumption
levels of various pollutants. This study also provides productivity, abrasive flow rate, and cleanup costs. For example, productivity of coal slag varied from 29.5 to 42.0 square feet/hour with a 1/4 inch nozzle. With increase in nozzle size to 3/8inch, the productivity of coal slag increased to 94.8 square feet/hour. In case of silica sand, productivity varied from 26.6 to 39.0 square feet/hr with a 1/4 inch nozzle. For copper slag, the productivity varied from 32.7 to 91.6 square feet/hour. These tests were conducted at a blast pressure of 100 PSI with a feed valve of 1/2 inch, except for some tests. Since these were conducted at a single blast pressure condition, it is not feasible to determine productivity and clean up costs at other blast pressure or feed rate conditions, which may be more economic and faster.
NSRP studied emission factors of PM for abrasive materials commonly used in shipbuilding sector (NSRP 1999). This study also provides information on productivity and consumption of coal slag, copper slag, hematite, garnet, and sand. The blasting operations were performed at 80 and 100 PSI with varying feed rates from 3 to 8 turns of opening of feed valve. However, only a single test run was performed for each operating condition. Thus, these results may not provide truly representative data for productivity and consumption. In addition, this study does not help in determining productivity and consumption at intermediate blast pressures.
Productivity and consumption rates of typical abrasives are given by U.S. ACE (1995). For example, coal slag has a productivity of 0.36 m2/min and consumption rate of 15.62 kg/m2. Copper slag has a productivity of 0.40 m2/min and consumption rate of 15.13 kg/m2, while silica sand has a productivity of 0.44 m2/min and consumption rate of 12.69 kg/m2. This data is
information on process conditions and there is limited information on effect of varying pressure, feed rate on productivity and consumption.
3.7. Previous Studies at UNO
Previous research performed at the University of New Orleans focused on evaluating productivity, consumption and total PM emission factors for coal slag, garnet (Datar 2003), specialty sand and steel grit (Silvadasan 2004) for removal of flash rust. These studies did not distinguish between expendable and reusable abrasives. Since some industries may not have equipment to clean the abrasives for reuse, or it may not be a cost-effective option to reuse, it is important to study the performance of expendable abrasives for a better assessment. Other limitations of these studies were:
• Effect of pressure and feed rate for removing paints was not studied
• Physical effect of blast pressure and feed rate on performance was not explained
4. Methodology
4.1. Abrasive Materials
Shipyard survey results showed that coal slag comprise 68%, copper slag comprise 20%, steel grit/shot comprise 6%, sand comprise 4% and miscellaneous abrasives comprise 2% of the industrial consumption of abrasives (National Steel and Shipbuilding Company 1999). The objective of this research was to evaluate the performance of non-reusable, or expendable abrasives. Thus, from the literature review, three most commonly used expendable abrasive materials were selected for this research: coal slag, copper slag, and specialty sand. The characteristics of these materials are discussed in this section.
4.1.1. Coal Slag
The MSDS sheet in Appendix C provides detail information. Coal slag has been replacing sand because of the health effects associated with silica dust from sandblasting. A survey of U.S. shipyards showed that coal slag is a predominantly used abrasive on the East Coast and the Gulf of Mexico (JPCL 2000). A medium grade coal slag was used in this research. 4.1.2. Copper Slag
Copper slag is a by-product of copper smelting industry. The molten slag from the smelter is quenched in water and quick cooling of this slag results in an amorphous,
noncrystalline particulates. Some of the characteristics of copper slag such as hardness, high density, and low free silica content are useful in removing heavy rust and providing a high profile surface finish. Kleen Blast TM and Tru-Grit TM are two of the commercially available copper slag abrasives. Average density of copper slag is 100 lbs/ft3.The composition of copper slag may vary from one manufacturer to other, but can contain arsenic, beryllium, chromium, nickel, lead, and copper (Paddison 2000, Appleman 1998, Hansink 2000, Obery and
Wayne1999). The MSDS sheet in Appendix C provides detail information. Copper slag is a predominantly used abrasive in shipyards on the West Coast (JPCL 2000). A medium grade copper slag was used in this research.
4.1.3. Specialty Sand
with a flat 0.25” screen. Special properties of this sand include purity, inertness, hardness, resistance to high temperatures, grain size, and color make it useful to a variety of industrial applications. Medium grade specialty sand was used in this research and average density is 100 lbs/ft3. The MSDS sheet in Appendix C provides detail information.
4.2. Equipment
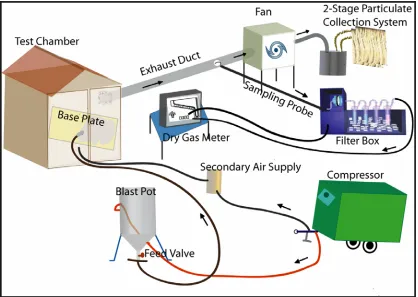
In order to carry out enclosed abrasive blasting operations and collect PM emissions from these operations, an emissions test facility was constructed at north side of the engineering building on the main campus of the University of New Orleans (UNO). This facility was
equipped with test chamber, blasting equipment, test plates, exhaust duct, stack sampling system, and particulate collection system. Figure 1 shows a sketch of the emissions test facility. The details of this equipment are discussed in this section.
4.2.1. Test Chamber
An enclosed test chamber of 3.7 m length, 3 m width and 2.5 m height (12 x 10 x 8 feet) was constructed using plastic sheets to contain the particulate emissions and protect the
environment and prevent excessive duct discharge into atmosphere during strong winds. These plastic sheets were firmly riveted to the wooden floor, made of seasoned wood and treated with waterproofing material. In order to prevent seepage of water into the test chamber, the gaps in the floor were sealed with silicon. A wooden ramp was constructed to smoothly move the test plates cart in and out of the chamber before and after blasting. An exhaust window was located at one end of the test chamber to provide for make-up air and vent PM emissions through an
exhaust dust for sampling. The test chamber was also provided with internal lighting for visibility.
4.2.2. Blasting Equipment
Blasting equipment consists of a blast pot, blast nozzle, air hose, blast hose, secondary-air supply unit, moisture separator, and personal protective equipment.
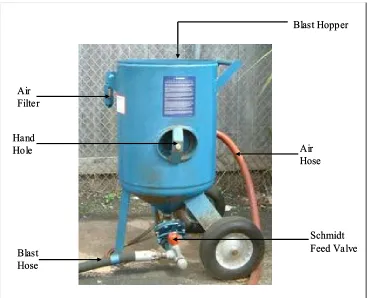
4.2.2.1. Blast pot
The hopper located at the top of the blast pot serves as an opening for easy feeding the blast material. An automatic filling valve at the center of the hopper seals (pops up) when
compressed air supplied and opens when the compressor is turned off. The hand hole on the side of the blast pot allows easy access for cleaning and removal of any foreign objects fallen into the blast pot. Conical bottom of the blast pot enables a smooth flow of material. A metering valve, or feed valve, fixed at the bottom of the blast pot allows control of material flow for abrasive
blasting. These valves vary in size and material flow is controlled by turning the valve. While some blast pots readily come with a feed valve, others may need a separate feed valve (U.S. ACE 1995, U.S. EPA, 1997a). In this research, a 273 kg (600 lbs) capacity Abec© blast pot, mounted on wheels was used. A Schmidt feed valve was used to control the abrasive material flow. Figure 2 shows the blast pot and its important components.
Blast Hopper
Hand
Hole Air
Hose
Schmidt Feed Valve Air
Filter
Blast Hose
Blast Hopper
Hand
Hole Air
Hose
Schmidt Feed Valve Air
Filter
Blast Hose
4.2.2.2. Blast nozzle
Blast nozzle are identified by the inside diameter on the orifice and measured in
sixteenths of an inch (3/16-inch, 5/10-inch). These nozzles are assigned a number based on the diameter. Selection on nozzle diameter depends on the capacity of air compressor and blast pressure required. If the nozzle is too large, more volume of air must be supplied to achieve required blast pressure. A Bazooka No.6 venturi type blast nozzle (3/8-inch or 9.5 mm diameter) was used in this research.
4.2.2.3. Air hose and blast hose
The air hose is used to connect the compressor to the blast plot. The diameter of the hose must be sufficient in preventing frictional losses and pressure drops, which decrease the process efficiency. The blast hose is used to connect the blast pot to the blast nozzle and it carries both abrasive material and compressed to the nozzle. This hose must be strong enough to carry the material at high pressures.
4.2.2.4. Other blasting equipment
Asecondary air supply unit was used to provide air to the blaster and moisture separators were used to remove moisture from compressed air and secondary air supply. Personal protective equipment included a respirator, helmet and heavy duty shoes.
4.2.3. Test Plates
4.2.4. Air Compressor
The air compressor provides the blast pressure required in dry abrasive blasting. The compressor must be able to provide required blast pressures to achiever maximum productivity. Sullair Model 375H© and Ingersoll Rand (power rating: 125-130 hp) compressors were used as compressed air sources, which were able to provide a maximum blast pressure 150 PSI.
4.2.5. Exhaust Duct System
The exhaust duct system consisted of an exhaust duct and a fan. This system was used to vent the emissions from the blasting operations in the test chamber to a particulate collection system. Another important use of this systems was to collect sample PM emission factors. The entrance of the duct system was fitted with a mesh to prevent too coarse particles from entering the duct. The duct was 0.30 m (1 foot) in diameter with smooth inner surface to avoid
Figure 3: Exhaust Duct System (top left: From inside the test chamber, top right: from outside the test chamber, bottom: duct connected to exhaust fan)
4.2.6. Stack Sampling System
U.S. EPA approved stack sampling system was used in this research. Components of this system are mentioned in this section. The purpose of these components is discussed with the sampling procedure.
4.2.6.1. Sampling train
4.57 mm (0.18 inch) was selected in this research. The sampling probe has nozzle on one end and the other end is connected to filter holder at the top. An S-type pitot tube and a thermocouple are attached to the sampling probe. The exhaust gas from nozzle flows through the filter holder which holds a filter paper. The bottom of the filter holder is connected to a series of four impingers, kept in a cold box. The first two impingers are filled with 100 ml water. The third impinger is left dry and empty. Fourth impinger contains a measured quantity of silica gel.
4.2.6.2. Dry gas meter system
Dry gas meter (DGM) system consists of various components: pyrometer, vacuum gauge, an air tight pump, dry gas meter, and an orifice meter. The outlet of the fourth impinger is
connected to DGM for measuring sample gas temperature and pressure.
4.2.7. Particulate Collection System
In order to collect emissions effectively and control their discharge into the atmosphere, a two-stage particle collection system was installed downstream of the fan. The first stage
Figure 4: Two-Stage Particle Collection System (left: drum, right: fabric filter system)
4.3. Experimental Parameters
As mentioned in Section 3.3.2, blast pressure and abrasive feed rate are important process parameters in dry abrasive blasting. Three most commonly used non-reusable abrasives were selected to study the effect of blast pressure and feed rate on performance of the abrasive materials. Based on literature review, it was evident that many industrial processes use blast pressures ranging from 80 to 120 PSI. Selection of feed rate depends on the valve size and abrasive material. Thus, from recommendations of equipment and material suppliers, feed rates ranging from 3 to 5 turns were selected. A detailed list of experimental parameters is given below:
4.3.1. Variable Parameters
• Abrasive Material: Coal Slag, Copper Slag, and Specialty Sand
• Blast Pressure: 80 PSI, 100 PSI, and 120 PSI
• Feed Rate: 3, 4, and 5 turns of opening of Schmidt feed valve
4.3.2. Constant Parameters
• Blast Nozzle: Bazooka No.6 nozzle with 9.5 mm diameter (venturi nozzle)
• Angle of Deflection: 900 (Nozzle held perpendicular to surface)
• Stand-off Distance: 12” was maintained between the test plate and the blast nozzle
• Exhaust Flow Rate: 3000 cfm (average volumetric flow rate)
• Surface Contamination: Paint with average thickness of 0.73 mill
• Surface Finish: Near-white finish (SP-10)
4.4. Experimental Procedure
The experimental procedure is explained in two sections: abrasive blasting and PM sampling. PM sampling was performed while abrasive blasting was being carried out.
4.4.1. Abrasive Blasting
The test plates were coated with a 1:1 mixture of commercially available Rust Oleum© Safety Yellow paint and a thinner. The paint was allowed to dry for 24 hours. Upon drying these plates were moved inside the test chamber with the help of a cart. The inside of the blast pot was checked for any foreign materials. Blast hose and air hose were connected to the blast pot and feed valve was closed tightly. Stack sampling equipment was assembled. A measured quantity of abrasive material (100 lbs in most cases) was added. Prior to adding, it was made sure that the material was free of lumps and moisture. In case of presence of moisture, the material was well dried and then added into the blast pot. Presence of lumps or moisture results in clogging the valve and non-uniform flow of material.
blasting, then carried out blasting inside the chamber. During the whole time of abrasive blasting, the test chamber was kept enclosed. Blasting was carried out until the blast pot was emptied. The blaster visually ensured that the dwell time was sufficient to achieve a near-white surface finish. The compressor was then turned off and feed valve was closed. The time taken for each test run was recorded using a stopwatch and the area cleaned was measured using a
measuring tape. For each combination of pressure and feed rate, three test runs were carried out to minimize experimental errors and test the repeatability of the results. Thus a total number of 27 experiments were performed for each material.
4.4.2. PM Sampling
As the blasting was carried out inside the chamber, samples were drawn isokinetically through the sampling probe. A brief procedure for PM sampling is discussed in this section and a detailed procedure is available at http://www.epa.gov/ttn/emc.
4.4.2.1. Selection of sampling ports and traverse points
Based on the guidelines provided in EPA Method 1 (U.S. EPA 1997d), in order to minimize the effect of flow disturbances on sampling, a sampling port was located at point at least 8 diameters upstream (test chamber) and 2 diameters downstream (exhaust fan). For a circular duct with a diameter between 0.30 and 0.61 meter (12 and 24 inches), a total of eight traverse points must be selected. The location of these traverse points, along the plane
4.4.2.2. Stack gas velocity and flow rate measurements
The average gas velocity in the duct was determined from measurement of average velocity head with the S-type pitot tube attached to the sampling probe. A temperature sensor attached to the sampling probe was used to measure the exhaust gas temperature at the traverse points. Atmospheric pressure was recorded from a nearby National Weather Service station. Leak checks were performed once the sampling train was assembled. The sample probe was sufficiently heated to prevent condensation of moisture present in the exhaust gas. At each traverse point, exhaust gas sample was collected for two minutes. Thus, total sampling time was sixteen minutes for each of the test runs. At the end of 16 minutes, sampling probe was
withdrawn, and the exhaust fan was turned off. The measurements made at each traverse point, according EPA Method 2 (U.S. EPA 1997e), and equations used to calculate the stack gas velocity and flow rate for each experiment are given in Appendix A.
4.4.2.3. Determination of moisture content
4.4.2.4. Determination of PM emissions
The particles were collected on a pre-weighed Whatman No. 10 filter paper that was already desiccated to eliminate moisture. The filter assembly box was maintained at a temperature of 120 ± 15°C to collect particulate matter from the sample gas stream while preventing moisture condensation. Once the sample was collected, the filter paper was removed from the filter box and placed in a dessicator. PM from the probe was collected in a beaker by rinsing the probe with acetone. The final weights of PM in filter paper and beaker were recorded after dessicating them for 24 hours. The sum of the weights of both containers was used to determine the actual mass of emissions in the stack gas using the equations in EPA Method 5 (U.S. EPA 1997g). The actual mass of PM collected in sample exhaust gas, equations used and total mass of PM in the exhaust gas for each experiment are presented in Appendix A.
4.5. Statistical Analysis
The best-fit models were selected based on the physical phenomenon discussed in Literature Review, R2, and continuity of the curve (in case of 3-D models). The R² value, also known as the Coefficient of Determination, is an indicator that ranges in value from 0 to 1. This coefficient reveals how closely the estimated values for the regression correspond to the actual data. A regression is most reliable when its R² value is at or near 1 (Kleinbaum 1992, McBean and Rovers 1998). The value for R² was determined using the following equations:
Residual = (Yi – Ŷi)
Sum of Residuals = ∑ (Yi – Ŷi)
Average Residual = ∑ (Yi – Ŷi) / n
Residual Sum of Squares, SSE = ∑ (Yi – Ŷi)2
Regression Sum of Squares, SSR, ∑ (Ŷi -Yi)2
Total Sum of Squares, SST = SSE + SSR,
Coefficient of Multiple Determination, R2 = SSR / SST
Two-way ANOVA was used to test the significance of the regression model. F static was calculated for H0 : a = 0, b = 0, c = 0, d = 0, e = 0, and f = 0, where a, b, c, d, e, and f are
coefficients in the regression model. Null hypothesis (H0) was rejected if Prob(F) < 0.025.
Prob(F) = 0 means the probability of obtaining data equal to more extreme under the null
hypothesis is zero. In addition, t static was calculated for H0: a = 0, b = 0, c = 0, d = 0, e = 0, or f
Since the analysis was performed assuming normal distribution of the data, residual plots were used check this assumption. The following scatter diagrams were plotted to check the normal distribution of the data:
• Residuals vs. Predicted Y: the residuals should not show any pattern or structure for normally distributed data.
• Residual Normality Plot: The plot must be a straight line for normally distributed data.
In addition, predicted values of performance parameters were plotted with observed values.
5. Results and Discussion
The fundamental goals of this study was to evaluate the performance of three non-reusable abrasives and study the effect of blast pressure and feed rate on performance of each material. In order to achieve these goals, the following parameters were calculated for each experiment performed:
• Emission Factors:
o kg TPM per unit area cleaned: Mass of TPM emitted (kg) / Area cleaned (m2)
o kg TPM per unit mass of abrasive: Mass of TPM emitted (kg) / Quantity of abrasive used (kg)
• Productivity:
o Area cleaned per unit time: Area cleaned (m2) / Blasting time (hr)
• Consumption:
o Mass of abrasive per unit area: Quantity of abrasive used (kg) / Area Cleaned (m2)
Table 5: Experimental Results for Coal Slag Pressure Feed Rate Abrasive Quantity Blasting Time Area Cleaned TPM
Emissions Productivity Consumption
Emission Factor 1
Emission Factor 2
PSI Turns lbs min ft2 g m2/hr kg/m2 kg/m2 kg/kg
120 3 100 6 13.0 3604 12.08 37.57 2.984 0.0794
120 3 100 6 12.0 3590 11.15 40.70 3.221 0.0791
120 3 100 6 12.0 3562 11.15 40.70 3.195 0.0785
120 4 100 5 17.0 3349 18.95 28.73 2.121 0.0738
120 4 100 6 17.5 3388 16.26 27.91 2.084 0.0747
120 4 100 6 17.0 3371 15.79 28.73 2.135 0.0743
120 5 150 7 17.0 5526 13.54 43.10 3.499 0.0812
120 5 150 7 18.0 5839 14.33 40.70 3.492 0.0858
120 5 150 7 18.0 5780 14.33 40.70 3.456 0.0849
100 3 100 7 13.0 2849 10.35 37.57 2.358 0.0628
100 3 100 7 12.5 2693 9.95 39.07 2.319 0.0594
100 3 100 8 12.5 2785 8.71 39.07 2.398 0.0614
100 4 120 5 12.5 2345 13.94 46.88 2.019 0.0431
100 4 120 7 18.0 3327 14.33 32.56 1.990 0.0611
100 4 120 7 17.0 3172 13.54 34.48 2.009 0.0583
100 5 120 6 12.0 3372 11.15 48.84 3.025 0.0619
100 5 80 4 8.0 2368 11.15 48.84 3.186 0.0652
100 5 120 6 12.5 3499 11.61 46.88 3.013 0.0643
80 3 30 4 6.0 1045 8.36 24.42 1.875 0.0768
80 3 100 11 15.0 2679 7.60 32.56 1.922 0.0590
80 3 70 6 9.5 1634 8.83 35.98 1.851 0.0514
80 4 100 7 16.5 2003 13.14 29.60 1.307 0.0441
80 4 100 7 16.0 2041 12.74 30.52 1.373 0.0450
80 4 120 11 24.0 2912 12.16 24.42 1.306 0.0535
80 5 100 7 13.0 3004 10.35 37.57 2.488 0.0662
80 5 100 7 12.0 2689 9.56 40.70 2.412 0.0593
Table 6: Mean and Standard Deviation (SD) of Experimental Results for Coal Slag
Pressure
Feed
Rate Productivity Consumption Emission Factor 1 Emission Factor 2 PSI Turns m2/hr Mean SD kg/m2 Mean SD kg/m2 Mean SD kg/kg Mean SD
120 3 12.08 37.57 2.984 0.0794
120 3 11.15 40.70 3.221 0.0791
120 3 11.15
11.46 0.54 40.70 39.65 1.81 3.195 3.133 0.130 0.0785 0.0790 0.0005
120 4 18.95 28.73 2.121 0.0738
120 4 16.26 27.91 2.084 0.0747
120 4 15.79
17.00 1.71 28.73 28.45 0.47 2.135 2.113 0.026 0.0743 0.0743 0.0004
120 5 13.54 43.10 3.499 0.0812
120 5 14.33 40.70 3.492 0.0858
120 5 14.33
14.07 0.46 40.70 41.50 1.38 3.456 3.483 0.023 0.0849 0.0840 0.0024
100 3 10.35 37.57 2.358 0.0628
100 3 9.95 39.07 2.319 0.0594
100 3 8.71
9.67 0.86 39.07 38.57 0.87 2.398 2.358 0.040 0.0614 0.0612 0.0017
100 4 13.94 46.88 2.019 0.0431
100 4 14.33 32.56 1.990 0.0611
100 4 13.54
13.94 0.40 34.48 37.97 7.78 2.009 2.006 0.015 0.0583 0.0541 0.0097
100 5 11.15 48.84 3.025 0.0619
100 5 11.15 48.84 3.186 0.0652
100 5 11.61
11.30 0.27 46.88 48.19 1.13 3.013 3.075 0.097 0.0643 0.0638 0.0017
80 3 8.36 24.42 1.875 0.0768
80 3 7.60 32.56 1.922 0.0590
80 3 8.83
8.26 0.62 35.98 30.99 5.94 1.851 1.883 0.036 0.0514 0.0624 0.0130
80 4 13.14 29.60 1.307 0.0441
80 4 12.74 30.52 1.373 0.0450
80 4 12.16
12.68 0.49 24.42 28.18 3.29 1.306 1.329 0.039 0.0535 0.0475 0.0052
80 5 10.35 37.57 2.488 0.0662
80 5 9.56 40.70 2.412 0.0593
80 5 10.59
Table 7: Experimental Results for Copper Slag Pressure Feed Rate Abrasive Quantity Blasting Time Area Cleaned TPM
Emissions Productivity Consumption
Emission Factor 1
Emission Factor 2
PSI Turns lbs min ft2 g m2/hr kg/m2 kg/m2 kg/kg
120 3 100 7 8.5 2060 6.77 57.46 2.609 0.0454
120 3 100 8 9.0 2165 6.27 54.26 2.589 0.0477
120 3 50 5 6.0 1431 6.69 40.70 2.567 0.0631
120 4 150 10 20.0 2725 11.15 36.63 1.466 0.0400
120 4 100 6 12.0 1754 11.15 40.70 1.573 0.0387
120 4 50 4 8.0 1163 11.15 30.52 1.565 0.0513
120 5 120 6 10.0 2823 9.29 58.61 3.039 0.0518
120 5 80 4 7.0 1962 9.75 55.82 3.017 0.0540
120 5 100 4 7.3 2053 10.10 67.36 3.048 0.0452
100 3 100 8 13.5 2463 9.41 36.17 1.964 0.0543
100 3 50 4 7.0 1256 9.75 34.89 1.932 0.0554
100 3 75 6 10.3 1859.5 9.58 35.53 1.948 0.0548
100 4 150 7 18.0 2946 14.33 40.70 1.762 0.0433
100 4 150 7 17.8 2938 14.18 41.13 1.775 0.0432
100 4 120 6 15.0 2438 13.94 39.07 1.749 0.0448
100 5 120 8 15.8 3105 10.97 37.21 2.122 0.0570
100 5 50 4 8.0 1538 11.15 30.52 2.070 0.0678
100 5 50 4 8.0 1518 11.15 30.52 2.043 0.0669
80 3 50 6 6.0 1560 5.57 40.70 2.800 0.0688
80 3 50 7 6.5 1581 5.18 37.57 2.618 0.0697
80 3 50 6 6.5 1591 6.04 37.57 2.634 0.0701
80 4 150 12 19.0 3729 8.83 38.56 2.113 0.0548
80 4 100 6 9.8 1861 9.06 50.09 2.055 0.0410
80 4 125 9 14.4 2795 8.94 44.33 2.084 0.0479
80 5 80 8 9.0 2957 6.27 43.41 3.537 0.0815
80 5 80 6 7.0 2306 6.50 55.82 3.546 0.0635