Research Note
Estimation of genetic variability, expected genetic advance, correlation
and path analysis in field pea (
Pisum sativum
L.)
M.S. Jeberson1, K.S. Shashidhar1 and K. Iyanar2
1
Directorate of Research, Central Agricultural University, Imphal, Manipur-795004, India
2Department of Forages, Centre for Plant Breeding & Genetics, Tamil Nadu Agricultural University, Coimbatore-641041,
Tamil Nadu, India
E-mail: [email protected]
(Received: 11 Aug 2015; Accepted: 06 Dec 2016)
Abstract
The investigation was undertaken to estimate the genetic parameters for nine characters with 12 genotypes of field pea. Based on the mean performance, the genotypes HFP 1016, IPF-13-14, Prakash and Pant P 243 showed higher performance for yield suggesting that these genotypes can be used for breeding to evolve superior genotypes in the region. The analysis of variance shows large variability present among the genotypes studied. High to moderate GCV and PCV estimates and high heritability with high genetic advance as percent of mean were observed for the characters namely plant height, cluster/plant, seeds/pod, 100 seed weight and yield. The correlation coefficients revealed positive and highly significant association of yield with plant height, cluster/plant, pods/plant, pod length, seeds/pod and 100 seed weight. The pods/plant exhibited highly positive and direct effect on grain yield followed by pod length and days to maturity .Therefore these characters can be considered for selecting genotypes to improve the grain yield in the field pea.
Keyword
Field pea, Genetic variability, GA, Correlation, Path analysis
Pea (Pisum sativum L.) is a prominent pulse crop of winter season in Manipur. Pea has tremendous nutrient value and contains vitamin A,B and C along with minerals, dietary fibres and antioxidant compounds (Urbanoet al., 2003). Genetic diversity in pea is essential for breeding purpose to improve the crop as well as evolve the new high yielding variety. Javaid et al. (2002) evaluated the local and exotic pea germplasm for earliness and grain yield through simple selection and suggested that elite genotypes can be used in hybridization programme for pea improvement. Nawabet al. (2008) studied positive and significant correlation between green pod yield/plot and number of seeds/pod and weight of pods/plant at genotypic and phenotypic levels. Tiwariet al. (2012) suggested that days to maturity, plant height and pod length showed high positive and direct effect on seed yield. These characters should be given due priority during selection for fieldpea improvement. Therefore this investigation was undertaken in such a way that to predict an appropriate plant type for selection so as to improve the seed yield in fieldpea.
The investigations were undertaken at Andro Research Farm, CAU, Imphal, Manipur during the year 2013-14. The Experimental material comprised of 12 genotypes of field pea viz., Rachna, Prakash, VL 59, Pant P 244, KPMR 853, IPF 13-14, RFP 2009-2-1, HFP 1016, KPF 1036, RFG 79, Pant P 243, IPF 13-13. Genetically pure seeds were grown in a RCBD with three replications in a plot size of 7.2 m2 (4m x 1.8m). Crop was sown on 29th November, 2013 with 30cm row and 10 cm plant spacing. All recommended agronomic and plant protection
practices were followed. The data were recorded for nine characters viz., days to 50% flowering, days maturity, plant height, cluster/plant, pods/plant, pod length, seeds/pod 100 seed height and yield(kg/ha). Genotypic and phenotypic coefficients of variability, heritability estimates in broad sense and genetic advance as percentage of mean were estimated following Singh and Choudhary (1979). Path co-efficient analysis was calculated according to Dewey and Lu (1959). The success of any breeding programme lies upon the thorough knowledge of genetic variability, heritability and type of gene action involved in the inheritance of improvement of desirable characters. The analysis of variance showed significant differences among the genotypes for all characters studied which indicates there is wide genetic variability present among the genotypes studied (Table. 1). Thus, success of genetic enhancement is attributed to the magnitude and nature of variability present for a specific character.
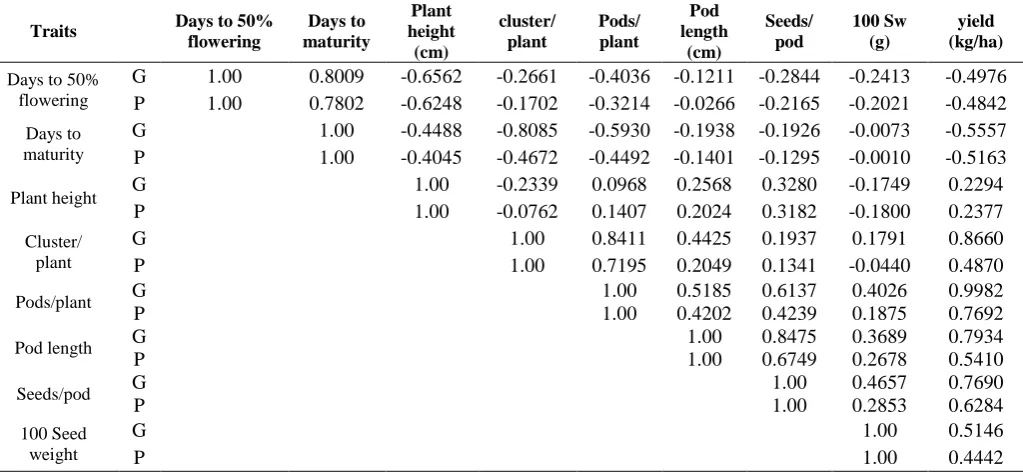
phenotypic coefficient of variation for pods/plant, seed yield per plot and cluster/plant. Yadav et al. (2009) reported that plant height and seed yield recorded high and significant positive GCV and PCV in field pea. Lavanya et al.(2010) also observed high GCV and PCV estimates for seed yield per plant. Heritability estimates ranged from 37.0% (cluster/plant) to 97.5% (days to maturity). High heritability recorded for days to maturity (97.5%), days to 50% flowering (96.8%), yield (93.1%) and plant height (92.5%). The moderate heritability were found in 100 seed height (74.5%), seeds/pod (71.9%), pods and pod length (57.5%). Nawab et al. (2008) also shown the high heritability for days to 50% flowering and yield (kg/ha). The high heritability for these characters indicates there is a less influence of environment. Lavanya et al.(2010) recorded high heritability for plant height, seed yield and days to 50% flowering. High genetic advance as percent of mean were recorded for plant height (48.21),yield (kg/ha) (40.82), cluster/plant (33.85), pods/plant (27.62), 100 seed weight (22.24) and seeds/pod (21.76). It reveals that these characters were governed by additive genes and selection for improvement in these traits would be beneficial. The character days to maturity exhibited low genetic advance as mean percent (3.28) which indicates that the character is governed by non additive genes. Jaiswal et al. (2015) observed that days to maturity recorded low genetic advance as percent of mean (4.03).Incase of correlation coefficients studies for genotypic and phenotypic, the genotypic coefficient values are higher than the phenotypic correlation coefficients value for almost all the characters either it is in positive or negative direction shows that the strong association between these characters (Table 3.) which indicates environment plays minor role in the modification of the expression of the genes. The correlation coefficients recorded positive and highly significant association of yield with plant height, cluster/plant, pods/plant, pod length, seeds/pod and 100 seed weight. This result is in corroboration with study of the Yadav et al (2010) who studied the character association with 52 diverse pea genotypes. Days to 50% flowering is negatively correlated with all the characters except days to maturity. Days to maturity is negatively correlated with all the character except days to 50% flowering. Plant height is positively and significantly correlated with pods/plant, pod length, seeds/pod and yield (kg/ha); cluster/plant is positively correlated with pods/plant, pod length, seeds/pod, 100 seed weight and yield;, pods/plant is positively correlated with all the characters except days to 50% flowering and days to maturity. Pod length is positively correlated with all the character except days to 50% flowering and days to maturity. Seeds/pod is positively correlated with all except days to 50% flowering and days to maturity. 100 seed weight is positively correlated
with all the character except days to 50% flowering, days to maturity and plant height. These results are akin with the results of Nawab et al. (2008), Vikas et al. (1999), Sandeep et al. (2011), Singh et al. (2011) and Singh et al. (2006). In the present study, correlation studies shows that, all the characters had positive character association are important yield contributing characters except days to 50% flowering and days to maturity and plant height.
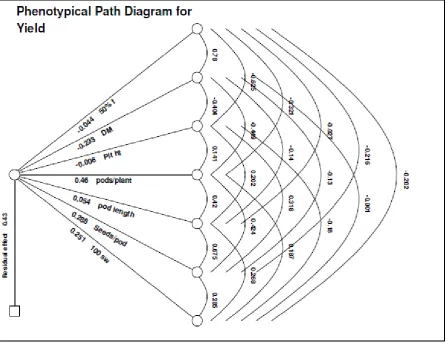
Raiet al. (2006) observed similar results that the yield/plant had positive and significant association with pods/plant and plant height. Govardhan et al. (2013) were also recorded that grain yield/plant is positively correlates with pods/plant. Parihar et al.(2014) also observed that seed yield had positive and significant association with most of the traits. Path coefficient was worked out based on the yield as a dependant variable and all the other eight characters as independent variables (Table 4.). The pods/plant exhibited highest positive and direct effect on grain yield followed by pod length and days to maturity .Therefore these characters can be considered for selecting genotypes to improve the grain yield in the field pea. The days to 50% flowering, plant height, cluster/plant, seeds/pod and 100 seed weight shows the negative direct effect. However, the negative direct effects of all these characters were nullified by their indirect effect through other characters, which ultimately resulted in to highly significant positive correlation with grain yield. Therefore indirect selection through other component characters with these five traits exhibited positive indirect effects can be recommended so as to bring improvement in grain yield. The high and positive direct effect was also reported by Tiwari et al. (2012), Kumar et al. (2003) and Arya et al. (2004). The high and positive direct of pods/plant, pod length and days to maturity on yield resulted from tight and positive correlation between them.
Further, the present investigation, it is revealed that 57 percent of the yield contributing characters was utilized in this data analysis as the residual effect was 0.43(43%) (Fig. 1).
References
Arya, S., Malik, B.P.S., Kumar, R. and Dhari, R. 2004. Variability, correlation and path analysis in field pea (Pisumsativum, L.). Haryan. Agric.Univ, J. Res 34(2): 149-153.
Dewey, J.R. and K.H. Lu. 1959. A correlation and path coefficient analysis of components of crested wheat seed production. Agron. J., 51:515-518. Govardhan, G., Lal, G.M., Vinoth R. and Reddy,
P.R.2013. Character association studies in M2 generation of fieldpea (Pisumsativum var. arvense L.). Int J. of Appl Bio and Pharm Tech, 4(4):161-163.
fieldpea (Pisumsativum L.). International Journal of Science and Research 4(1):1-2. Javaid, A., Ghaffor, A. and Anwar, R. 2002. Evaluation
of local and exotic pea (Pisumsativum L.) germplasm for vegetable and dry grain traits.
Pak. J. Bot. 34: 419-427.
Kumar, M., Tewatia, A.S. and Sharma, N.K. 2003. Correlation and path analysis in pea (PisumsativumL.), Haryan. Agric.Univ, J.Res
3(1/2): 104-107.
Lavanya G.R., Singh, D. and Vinoth, R. 2010. Genetic variability, character association and component analysis in fieldpea, Pisumsativum var. arvense. Madras Agric J, 97(10-12): 329-331.
Nawab, N.N.,Subhani, G.M., Mahmood, K., Shakil, Q. and Saeed, A. 2008. Genetic variability, correlation and path analysis studies in Garden pea (Pisumsativum, L). J.Agric. Res., 46(4): 333-340.
Parihar A.K., Dixit, G.P., Pathak, V. and Singh, D. 2014. Assessment of the genetic components and trait association in diverse set of fieldpea (PisumsativumL.) genotypes. Bang J Bot,
43(3):323-330.
Rai, M., Verma, A., Kumar, R. and Vishwanath. 2006. Multivariate genetic analysis of pea (Pea sativum). Veg Sci, 33(2): 149-154.
Sandeepkumar, T., Reddy, D.M., Reddy, K.H. and Sudhakar, P. 2011. Targeting of traits through assessment of inter relationship and path analysis between yield and yield components for grain yield improvement in single cross hybrids of maize (Zea mays). Int. J. of App Biol and Phar. Tech, 2(3): 123-129.
Singh, A., Singh, S. and Prasad Babu, J.D. 2011. Heritability, character association and path analysis studies in early segregating population of fieldpea (Pisumsativum L. vararvense). Intl. J. Plant Breeding and Genetics, 1-7.
Singh, J.D. and Singh, I.P. 2006. Genetic variability and heritability expected genetic advance and character association in field pea (Pisumsativum L.), Leg. Res. 29(1):65-67. Singh, R.K. and Chaudhary, B.D. 1979. Biometrical
methods in quantitative genetic analysis. Kalyani Publ., New Delhi.
Tiwari, G. and RoopaLavanya, G. 2012. Genetic variability, character association and component analysis in F4 generation of fieldpea (Pisumsativum var. arvense L.). Kar. J. of Agric. Sci,25(20): 173-175.
Urbano, G., Arnda, P. and Gomez-Villalva, E. 2003. Nutrition evaluation of pea (Pisumsativum L.) protein diets after mild hydrothermal treatment and with and without added phytase. J. Agric. Food. Chem 51: 2415-2420.
Vikas and Singh, S.P. 1999. Variability and correlation studies in pea (Pea sativumL.). Annals Agric. Bio. Res., 4(1): 87-91.
Yadav, R., Srivastava, R.K., Kant, R. and Singh, R. 2009. Studies on genetic variability, heritability and and character association in fieldpea. Crop Res,38 (1):184-188.
Yadav, P., Singh, A.K. and Srivastava, C.P. 2010. Genetic variability and character association in diverse collection of Indian and Exotic
germplasm lines of Pea (Pisumsativum L.),
Table 1. Analysis of variance for different morphological and economic trait in Field pea
S.No. Traits Sum of Squares Mean squares Fvalue
1. Days to 50% flower 423.56 38.51 91.31
2. Days to maturity 107.00 9.73 116.73
3. Plant height 9819.39 892.67 37.91
4. cluster/plant 9.75 0.89 2.75
5. Pods/plant 18.23 1.66 5.97
6. Pod length 5.74 0.52 5.07
7. Seeds/pod 12.51 1.14 8.69
8. 100 seed weight 153.24 13.93 9.78
9. Yield (kg/ha) 1287855.56 117077.78 41.73
Table. 2. Genetic parameters for different morphological traits in Field pea
Variables VG VP GCV% PCV% h2 GA GA as percent
mean
Days to 50% flowering 12.694 13.116 5.058 5.141 96.8 7.221 10.250
Days to Maturity 3.215 3.298 1.613 1.634 97.5 3.647 3.280
Plant height 289.71 313.256 24.333 25.302 92.5 33.719 48.205
Cluster/plant 0.188 0.509 27.026 44.453 37.0 0.543 33.847
Pods/plant 0.46 0.737 16.976 21.496 62.4 1.103 27.616
Pod length 0.139 0.243 7.445 9.817 57.5 0.584 11.631
Seeds/pod 0.335 0.466 12.456 14.686 71.9 1.012 21.761
100 seed weight 4.169 5.593 12.507 14.487 74.5 3.631 22.243
Yield (kg/ha) 38090.656 40896.465 20.532 21.275 93.1 388.010 40.819
Table 3. Estimates of genotypic and phenotypic correlation coefficient in Field pea
Traits Days to 50%
flowering
Days to maturity
Plant height (cm)
cluster/ plant
Pods/ plant
Pod length
(cm)
Seeds/ pod
100 Sw (g)
yield (kg/ha)
Days to 50% flowering
G 1.00 0.8009 -0.6562 -0.2661 -0.4036 -0.1211 -0.2844 -0.2413 -0.4976 P 1.00 0.7802 -0.6248 -0.1702 -0.3214 -0.0266 -0.2165 -0.2021 -0.4842 Days to
maturity
G 1.00 -0.4488 -0.8085 -0.5930 -0.1938 -0.1926 -0.0073 -0.5557 P 1.00 -0.4045 -0.4672 -0.4492 -0.1401 -0.1295 -0.0010 -0.5163
Plant height G 1.00 -0.2339 0.0968 0.2568 0.3280 -0.1749 0.2294
P 1.00 -0.0762 0.1407 0.2024 0.3182 -0.1800 0.2377
Cluster/ plant
G 1.00 0.8411 0.4425 0.1937 0.1791 0.8660
P 1.00 0.7195 0.2049 0.1341 -0.0440 0.4870
Pods/plant G 1.00 0.5185 0.6137 0.4026 0.9982
P 1.00 0.4202 0.4239 0.1875 0.7692
Pod length G 1.00 0.8475 0.3689 0.7934
P 1.00 0.6749 0.2678 0.5410
Seeds/pod G 1.00 0.4657 0.7690
P 1.00 0.2853 0.6284
100 Seed weight
G 1.00 0.5146
Table 4. Direct and indirect effects of different traits on seed yield in Field pea
Traits Days to 50%
flowering
Days to maturity
Plant height
(cm)
Cluster/ plant
Pods/ plant
Pod length
(cm)
Seeds/ pod
100 Sw (g)
Days to 50%
flowering -1.3969 -1.1187 0.9166 0.3717 0.5637 0.1691 0.3973 0.3371
Days to maturity 0.9140 1.1412 -0.5121 -0.9227 -0.6767 -0.2212 -0.2198 -0.0084 Plant height 0.2778 0.1900 -0.4234 0.0990 -0.0410 -0.1087 -0.1389 0.0741 Cluster/plant 0.0287 0.0873 0.0253 -0.1080 -0.0909 -0.0478 -0.0209 -0.0193 Pods/plant -0.5406 -0.7944 0.1297 1.1267 1.3396 0.6946 0.8221 0.5393 Pod length -0.1530 -0.2450 0.3245 0.5593 0.6554 1.2640 1.0712 0.4663 Seeds/pod 0.2668 0.1807 -0.3077 -0.1818 -0.5757 -0.7951 -0.9382 -0.4369 100 Seed weight 0.1056 0.0032 0.0765 -0.0783 -0.1762 -0.1614 -0.2038 -0.4376
Yield (kg/ha) -0.4976 -0.5557 0.2294 0.8660 0.9982 0.7934 0.7690 0.5146