Microbial biodiversity in arable soils is affected by agricultural practices**
Agnieszka Wolińska1*, Dorota Górniak2, Urszula Zielenkiewicz3, Agata Goryluk-Salmonowicz4,Agnieszka Kuźniar1, Zofia Stępniewska1, and Mieczysław Błaszczyk4
1Department of Biochemistry and Environmental Chemistry, The John Paul II Catholic University of Lublin, Konstantynów 1i, 20-708 Lublin, Poland
2Faculty of Biology and Biotechnology, Department of Microbiology, University of Warmia and Mazury in Olsztyn, Oczapowskiego 1a, 10-719 Olsztyn, Poland
3Department of Microbial Biochemistry, Institute of Biochemistry and Biophysics PAS, Pawińskiego 5a, 02-206 Warsaw, Poland 4Department of Microbial Biology, Warsaw University of Life Sciences, Nowoursynowska 159, 02-776 Warsaw, Poland
Received September 14, 2016; accepted February 1, 2017
*Corresponding author e-mail: [email protected]
**This work was partly funded by the National Science Centre (Poland), grant No. DEC-2013/09/D/NZ9/02482, 2014-2016.
A b s t r a c t.The aim of the study was to examine the diffe- rences in microbial community structure as a result of agri-cultural practices. Sixteen samples of cultivated and the same number of non-cultivated soils were selected. Gel bands were identified using the GelCompar software to cre-ate the presence-absence matrix, where each band represented a bacterial operational taxonomic unit. The data were used for principal-component analysis and additionally, the Shannon-Weaver index of general diversity, Simpson index of dominance and Simpson index of diversity were calculated. Denaturing gradient gel electrophoresis profiles clearly indicated diffe- rentiation of tested samples into two clusters: cultivated and non-cultivated soils. Greater numbers of dominant operational taxonomic units (65) in non-cultivated soils were noted compared to cultivated soils (47 operational taxonomic units). This implies that there was a reduction of dominant bacterial operational taxonomic units by nearly 30% in cultivated soils. Simpson domi- nance index expressing the number of species weighted by their abundance amounted to 1.22 in cultivated soils, whereas a 3-fold higher value (3.38) was observed in non-cultivated soils. Land-use practices seemed to be a important factors affected on biodiversity, because more than soil type determined the cluster-ing into groups.
K e y w o r d s: DGGE, 16S rRNA gene, Simpson diversity, bacterial communities, arable soils
INTRODUCTION
Understanding of the main drivers influencing diver -sity of microbial species in soils is important as it can be related to agricultural crop yields (Lopes et al., 2011). The European Environmental Agency (EEA), the Commission
of the European Communities (EC), European Union (EU), Biodiversity Strategy to 2020 and European project ENVASSO promote the protection strategy of microbial communities, especially in the arable soils with description of soil microbiological degradation state. It is known, that agricultural types of soil are usually biologically degra-
ded (Wolińska et al., 2014), which is confirmed by the fact
that arable soils are less biodiverse (Torsvik et al., 1998), in comparison to natural soils (typically >1000 species per g). Soil biodiversity degradation has been estimated
to affect 16-40% of terrestrial areas (Girvan et al., 2003). Soil contains an intricate network of microbes and plants in a heterogeneous solid medium in which both chemical, physical and biological conditions vary at the molecular scale (Arias et al., 2005). Traditionally, soil quality has
been directly related to its productivity, but more recently it has been regarded as the soil capacity to sustain biologi-cal and environmental features, and to promote plant and animal health within ecosystems (Girvan et al., 2003). The productivity of agricultural systems is known to depend greatly upon the functional processes of soil microbial com- munities (Girvan et al., 2003). Arias et al. (2005) empha -sized that soil health provides an overall picture of soil functionality, whereas microbial diversity is intimately related to soil structure, and the way of land use and soil functions. A study of Kuffner et al. (2004) demonstrated that soil microorganisms are sensitive to anthropogenic disturbances, in particular to agricultural activities, and also
showed that the composition of the microbiota not only can give an information about the state but also about the previ-ous history of the soil ecosystem.
Biodiversity has been defined as the range of
signifi-cantly different types of organisms and their relative abun-dance in an assemblage or community (Torsvik et al., 1998). Species diversity consists of two components: (a)
species richness and (b) species evenness and/or distribu
-tion (Torsvik et al., 1998). Additionally, Louzpone et al. (2007) have distinguished diversity within each sample (α diversity) and the portioning of biological diversity among environments (β diversity). The latter could be
fur-ther divided into qualitative measure, which is connected to
the availability of data to compare community components,
and quantitative measures, which take into account relative
abundances of each organism type (Louzpone et al., 2007).
Community level fingerprinting methods, like
denatu-ring gradient gel electrophoresis (DGGE) introduced by Muyzer et al. (1993) have distinct advantages over cul-ture based assays, particularly in relation to describing the numerically dominant fraction of the community, a large component of which may not be conveniently cultured (Kuffner et al., 2004). Only a minor fraction of soil bac-teria, usually estimated at 1% of the total number of cells observed by direct counting, could be cultured on
labora-tory artificial media (Torsvik et al., 1998), which is why
the techniques such as DGGE can be superior for studying microbial diversity in the field and should be recommended
for the microbial community studies. All prokaryotes have
16S rRNA genes whose average length is about 1500 bp
(Shao-Qiang et al., 2012). The microbial diversity can be
estimated from the number of 16S rRNA gene sequence
similarity groups, i.e. the number of DNA bands on the DGGE gel (Shao-Qiang et al., 2012). Consequently, DGGE
provides an estimate of the diversity within a community, based on the number of amplicons of each type, represent-ing an operational taxonomic units (OTUs), assumed to be
an equivalent to a bacterial genotype (Arias et al., 2005;
Kuffner et al., 2004; Shao-Qiang et al., 2012). However, rare microorganisms which are ecologically relevant may not be detected using a universal approach (Kuffner et
al., 2004). Polymerase chain reaction (PCR) in combina
-tion with DGGE can provide informa-tion about presence/
absence but not about abundance of particular species due
to ‘qualitative nature’ of PCR (Petersen and Dahllöf, 2005). Nonetheless, those techniques are necessary to understand ecological effects on biodiversity (Petersen and Dahllöf, 2005). Casamayor et al. (2000) reported that to be visible as a band on the gel, a species should represent at least 1% of the soil microbial community. The analysis of the soil microbiological degradation state is systematically con-ducted by many countries of the European Union, but this
is the first such study undertaken in Poland.
Our major goal was to compare the bacterial community structure between agricultural and non-cultivated (natural)
soils in order to find out the degree of microbial commu
-nity degradation, caused by intensive agricultural practices. For the structural diversity determination of dominating
populations PCR-DGGE technique was applied. Principal
components analysis (PCA) and canonical correspondence analysis (CCA) for investigated soil bacterial communities
and environmental factors effect based on DGGE profiles
were also demonstrated.
MATERIALS AND METHODS
Study was performed in south-east part of Poland, in
Lubelskie province (51°13′N 22°54′E) which is characte-
rized by the great diversity of soil types and is one of the largest and most important agricultural areas in Poland where all Polish dominant soil units are present. Sixteen soil samples which were agriculturally exploited (culti-vated – C) and the same number of soils not agriculturally exploited (non-cultivated – NC) were studied. Soil mate- rials have been selected on the basis of earlier work for the typological soil recognition performed in 1991 within the framework of the Bank of Soil Samples (BSS) belonging to the Institute of Agrophysics PAS in Lublin (Bieganowski
et al., 2013). Consequently, the fact of soils cultivation is
documented since 1991 (from the foundation of BSS). Precise localization of the samples catalogued in the BSS created a possibility of the precise return to the sampling
place (Gliński et al., 1991).
The cultivated soils were sampled during spring
sea-son (April 2014) from non ploughed places (Wolińska et
al., 2014), according BSS locations. We consciously deci- ded to take samples in spring season before the time when vegetation completely started and when ploughing is ap- plied in order to avoid direct perturbations caused by til- lage that affects on microorganisms destruction. The same time control samples were taken from non agriculturally cultivated and non forested sites (covering at least 1 ha area), located in close neighbouring to cultivated soils and belonging to the same soil type (i.e. non cultivated from years fallow lands or grasslands). In our study we focused on demonstrating those differences that resulted from
long-term soil cultivation and soil ‘fatigue’ as those
diffe-rentiation in microbial communities may have resulted from soil cultivation or the lack of cultivation for many
years (20-40 years) of grasslands and/or fallow lands
moved. We did not focus on the well-recognized and well described by other researchers effect of direct ploughing on soil microbial community but rather we point to those differences which do not result from direct tillage impact.
Description of the fields differed by crop type and control
10 x 10 m2 were chosen for each of the 16 different areas of the sample sites characterized by the homogeneity of the
vegetation cover (Table 1). Within these squares approx. 50 random soil samples were taken from the top layer (0-20 cm) using a 2.5 cm diameter auger. Single samples
were combined and homogenized into one sample in order to receive the most representative soil material for each
investigated site. In this manner, 16 samples for cultivated (C) and 16 samples for control sites (NC) were obtained.
Haplic Luvisols, Brunic Arenosols and Albic Luvisols are predominant soil types in Poland, occupying by 82% of the country, thus their share (nine soil samples) in the
studied material was representative (Wolińska et al., 2014). Haplic Luvisols were represented by four soil samples (4C, 7C-9C), Albic Luvisols by three samples (1C-3C), while
Brunic Arenosols by two samples (5C-6C). Mollic Gleysol and Rendzina Leptosol have also two representatives (11C-12C) and (15C-16C), respectively (Table 1). Haplic
T a b l e 1. Location of agricultural soils and description of control sites (Lublin region)
Soil
No. Type of soil (FAO) Crop type Site Geographiccoordinates Control sites
1 Albic Luvisol Oat Dęba 22º10’17.7’’ 51º26’24.6” 30 year old meadow planted with fruit trees
2 Albic Luvisol Triticale Pryszczowa Góra 22º27’10.3’’ 51º24’30.8” 20 year old woodlots with birches
3 Albic Luvisol Wheat Niemce 22º36’51.8’’ 51º21’27.0” 50 year old meadow (mowed once a year)
4 Haplic Luvisols Triticale Klementowice 22º06’54.2’’ 51º21’52.2” Unmoved meadow, wasteland
5 Brunic Arenosols Oat Łany 22º15’19.0’’ 51º23’00.9” 20 year old field-woodlots
6 Brunic Arenosols Oat Markuszów 22º15’55.5’’ 51º23’10.9” 20 year old field-woodlots
7 Haplic Luvisol Field prepared for seeding Rogalin 24º04’00.3’’ 50º51’15.8’’ Meadow (mowed once a year)
8 Haplic Luvisols Triticale Sady 23º22’52.4’’ 50º51’14.8” Unmoved meadow, wasteland
9 Haplic Luvisols Strawberries Chrząchówek 22º07’29.9’’ 51º25’50.5” Unmoved meadow, wasteland
10 Haplic Phaezoem Triticale Hostynne 50º44’48.3” 23º42’56.6’’ Meadow (mowed once a year)
11 Mollic Gleysol Colza Pożóg Nowy 22º06’18.8’’ 51º22’48.0” 30 year old pine woodlots
12 Mollic Gleysol Wheat Bałtów 22º01’25.5’’ 51º29’15.3” 70 year old meadow (mowed once a year)
13 Eutric Fluvisol Oat Kośmin 21º59’10.1’’ 51º33’47.7” 15 year old meadow (mowed once a year)
14 Eutric Histosol Oat Wólka Kątna 22º16’38.9’’ 51º25’27.3” 20 year old meadow (mowed once a year)
15 Rendzina Leptosol Celeries Siedliszcze 23º10’58.3’’ 51º12’22.3” 40 year old meadow (mowed once a year)
Phaeozem (10C), Eutric Fluvisol (13C) and Eutric Histosol (14C) were represented by single soil samples. Under labo- ratory conditions each sample was passed through a 2.0 mm sieve, to remove large pieces of rocks and plant material and stored at 4ºC prior analysis (2-3 days).
Soil pH and redox potential (Eh) were determined in a 2:1 soil suspension in distilled water using a
multifunc-tional potential meter pIONneer 65 (Radiometer Analytical
S.A., France). Soil actual moisture was determined by a gra-
vimetric method (24 h, 105°C), whereas total carbon (TC)
using an automatic carbon analyzer TOC-VCSH SSM
5000A (Shimadzu, Japan) as described by Wolińska et
al. (2014). The concentrations of soluble phosphorus (P-PO43), nitrate (N-NO3-) , nitrite (N-NO2-) and ammoni-um (N-NH4+) (were determined colorimetrically using Auto Analyser 3 System (Bran+Luebbe, Norderstedt, Germany). P-PO43was analysed with ammonium molybdate (Banach
et al., 2009). N-NH4+ and N-NO3-,were measured using, respectively, hydrazine sulphate and salicylate as a colour marker (Banach et al., 2009). N-NO2- analysis were based on the latter method excluding hydrazine sulphate. Obtained results have been expressed as µg per g of fresh soil. Each analysis was performed in triplicate.
Total DNA was isolated according to the modified pro
-cedure for soil samples as described by Tomczyk-Żak et al. (2013). In order to reduce the presence of humic sub-stances and other soil impurities the crude total DNA was
further purified by CsCl gradient centrifugation (16 h, 70 000 rpm, 20°C; Sorvall WX Ultra ThermoScietific) as
described by Sambrook et al. (1989). Two replicates of DNA extraction were made. Concentrations of the isolat-ed DNA were assessisolat-ed with NanoDrop spectrophotometer
(ThermoScientific) after 10 times dilution.
To determine bacterial taxonomic diversity in the stu- died soils, a DGGE analysis of samples was perfor- med. Dominant bacterial phylotypes were distinguished by DGGE analysis and electrophoresis performed with
a D-Code Universal Mutation Detection System (BioRad Laboratories, USA). A 1-2 µl volume (roughly 5-10 ng di-luted form) of each DNA was amplified by PCR mixture contained 5 µl of 10×buffer, 6.0 µl of 25 mM MgCl2, 1.2 µl of 20 mg ml-1 BSA, 0.4 µl of 25 mM dNTP, 0.5 µl of
20 µM in each primer, 0.2 µl of 5U µl-1 Taq DNA poly
-merase (all reagents from Sigma Aldrich Co.) and 35.2 µL
of PCR-grade water, in a total volume of 50 µl. The prim
-ers used were 341f with GC clamp (5’-GC- CC TAC GGG AGG CAG CAG-3’) complementary to position 341–357
and 907r (CCG TCA ATT CMT TTG AGT TT)
comple-mentary to positions 926-907 Escherichia coli numbering
(Muyzer et al.,1993, 1998). The PCR conditions have been
previously described in Zdanowski et al. (2013). The
sam-ples were loaded in 6% acrylamide gels with a denaturing gradient of 35-70% (where 100% denaturant is 7M urea
and 40% formamide). The same amount of DNA (40 ng) for each amplicons were loaded into the gel. The gels were
run at 60 V for 15 h at 60oC. The electrophoretic products were stained by gently agitating the gel for 30 min in 100 ml
of 1×TAE containing 5 µl 1:10,000 commercial stock dilu
-tion of SYBR Gold nucleic acid stain (Invitrogen, Life
Technologies, UK) in DMSO. DGGE banding patterns were visualized with UV transillumination and photo-graphed using the Gel Doc 2000 gel documentation system
(BioRad Laboratories, USA).
The bacterial community in each soil sample was
com-pared by using DGGE fingerprinting.DGGE gel images
were analyzed by Quantity One software in the GelDoc gel
documentation system (BioRad Laboratories, USA). Gel bands were identified using GelCompar software to cre -ate the presence-absence matrix described by Crump and
Hobbie (2005). Each band represents a bacterial OTU. The
DNA bands were identified interactively, and the position
and mass (intensity) of each band were determined. The data were used for principal-component analysis to
evalu-ate differences between the DNA profiles. Qualitative PCA
in which the presence but not the intensity of bands was used gave the best separation between different samples. The presence or absence of a band in each line was convert-ed to binary matrix to access data for statistical analysis.
Dominant (well-defined) DGGE bands were excised using a scalpel blade and incubated overnight (4°C) in ste-rile distilled water before they were re-amplified (Chong
et al., 2009). The PCR products were purified (Clean up, GenoPlastBiochemicals) and ligated into the pTZ57R/T (ThermoFisher Scientific) following instructions of the
manufacturer. The ligation products were transformed into
Escherichia coli DH5α using a InsTAclonePCR Cloning Kit (ThermoFisher Scientific) and cells were plated into
an indicator agar which consisted of lysogeny broth (LB) medium supplemented with ampiciline (100 mg ml-1),
X-Gal (0.1 mM) and IPTG (0.2 mM). White colonies of
transformants were replated into LB with ampiciline and after incubation the plasmid DNA was isolated (Plasmid
Miniprep DNA Purification Kit, Eurx). To confirm the presence of the insert, PCR with the 341f and 907r primers was performed as described earlier. Sequencing of positive
clones was carried out at by ABI3730 Genetic Analyzer
(Applied Biosystems) and then, sequences were compared
to those deposited in the GenBank nucleotide database.
Only sequences displaying 99-100% similarity are
presen-ted here.
The relative intensity data of the DNA bands from the bacterial communities were used to carry out the
fol-lowing analyses and calculations. PCA of the 16S rDNA gene band patterns was performed using the Canoco v. 4.5
statistical pack (ter Braak and Šmilauer, 2002) for Windows v. software. Microbiological data for each sample were analyzed with reference to the environmental background –
triplots along the two main axes of variation for the bacteri-al structure parameters, main environmentbacteri-al variables and sampled sites was also conducted.
The Shannon-Weaver diversity index, H’ (Shannon and Weaver, 1963) and Simpson index of dominance (D), (Simpson, 1949) were calculated from the quantity and
relative intensities of bands present in each lane accor- ding to Vivas et al. (2009). The digital image was analyzed, and the similarity cluster analyses based on Complete Linkage algorithm were generated by Quantity One
v. 4.62 (Bio-Rad) software to express the relatedness of
bacterial communities as similarity clusters. Species
rich-ness was determined as the number of bands resolved by
PCR/DGGE in 1 sample lane. The similarity between the band patterns was calculated using the Dice coefficient and
the clustering analysis was performed with the unweighted pair group method using arithmetic averages (UPGMA) for dendrogram construction using the STATISTICA version 10 (Stat-Soft) software package.
RESULTS
Land-use practices seemed to be a strong determinant
(p<0.05) of soil chemical features (Table 2). As could be
anticipated, agricultural soil exploitation was the reason T a b l e 2. Chemical and biological characteristics of cultivated (C) and non-cultivated (NC) soils (±SD)
Soil
No. Moisture (%)(w/w) (H2O)pH (mV)Eh (%)TC
N-NH4+ N-NO3- N-NO2- P-PO4 3-(μg g-1)
1C
1NC 8.20±0.20a9.76±0.11b 5.23±0.06a6.27±0.005c 477.4±0.40a435.2±0.20d 1.76±0.12d0.98±0.02a 0.01±0.006a0.09±0.006d 9.34 ±0.8a1.68±0.014d 0.11±0.003a0.17±0.001b 2.56±0.04a1.77±0.03d 2C
2NC 9.30±0.10a11.16±0.11b 4.66 ±0.02a5.02±0.02b 546.73±0.21a528.40±0.36c 1.40±0.05b1.23±0.04a 0.02±0.001a0.04±0.014b 7.37±0.05a5.84±0.03c 0.08±0.001a0.10±0.001a 1.51±0.01a1.01±0.01c 3C
3NC 10.22±0.03a9.13±0.05b 4.78±0.02a6.22±0.09d 535.7±0.30a452.86±0.11d 1.79±0.14c1.24±0.04a 0.01±0.001a0.06±0.006d 53.32±0.52a3.58±0.09d 0.05±0.005a0.42±0.005d 19.6±0.98a1.16±0.05d 4C
4NC 12.56±0.06a 13.50±0.10b 6.98±0.02a7.08±0.06a 450.03±0.32a 419.20±1.11d 2.52±0.14c1.96±0.05a 0.43±0.006a0.48±0.008b 18.25±0.06a7.57±0.32d 0.10±0.004a0.53±0.003d 12.9±0.04a5.9±0.03d 5C
5NC 6.60±0.10a8.63±0.15c 5.45±0.04a5.58±0.04b 470.20±17.75a396.13±0.23d 2.06±0.19d1.01±0.04a 0.07±0.006a0.69±0.009d 25.53±0.18a10.18±0.14d 0.12±0.001a0.21±0.002d 6.88±0.01a3.52±0.09d 6C
6NC 9.23±0.06a8.63±0.15b 4.78±0.006a5.58±0.04c 480.60±0.18a396.13±0.23d 2.06±0.19d0.83±0.09a 0.01±0.007a0.69±0.009d 20.26±0.07a10.18±0.14d 0.09±0.004a0.21±0.002d 4.01±0.01a3.52±0.09b 7C
7NC 12.13±0.15a12.76±0.11b 6.93±0.06a6.99±0.03a 403.10±3.64a400.66±0.15a 3.49±0.11d0.97±0.06a 0.05±0.001a0.41±0.008d 14.48±0.04a5.41±0.14d 0.04±0.005a0.87±0.003d 4.61±0.01a3.85±0.03d 8C
8NC 19.00±0.17a20.26±0.63c 5.96±0.12a6.06±0.01a 461.10±0.17a409.23±0.25c 2.68±0.07d0.96±0.11a 0.36±0.02a2.61±0.04d 17.35±0.03a11.07±0.05d 0.12±0.002a0.24±0.02c 6.81±0.02a2.94±0.03d 9C
9NC 5.66±0.11a7.10±0.17d 5.13±0.006a5.40±0.006b 480.73±0.93a487.23±0.25b 1.42±0.11c0.88±0.06a 0.19±0.009a0.18±0.001a 4.96±0.06a1.76±0.06d 0.14±0.001a0.80±0.002d 13.9±0.24a7.52±0.02d 10C
10NC 24.66±0.28a31.03±0.23d 6.61±0.05a7.22±0.02c 561.30±0.36a529.26±0.23c 5.43±0.14d1.64±0.03a 0.02±0.001a0.02±0.002a 27.43±0.08a8.23±0.02d 0.09±0.003a 0.44±0.006d 1.36±0.05a1.35±0.02a 11C
11NC 12.96±0.28a14.33±0.57c 6.73±0.006a6.76±0.01a 556.10±0.30a537.96±0.25c 3.15±0.29d1.18±0.02a 0.41±0.04a0.78±0.01c 10.11±0.07a10.06±0.09b 0.13±0.004a0.15±0.001b 5.77±0.13a1.09±0.02d 12C
12NC 5.80±0.17a10.40±0.17d 4.74±0.02a6.25±0.03d 559.36±0.32a542.90±2.95b 1.80±0.13d0.91±0.05a 0.03±0.004a4.94±0.08d 21.90±0.02a6.75±0.05d 0.09±0.001a0.10±0.001a 2.04±0.03a1.68±0.008c 13C
13NC 5.20±0.17a8.86±0.11d 4.18±0.05a5.64±0.06d 551.30±0.30a545.20±0.40a 1.23±0.08c0.98±0.07a 0.14±0.04a0.27±0.03c 2.99±0.03a2.20±0.05c 0.09±0.001a0.13±0.002b 2.64±0.09a1.33±0.008d 14C
14NC 6.50±0.10a9.30±0.20d 4.85±0.03a5.27±0.01c 523.43±0.23a519.96±0.25a 3.63±0.14d2.69±0.19a 0.01±0.001a0.02±0.002a 10.22±0.12a 9.05±0.03c 0.08±0.002a0.09±0.001a 3.09±0.10a 1.74±0.38d 15C
15NC 10.86±0.11a12.50±0.17c 5.58±0.06a5.76±0.01b 503.90±0.20a 493.80±0.20b 1.59±0.12d0.97±0.06a 0.05±0.01a3.39±0.06d 77.17±0.14a10.12±0.07d 0.08±0.007a 0.09±0.004a 6.83±0.19a0.60±0.007d 16C
of decrease of soil moisture, pH, TC, N-NH4+, N-NO2-. Among investigated factors Eh, N-NO3- and P-PO43- dis-played higher values in C than in NC soils.
Generally, pH of majority of cultivatede soils was in
the acidic range (4.66-5.96), whereas pH values close to neutral (6.73-6.98) were noted only in relation to four
representatives of C soils (Table 2). In each experiment variant, the pH values of control soils were higher than those in cultivated soils. Cultivated soils were also
charac-terized by lower moisture content (5.2-24.7%) than control
soils (7.1-31.03%). Likewise, TC content was lowered in C
variant (0.8-2.7%) in comparison to NC soils (1.4-5.8%).
Dominant form of nitrogen was N-NO3-, which in C va- riant was remarkably higher than in NC ranged from 2.99
to 77.17, and 1.68-13.82 μg g-1 d.m, respectively. The
sec-ond most abundant form of nitrogen in terms of quantity
was N-NH4+ with the amount of 0.01-0.43 μg g-1 d.m. in
relation to C soils and 0.02-4.94 μg g-1 d.m. in the NC soils. The least representative form of nitrogen was N-NO2-, at
relatively low concentrations of 0.04-0.14 and 0.09-0.87 μg
g-1 d.m. in C and NC soils, respectively.
To confirm taxonomic diversity in studied samples,
a DGGE analysis was performed. This allowed for the use of CCA to determine differences, but also to assess the impact of the factors determining diversity.
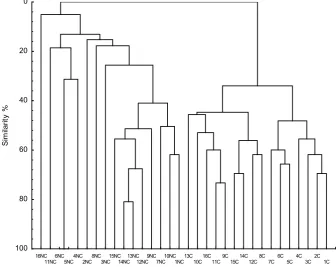
Cluster analysis of DGGE profiles of C and NC soils
by UPGMA demonstrated the separation of bacterial com-munities between cultivated and control soils bacterial communities (Fig. 1, Table 3). Generally larger numbers
of OTUs (65) in NC soils were noted compared to C soils
(47 OTUs). This implies that in C samples subjected to agricultural treatments the number of dominant OTUs is lower by nearly 30% with reference to non-cultivated sites. Among cultivated soils the smallest number of OTUs (17) was noted in Albic Luvisols under oat crop type (1C), whereas the largest (28 OTUs) in Haplic Luvisols under strawberries (9C) was estimated. Control sites characterized by the largest numbers of OTUs were as follows: Mollic Gleysol under 30 year old pine woods (11NC) and Haplic Luvisol under 20 years old meadow mowed once a year
(14NC), where 30 OTUs were found. Rendzina Leptosol under old meadow mowed once a year (16NC) was
cha-racterized by 29 OTUs.In contrast, the lowest number of
OTUs (15) was noted in Haplic Luvisol under 15 years
old meadow (13NC) and in Haplic Luvisol (9NC). When comparing C and NC sites it was noticed that agricultu- rally exploited Albic Luvisols (1C) had the same numbers of OTUs (17) as its control (1NC). The same number of OTUs (18) also appeared in Mollic Gleysol (12C, 12NC). Among Haplic Luvisols, which were the most widely rep-resented (4 soil samples), OTU numbers ranged from 18 to
28 in arable soils, and from 15 to 30 in controls. However,
the sheer number of OTUs do not necessary imply about soil
biodiversity, as arable soils were also classified by increas -ing diversity (Table 3), expressed as Shannon-Weaver
index (H’), Simpson index of diversity(D) and dominance
index (1/D). Presented comparative biodiversity along
a gradient of cultivated soils clearly demonstrated that higher biodiversity (H’=1.60) was found in soils (1C, 4C,
5C, 8C, 12C, 14C) with low OTUs (17-18), whilst lower
16NC
11NC6NC5NC4NC2NC8NC3NC15NC14NC13NC12NC9NC7NC10NC1NC13C10C16C11C9C15C14C12C8C7C6C5C4C3C2C1C
100 80 60 40 20 0
Sim
ilarit
y
%
biodiversity (H’ from 1.34 to 1.38) have been indicated
in those (9C, 16C) with the highest OTUs number
(25-28). General diversity of all studied soil samples based on DGGE patterns is shown in Tables 3 and 4.
From DGGE patterns evaluated by Shannon-Weaver index we deduce a slightly higher microbial diversity in
cultivated soils (H’=5.10) than in non-cultivated (H’=4.87). However, Simpson index of dominance (1/D) suggests that
cultivated soils contained more specifically dominant com
-munities (18.87-21.69) compared to non-cultivated soils
where phylotype richness was lowered (18.84-20.41). Simpson index computed on the entire C and NC samples reached higher level in cultivated (0.82) than in control
samples (0.30), which confirms reduced biodiversity in ara -ble soils. This phenomenon is also highlighted by Simpson
index of dominance (1/D) calculated for all DGGE tracks,
describing the number of species which in arable soils amounted 1.22±0.48 whereas in controls was nearly
three-fold higher reaching 3.38±0.05 (Table 4).
Dominant DGGE bands were cloned and sequenced. Representative sequences displayed 99-100% similarity with NCBI database as presented in Table 5 and Table 6,
for C and NC soils, respectively. Selective DGGE bands were shared among C and NC sites, for example uncul-tured Firmicutes bacterium clones and uncultured
Acidobacteria bacterium clones. However, in most cases T a b l e 3. Comparative biodiversity along a gradient of cultivated soils
Soil type cultivated
Non-soils H’ D 1/D S
Cultivated
soils H’ D 1/D S
Haplic Luvisols 9 1.47 0.049 20.41 15 9 1.34 0.045 22.39 28
Rendzina Leptosol 16 1.56 0.052 19.18 29 16 1.38 0.046 21.69 27
Eutric Fluvisol 13 1.47 0.049 20.41 15 13 1.42 0.047 21.09 26
Haplic Phaezoem 10 1.52 0.051 19.69 17 10 1.46 0.049 20.57 25
Mollic Gleysol 11 1.55 0.052 19.36 30 11 1.46 0.049 20.57 25
Brunic Arenosols 6 1.58 0.052 19.05 20 6 1.52 0.051 19.75 23
Albic Luvisols 2 1.60 0.053 18.76 26 2 1.56 0.052 19.19 21
Albic Luvisols 3 1.59 0.053 18.84 22 3 1.59 0.053 18.87 19
Haplic Luvisols 7 1.50 0.050 20.02 16 7 1.59 0.053 18.87 19
Rendzina Leptosol 15 1.58 0.052 19.05 20 15 1.59 0.053 18.87 19
Albic Luvisols 1 1.52 0.051 19.69 17 1 1.60 0.053 18.78 17
Brunic Arenosols 5 1.58 0.052 19.05 20 5 1.60 0.053 18.79 18
Eutric Histosol 14 1.50 0.050 20.02 16 14 1.60 0.053 18.78 17
Haplic Luvisols 8 1.59 0.053 18.85 26 8 1.60 0.053 18.79 18
Haplic Luvisols 4 1.55 0.052 19.36 30 4 1.60 0.053 18.79 18
Mollic Gleysol 12 1.54 0.051 19.43 18 12 1.60 0.053 18.79 18
H’– Shannon-Weaver index of general diversity, D – Simpson index of diversity, 1/D – Simpson index of dominance, and S – number of bands for DGGE profiles.
T a b l e 4. General diversity of studied soil samples based on DGGE banding patterns
Way of land use H’ D 1/D
Non-cultivated (NC) 4.87±0.03a* 0.30±0.001a 3.38±0.05a
Cultivated (C) 5.10±0.04c 0.82±0.03d 1.22±0.4d
we noted differences between C and NC microbial
com-munities composition. In agricultural soils (Table 5)
uncultured representatives belonging to Myxococcales,
Mucilaginibacter sp. L356 and Mucilaginibacter sp.
UR6-11 were detected with 100% sequence similarity
to the NCBI database. Others, displaying 99% simila- rity were mostly represented by uncultured clones of
Bradyrhizobium sp., Xanthomonadaceae,
Gammaproteo-bacteria, Sphingomonas sp., Myxococcales, Rhodanobacter
sp., Mucilaginibacter sp. and Arthrobacter sp. With respect to control soils, 100% similarity with NCBI database was found in uncultured representatives of Acidobacteriaceae
and Firmicutes bacterium clones (Table 6). Similarly, with 99% sequence similarity presence of uncultured
Hyphomicrobiaceae, Gemmatimonadetes, Caulobacterales
and Alphaproteobacterium bacterium clones were detec- T a b l e 5. Selected species of clones obtained by PCR-DGGE in cultivated (C) soils with reference sequences in the NCBI database
Soil type (FAO) Soil No.
Closest match from GenBank
Match Sequence similarity by BLAST (%) GenBank accession No.
Albic Luvisol 1-3C Uncultured Bradyrhizobium sp. clone C.la-18 99% JX504902.1
Phenylobacterium sp. C16-Siri106 99% JX500270.1
Haplic Luvisol 4P, 7-9 C
Uncultured Xanthomonadaceae bacterium clone
GASP-MB2W2_B04 99% EF665380.1
Uncultured Firmicutes bacterium clone
GASP-MB3W1_G09 99% EF662389.1
Arthrobacter sp. PG21 99% KU350608.1
Brunic Arenosol 5-6C
Uncultured Xanthomonadaceae bacterium clone
GASP-MA1S2_A03 99% EF665874.1
Sphingomonas sp. C0503 99% JX096995.1
Haplic Phaeozem 10C Uncultured GASP-MB2W2_D09Sphingobacteriales bacterium clone 99% EF665405.1
Mollic Gleysol 11-12PC
Uncultured Myxococcales bacterium clone
Plot4-2B08 100% EU449592.1
Mucilaginibacter sp. L356 100% KR181805.1
Uncultured Acidobacteriales bacterium clone
E2006TS6.39 99% GU983355.1
Rhodanobacter sp. T2-YC6778 99% GQ369046.1
Eutric Fluvisol 13C
Rhodanobacter sp. GR14-4 99% KF441592.1
Rhodanobacter sp. A2-61 99% FJ821729.1
Uncultured Gammaproteobacteria clone
GC0AA3ZG11PP1 99% JQ919685.1
Mucilaginibacter sp. UR6-11 100% KF900219.1
Eutric Histosol 14C
Uncultured bacterium clone WW1_a33 100% GQ264172.1
Uncultured bacterium clone Hswb-15 100% GU113036.1
Uncultured Gammaproteobacteria clone
GC0AA4ZE09PP1 99% JQ919693.1
Rendzina
T a b l e 6. Selected species of clones obtained by PCR-DGGE in control (NC) soils with reference sequences in the NCBI database
Soil type (FAO) Soil No.
Closest match from GenBank
Match Sequence similarityby BLAST (%) GenBank accessionNo.
Albic Luvisol 1-3NC
Uncultured Firmicutes bacterium clone
GASP-MB2S2_C02 99% EF665117.1
Uncultured Hyphomicrobiaceae
bacterium clone Elev_16S_1585 99% EF020154.1
Uncultured Acidobacteria bacterium
clone AEW_08_408 99% HQ598261.1
Haplic Luvisol 4NC, 7-9NC
Uncultured Acidobacteriaceae bacterium
clone CK-113 100% KM200541.1
Uncultured Firmicutes bacterium clone
GASP-MA1W2_D03 100% EF662688.1
Uncultured Hyphomicrobiaceae
bacterium clone Elev_16S_1697 99% EF020212.1
Brunic Arenosol 5-6NC
Uncultured Firmicutes bacterium clone
GASP-MB2S1_B06 100% EF665018.1
Uncultured Caulobacterales bacterium
clone Plot4-G04 99% EU449571.1
Uncultured Rhodoplanes sp. partial 16S
rRNA gene, clone7B_09 99% HE861294.1
Uncultured Hyphomicrobiaceae
bacterium clone Amb_16S_918 99% EF018637.1
Haplic Phaeozem 10NC
Uncultured bacterium clone FCPO743 99% EF516120.1
Uncultured Hyphomicrobiaceae
bacterium clone Amb_16S_1248 99% EF018785.1
Mollic Gleysol 11-12NC
Uncultured Rhodoplanes sp. clone
GASP-MA1W1_B04 99% EF662607.1
Uncultured bacterium isolate DGGE gel
band JHH-D7-1A-c35 99% HM148942.1
Eutric Fluvisol 13NC Mesorhizobium sp. AM20-87 99% KP899163.1
Uncultured bacterium clone FCPO696 99% EF516451.1
Eutric Histosol 14NC
Uncultured forest soil bacterium clone
DUNssu184 100% AY913390.1
Uncultured forest soil bacterium clone
DUNssu053 99% AY913275.1
Rendzina Leptosol 15-16NC
Uncultured Alphaproteobacterium clone
GASP-WC1S3_B03 99% EF074556.1
Uncultured Alphaproteobacterium clone
ted. Furthermore, in NC soils uncultured Rhodoplanes sp.,
Mesorhizobium sp. and forest soil bacterium clones were
also identified.
Effect of agricultural practices on soil biodiversity reduction was also determined by performing the principal component analysis. DGGE profiles revealed clear
diffe-rences in microbial diversity of the soil samples(Fig. 2).
Cultivated soil samples demonstrated increased affinity to
each other by forming a clear cluster, in contrast to controls
where samples (3NC, 4NC, 6NC, 11NC) differed from
samples in other positions. Principal component analysis also pointed to a greater similarity of C soils within the group with less resemblance to NC sites.
Chemical factors effect on investigated soil types (C and NC) based on DGGE patterns are presented in Fig. 3. The correspondence analysis has shown that the overall varia- bility index (Total Inertia) makes it possible to apply the
linear fit. The PCA analysis revealed a significant variabil -ity in the samples. This highlights the need for conducting further analyses in the CCA system relative to the back-ground. Our results suggest that Eh and N-NO3- are the critical factors controlling microbial communities in arable soils, particularly with regards to Haplic Luvisols (4C,
9C), Mollic Gleysols (11C, 12C) and Rendzina Leptosol (15C). Microbial community from control sites grouped in the right bottom quadrant (1NC, 4NC, 7NC, 8NC, 10NC, 14NC, 16NC) depended on soil moisture and TC content.
On the other hand, biogenic forms of phosphorus (P-PO43), nitrogen (N-NO2-, N-NH4+) and pH, affecting microbial community from non-cultivated soils, clustered in the top
right quadrant (3NC, 11NC, 12NC). The Monte Carlo
Permutation test revealed that moisture, TC and pH were the three important factors responsible for effects at a
sta-tistically significant level.
DISCUSSION
The fact that soil agricultural treatments strongly mo- dify soil chemical parameters was reported by Girvan et al. (2003), Lopes et al. (2011) and Wolińska et al. (2014). Also decline of pH toward acidic conditions as an effect of agricultural practices and depletion of TC in arable soils was earlier indicated (Bossio et al., 2005; Wolińska et al., 2014). These observations are consistent with results pre-sented in the current study, where decrease of pH and TC content was noted in C soils. It was stated that vegetation
type and carbon concentration may influence microbial
community composition at local scales, whereas soil pH is a better predictor of a community structure at the
continen-tal scale (Fierer and Jackson, 2006). Observed increase in
Eh in C soils was linked to the fact that agricultural prac-tices, such as ploughing, contribute favourably to oxygen enhancement in the soil surface, whereas growth of N-NO3 -and P-PO43- may be caused by systematically fertilization practices in arable soils. Domination of nitrate nitrogen in
agricultural soils especially during the spring season can be explained by agricultural practices such as fertilization, and high soil temperature that stimulate aerobic N
transforma-tion, resulting in the nitrification of of N-NH4+ (Campos, 2010). Furthermore, one extremely important observation seems to be the marked reduction of N-NO2- concentration in all cultivated soil which suggests that microbiological processes associated with nitrogen compounds in cultivated soils may prevent the accumulation of N-NO2-. Similarly, a decrease in N-NH4+ noted in cultivated soils might
sug-gest on intensive nitrification processes in C soils. It should
be mentioned that we collected the soil material prior to
-1.0 1.5
-1.
0
2.0
1NC 2NC 3NC 4NC
6NC
7NC 8NC
9NC 10NC 11NC
12NC 13NC
14NC 15NC
16NC 1C
2C
3C
4C5C
6P 7C
8C 9C10C
11C 12C
13C 14C 15C
16C
79.5%
20%
Fig. 2. Principal components analysis (PCA) of DGGE band patterns. Numbers beside the symbols indicate the soil samples number, circle – non-cultivated soils (NC), triangles – cultivated soils (C).
fertilizer application. Thus, noted concentration range for N–NH4+ resulted from its pool that remained in the soil after winter time.Our data are consistent with the findings
of Avrahami et al. (2003) who observed that even after the direct fertilization of soil with N-NH4+ a decrease of ammo-nium and increase in nitrate concentrations occurred. This phenomenon was favoured by intermediate air tempera-tures, i.e. 15-25°C, whereas during soil sampling in spring 2014 the air temperature was in the range of 20-22°C.
An impact of land management practices on bacterial diversity structure still remains unrecognised. It has been suggested that agriculture creates highly selective and homogeneous environments that reduce bacterial diversity, particularly Rhizobium populations (Palmer and Young, 2000). Some studies were performed in order to report on the differences in microbial diversity between soils under conventional and organic farming systems (Bossio et al.,
2005; Kuffner et al., 2004; Lopes et al., 2011). In that
context, the present study is the first one that compared
the bacterial community in cultivated and non-cultivated Polish soils, represented by seven types and sixteen soil units. We found that, differentiation between cultivated and non-cultivated soils on the level of chemical features
is clearly a consequence of different soil management prac
-tices and this was also the reason for the diversification
in the microbial community structure. In our study land-use management seemed to be a major determinant of the bacterial communities, because more than the soil type it determined the clustering into groups (Fig. 1) and showed clear differences in microbial composition between C and
NC sites (Tables 5 and 6). This dependency is well shown
based on uncultured Hyphomicrobiaceae bacterium clones whose presence (99-100% similarity) has been demonstrat-ed in Albic Luvisols, Haplic Luvisols, Brunic Arenosols and Haplic Phaeozem (Table 6). Also, representatives of
Xanthomonadaceae bacterium clones were common across Albic Luvisols and Brunic Arenosols(Table 5). In contrast,
Gammaproteobacteria were noted both in Eutric Histosol
and Eutric Fluvisols (Table 5). Similarly, the presence of
Rhodanobacter sp. was stated both in Mollic Gleysol and Eutric Fluvisol,whereas Mucilinibacter sp. were common
across Eutric Histosol and Mollic Gleysol (Table 5).Bossio
et al. (2005) confirmed that different management practices
affected both microbial community composition and func-tion. In contrast, Girvan et al. (2003) suggested that it is likely that the total bacterial community compositions have been determined primarily by the underlying soil chemistry and structure rather than by the different management prac-tices or cropping regimens at these sites. Additionally, soil has been shown to have an immense capacity for diversity and therefore a large buffering capacity before the results of management practices will likely affect the dominant members of the community (Girvan et al., 2003). In any
case, it should be emphasized that the longer-term impacts
of management practices may be much more significant,
than what was shown in the current study.
The analysis of DGGE profiles based on the diver
-sity of 16S rRNA bacterial gene clearly demonstrated two separate clusters for C and NC soils. These findings are also confirmed by Shannon-Weaver index of
gene-al diversity (H’), Simpson index of diversity (D) and
Simpson index of dominance (1/D). This diversity indices
clearly point to biodiversity loss in a systematical and long- term exploited arable soils, regardless of the soil type. Speci-
fically, this fact has been the most strongly
highligh-ted by Simpson index of dominance, where its value point-
ed for NC sites threefold exceeding the 1/D level estimat
-ed in C soils by a factor of 3. Lopes et al. (2011) reported Shannon-Weaver index for cultivated paddy Portugal soils
under conventional system on the level of 1.26, meanwhile in our study H’ achieved values of 1.34-1.60 and 1.47-1.560,
for cultiated and control soils, respectively. Shao-Qiang et al. (2012) indicated that in Chinese alluvial soil under rice-wheat cropping system the highest genetic biodiversity
(H’=3.061) characterized fertilized soils, while the poorest
biodiversity (H’=2.692) was found in control (non fertil
-ized) soils. These results suggest that investigated soils from the Lublin region have higher biodiversity than paddy soils from Portugal but lower than alluvial China soils.
PCA analysis also indicated a clustering among the C soils that were associated with soil cultivation and NC
soils under any cultivation system for 15-30 years. This might indirectly confirm the impact of agricultural man -agement on the bacterial communities in the soils. Apart from human agricultural management, soil microbial com-munity is dependent on chemical features of the site. Our study demonstrated that moisture, TC and pH affected on microbial community in control soils, while Eh and N-NO3-
influenced microorganisms in cultivated soils. It is worth
mentioning that moisture in control sites was by 20-30% higher than in agricultural soils. TC in NC variant reached on average 70% higher level than in C soils, whereas pH in controls was close to neutral in contrast to acidic conditions noted in arable soils. All these factors are important for microbial activities. Similarly, changes in soil moisture sta-tus is known to affect the magnitude of biological activities, because many soil microorganisms are known to be intole-
rant of low moisture content (Wolińska et al., 2015). The
next important, environmental factor, expressing the ten-dency of an environment to receive or to supply electrons in solution is The well-oxygenated soils are characterized by
high values of Eh (600-800 mV), in quite well-oxygenated soils Eh ~ 500-600 mV, whereas in anaerobic conditions
a decline in Eh below 300 mV or even to lower values was
observed (Pett-Ridge and Firestone, 2005; Wolińska et
al., 2014). It is well known, that Eh plays a crucial role in regulating microbial activity as well as community
investigated in the current study, Eh strongly influenced on
microbial community in C soils (Fig. 3), where it amounted from 403 to 561 mV, whereas reached lower values
(396-545 mV) in NC variant (Table 2). Also amounts of NO3-N
and PO4-P were higher in agricultural soils, which resulted
from systematically fertilization of C sites (at least from 25
years, since 1991) and affected on microbial community in arable soils. In our study, limitation of water, lower content of TC, higher level of Eh and NO3-N concentrations and acidic pH noted in arable soils seemed to be the important factors responsible for the clear differences between the C and NC soil samples, with regard to dominant OTUs. This knowledge can be instructive for the optimal land-use ma- nagement practices and enhance sustainable agriculture.
CONCLUSIONS
1. The biodiversity of microbial communities is diffe-rent in the areas under cultivation than in non-cultivated soils.
2. Human agricultural activity and soil chemical para- meters are important, selective factors for bacterial selec-tion in arable soils.
3. Larger numbers of operational taxonomic units were found in control soils compared to agricultural soils, which indicates an almost 30% reduction in dominant bac-terial operational taxonomic units. These is additionally
confirmed by Simpson dominance index of 1.22, express
-ing the ‘abundance weighted true diversity’, whereas in the
controls this index reached 3.38 which is by almost a factor of 3 higher.
4. Agricultural soil usage is the factor crucial for biodi-versity structure
5. The most important key chemical factors associated
with microbial community compositions turn out to be soil moisture, pH, TC, Eh N-NO3- and P-PO43-, but, their impact depended on the land-use management practices.
6. In cultivated soils the most critical for microbial com -munity factors are Eh and NO3-N, whereas moisture, pH, TC and P-PO43-seemed important in non-cultivated sites.
ACKNOWLEDGEMENTS
The Authors are also grateful to our technical assistant
Andrzej Górski for his contribution to the field trips and
to Marek Pazur from the Institute of Agrophysics Polish Academy of Sciences in Lublin (Poland) for his help in pre-cise location of soil sampling sites. The Authors are also grateful to Dr P. Misztal (University of California Berkeley, USA) for suggestions resulting in language improvement.
Conflict of interest: The Authors do not declare
con-flict of interest.
REFERENCES
Arias M.E., Gonzales-Perez J.A., Gonzales-Vila F.J., and Ball A.S., 2005. Soil health-a new challenge for microbiologists and chemists. Int. Microbiol., 8, 13-21.
Avrahami S., Liesack W., and Conrad R., 2003. Effects of tem-perature and fertilizer on activity and community structure of soil ammonia oxidizers. Environ. Microbiol., 5, 691-705.
Banach A.M., Banach K., Visser E.J.W., Stępniewska Z., Smits A.J.M., Roelofs J.G.M., and Lamers L.P.M., 2009. Effects of summer flooding on floodplain biogeochemistry in Poland; implications for increased flooding frequency. Biogeochemistry, 92, 247-262.
Bieganowski A., Witkowska-Walczak B., Gliński J., Sokołowska Z., Sławiński C., Brzezińska M., and Włodarczyk T., 2013. Database of Polish arable mineral soils: a review. Int. Agrophys., 27, 335-350.
Bossio D.A., Girvan M.S., Verchot L., Bullimore J., Borelli T., Albrecht A., Scow K.M., Ball A.S., Pretty J.N., and Osborn A.M., 2005. Soil microbial community response to land use change in an agricultural landscape of western Kenya. Microb. Ecol., 49, 50-62.
Campos A., 2010. Response of soil inorganic nitrogen to land use and topographic position in the Cofre de Perote Vulcano (Mexico). Environ. Manag., 46, 213-224.
Casamayor E.O., Schafer H., Baneras L., Pedros-Alio C., and Muyzer G., 2000. Identification of and spatio-temporal dif-ferences between microbial assemblages from two neigh- bouring sulphurous lakes: comparison by microscopy and denaturing gradient gel electrophoresis. Appl. Environ. Microbiol., 66, 499-508.
Chong C.W., Tan A.G.Y., Wong R.C.S., Riddle M.J., and Tan I.K.P., 2009. DGGE fingerprinting of bacteria in soils from eight ecologically different sites around Casey Station, Antarctica. Polar. Biol., 32, 853-860.
Crump B.C. and Hobbie J.E., 2005. Synchrony and seasonality in bacterioplankton communities of two temperate rivers. Limnol. Oceanogr., 50, 1718-1729.
Fierer N. and Jackson R.B., 2006. The diversity and biogeogra-phy of soil bacterial communities. Proc. Nat. Acad. Sci., 103, 626-631.
Girvan M.S., Bullimore J., Pretty J.N., Osborn A.M., and Ball A.S., 2003. Soil type is the primary determinant of the com-position of the total and active bacterial communities in arable soils. Appl. Environ. Microbiol., 69, 1800-1809. Gliński J., Ostrowski J., Stępniewska Z., and Stępniewski W.,
1991. Soil samples bank representing mineral soils of Poland (in Polish). Prob.Agrophys., 66, 5-57.
Kuffner M., Pinar G., Hace K., Handschur M., and Haslberger A.G., 2004. DGGE-fingerprinting of arable soils shows dif-ferences in microbial community structure of conventional and organic farming systems. Food, Agric. Environ., 2, 259-267.
Lozupone C.A., Hamady M., Kelley S.T., and Knight R., 2007. Qualitative and quantitative β diversity measures lead to different insight into factors that structure microbial com-munities. Appl. Environ. Microbiol., 73, 1576-1585. Muyzer G., Brinkhoff T., Nüel U., Santegoeds C., Schäfer H.,
and Waver C., 1998. Denaturing gradient gel electrophore-sis (DGGE) in microbial ecology. In: Molecular Microbial Ecology Manual (Eds A.D.L. Akkermans, J.D. van Elsas and F.J. de Bruijn). Kluwer Academic Publ., Dordrecht, the Netherlands.
Muyzer G., de Waal D.C., and Uitterlinden A.G., 1993. Profiling of complex microbial populations by denaturing gradient gel electrophoresis analysis of polymerase chain reaction-amplified genes coding for 16S rRNA. Appl. Environ. Microbiol., 59, 695-700.
Palmer K.M. and Young J.P.W., 2000. Higher diversity of Rhizobium leguminosarum biovar viciae populations in arable soils than in grass soils. Appl. Environ. Microbiol., 66, 2445-2450.
Petersen D.G. and Dahllöf I., 2005. Improvements for compara-tive analysis of changes in diversity of microbial commu- nities using internal standards in PCR-DGGE. FEMS Microbiol. Ecol., 53, 339-348.
Pett-Ridge J. and Firestone M., 2005. Redox fluctuation struc-tures microbial communities in a wet-tropical soil. Appl. Environ. Microbiol., 71, 6998-7007.
Sambrook J., Fritsch E.F., and Maniatis T., 1989. Molecular cloning: a laboratory manual. Cold Spring Harbor Labora- tory, Cold Spring Harbor, NY.
Shannon C.E. and Weaver W., 1963. The Mathematical Theory of Communication. University of Illinois Press, Urbana, IL, USA.
Shao-Qiang T., Qiang X., Zhu, L., Chen J.J., Wang Y.N., and Qin B., 2012. Analysis of the bacterial communities in lime concretion black soil upon the incorporation of crop resi-dues. Open J. Soil Sci., 9, 312-319.
Simpson E.H., 1949. Measurement of diversity. Nature, 163, 688-688.
terBraak C.J.F. and Šmilauer P., 2002. CANOCO reference manual and CanoDraw for Windows user’s guide: software for canonical community ordination (version 4.5). Micro- computer Power, Ithaca.
Tomczyk-Żak K., Kaczanowski S., Drewniak Ł., Dmoch Ł., Skłodowska A., and Zielenkiewicz U., 2013. Bacteria diversity and arsenic mobilization in rock biofilm from an ancient gold and arsenic mine. Sci. Tot. Environ., 461, 330-340.
Torsvik T., Daae F.L., Sandaa R.A., and Ovreas L., 1998. Novel techniques for analysing microbial diversity in natu-ral and perturbed environments. J. Biotech., 64, 53-62. Vivas A., Moreno B., Garcia-Rodriguez S., and Benitez E.,
2009. Assessing the impact of composting and vermicom-posting on bacterial community size and structure, and microbial functional diversity of an olive-mill waste. Biores. Technol., 100, 1319-1326.
Wolińska A., Szafranek-Nakonieczna A., Banach A., Rekosz-Burlaga H., Goryluk-Salmonowicz A., Błaszczyk M., Stępniewska Z., and Górski A., 2014. Biological degrada-tion of arable soils from Lublin region (SE Poland). Int. J. Curr. Microbiol. Appl. Sci., 3, 558-571.
Wolińska A., Stępniewska Z., and Pytlak A., 2015. The effect of environmental factors on total soil DNA content and dehy-drogenase activity. Arch. Biol. Sci., 67, 493-501.