DOI: 10.21608/EJSS.2017.1526
©2017 Nathional Information and Documentaion Center (NIDOC)
Introduction
Salt affected soils occur commonly in arid and semi-arid regions and characterized by excessively high levels of water- soluble salts. In most cases, sodium chloride is a major salt contaminant in such soils, it has a small molecule size and when oxidized by water, produces Na+ and Cl- ions, which are
easily absorbed by the root cells of higher plants and transferred to the whole plant causing ionic and osmotic stresses at the cellular level of such plants, (Rodriguez-Navarro and Rubio, 2006).
Salt toxicity is one of the major factors limiting crop production and environmental quality in saline and/or sodic soils. Excessive
amounts of salts adversely affect the physical and chemical properties of soil, microbiological processes and plant growth (Ramoliya and Pandey, 2003 and Pitman & Läuchli, 2004).
Biochar is the carbonaceous residue left in the pyrolysis process. Several studies have
highlighted its benefit for mitigation of global
climate change and as an effective strategy to manage soil quality and crop productivity (Renard
et al., 2012). Amending soil with biochar has increasingly attracted widespread attention for its chemical stability, ideally suited for sequestrating C in soil, rapidly increases soil fertility and plant growth by supplying and retaining
T
WO FIELD experiments were conducted in El-Tina Plain area, North Sinai, Egypt, to study the effect of biochar and humic acids as nontraditional soil conditioners on some properties of sandy soil as well as the productivity of wheat and corn plants grown on such soil. The two conditioners were applied individually with three rates. The application rates of biochar were 5, 10 and 20 ton/fed., while the respective rates of humic acids were 5, 10 and 20 kg/fed.Results of the present study revealed that the application of all the studied treatments decreased soil bulk density, hydraulic conductivity, pH, EC, soluble Na, SAR and ESP values, while increased cation exchange capacity, organic matter content, total N as well as available amounts of P, K, Fe, Mn, Zn and Cu in soil.
Data also indicated that all the treatments significantly increased the grain yields of wheat and corn plants and the treatment (20 kg humic acids/fed.) was the best one. The rate of increment over the control due to such treatment reached 39.49 and 37.68 % for wheat and corn grain yields, respectively. Also, macro and micronutrient concentrations of such grains were significantly increased by increasing the application rates of the applied conditioners.
Based on results of the current study, it can be concluded that using biochar and humic acids as organic conditioners is helpful to improve soil properties, compensate the deficiency of nutrients in soil and have significant effects on the productivity of wheat and corn plants. These materials are easily producible, biodegradable, less expensive, cause no environmental hazards to human health and will be ecologically safe and culturally more acceptable among farmers. So, it can be recommended to use such materials as soil conditioners under salt affected soil conditions.
Keywords: Biochar, Humic acids, Salt affected soils, Corn yield, Wheat, Macro and micronutrients.
9
Effect of Using Some Soil Conditioners on Salt Affected Soil
Properties and Its Productivity at El-Tina Plain Area, North Sinai,
Egypt
A. A. Mousa
nutrients while simultaneously improving the physical and biological properties of the soil (Woolf et al., 2010 and Uzoma et al., 2011).
Humic acids is produced by the chemical and biological decomposition of organic mate-rial. It is an important constituent of soil organic matter which enhances the growth and yield of crops and improves soil physical and chemical characteristics, (Hafez, 2003; Abd El- Al et al., 2005 and Khan et al., 2012). It is particularly used to ameliorate or reduce the negative effects of salt stress. Humic acids contributes to plant growth through its effect not only on the physical and chemical but also on biological properties of the soil. It is mainly a nutritional function, as it serves as a source of N, P, and cations for plant growth (Arancon et al., 2006).
Several studies have reported the ability of humic acids to increase the growth of different plant species grown under adverse conditions. Some authors suggested that humic acids promote plant growth by improving the bioavailability of certain nutrients, mainly iron and zinc. Others
proposed that humic acids can directly influence
the plant metabolism by both activating the root plasma membrane ATPase activity and increasing the nitrate uptake rates in roots (Nardi et al., 2002; Chen et al., 2004a,b and Mora et al., 2010 ).
The aim of this study is to evaluate the efficiency
of using those nontraditional soil conditioners,
i. e., biochar and humic acids for improving some properties of salt affected soil as well as raising its productivity of wheat and corn yields.
Materials and Methods
Two field experiments were conducted in
El-Tina Plain, North Sinai, Egypt, to evaluate
the efficiency of using biochar and humic
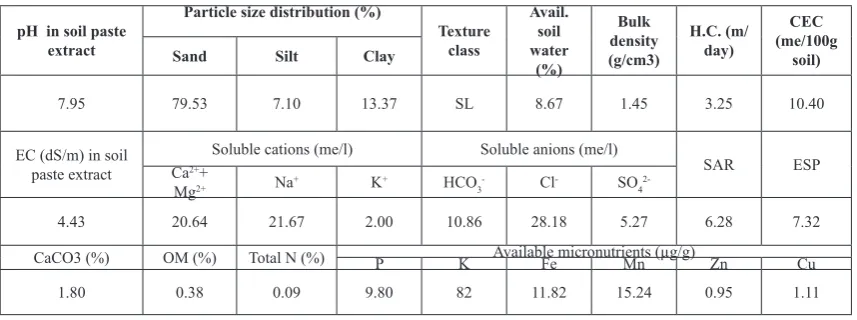
acids for improving some properties of salt affected soil as well as raising its productivity of wheat and corn yields. Composite samples representing soil, in which the experiment was carried out, were taken and prepared to determine some properties of such soil (Table 1).
The experimental design was randomized complete block design with three replicates and the experimental treatments were as follows:
TABLE 2. Some properties of the applied soil conditioners
Parameters pH (dS/m)EC (%)OC Total macronutients (%) Total micronutients (ug/g) ratioC/N
N P K Fe Mn Zn Cu
Biochar 7.4 1.5 36 1.8 4.3 2.9 365 190 120 9 20
Humic acids 6.88 1.94 34.4 2.15 2.5 3.5 418 260 219 21.96 16
TABLE 1. Some physical and chemical properties of the soil under investigation
pH in soil paste extract
Particle size distribution (%)
Texture class
Avail. soil water
(%)
Bulk density (g/cm3)
H.C. (m/ day)
CEC (me/100g
soil)
Sand Silt Clay
7.95 79.53 7.10 13.37 SL 8.67 1.45 3.25 10.40
EC (dS/m) in soil paste extract
Soluble cations (me/l) Soluble anions (me/l)
SAR ESP
Ca2++
Mg2+ Na+ K+ HCO3- Cl- SO4
2-4.43 20.64 21.67 2.00 10.86 28.18 5.27 6.28 7.32
CaCO3 (%) OM (%) Total N (%) P K Available micronutrients (µg/g)Fe Mn Zn Cu
1.80 0.38 0.09 9.80 82 11.82 15.24 0.95 1.11
1- Control treatment (without any soil conditioner application).
2- Biochar at the rate of 5 ton/fed. 3- Biochar at the rate of 10 ton/fed. 4- Biochar at the rate of 20 ton/fed. 5- Humic acids at the rate of 5 kg/fed. 6- Humic acids at the rate of 10 kg /fed. 7- Humic acids at the rate of 20 kg /fed. Seeds of wheat (L.) cv. Sakha 8 at the rates of 70 kg seeds/fed.were sown on 32015/10/ after the application of soil conditioners to experimental plots (recent application). After wheat harvesting, corn (Zea maize L.) cv. Pioneer 30 K8 at the rates of 12 kg seeds/fed.were sown on the same plots on
152016/3/ without soil conditioners application (residual effect).
All plots received N, P and K fertilizers as
follows:-- Superphosphate (15.5% P2O5) at the rates of 150 and 200 kg P/fed., added before cultivation of both wheat and corn respectively.
- Ammonium nitrate (33.5% N) at the rates of 150 kg N/fed., added at two equal doses, one and two months, after cultivation of both wheat and corn, respectively.
- Potassium sulphate (48% K2O) at the rate of 50 kg K/fed., for the two cultivated crops added in two equal doses at the same time of N fertilizer application.
pH EC (dS/m) soluble cations(me/l) soluble anions(me/l) SAR
Ca2+ Mg2+ Na+ K+ CO
32- HCO3- Cl- SO4
2-7.45 2.41 4.39 8.78 10.79 0.14 - 3.90 10.74 9.46 1.16
The necessary management operations for the two cultivated crops were conducted at the appropriate times. Irrigation water from El-Salam Canal was applied every week and the irrigation was stopped 30 days before harvesting of the two crops. Table 3 presents the chemical composition of such water.
Plants were harvested at maturity, after 150 and 120 days from planting for both wheat and corn respectively, then grain yields were recorded.
Soil samples representing all the treatments were taken after harvesting then air dried, sieved through a 2 mm and stored for analysis. Also, grain samples represented all the treatments were taken, dried at 70 oC, ground and stored
for analysis. Analysis of soil, plant, water and the applied conditioners were determined by the standard methods of (Black, 1982; Cottenie et al., 1982 and A.O.A.C., 1995). The statistical analysis was carried out according to Snedecor and Cochran (1982).
Results and Discussion
Effect of the applied conditioners on some soil physical and chemical properties:
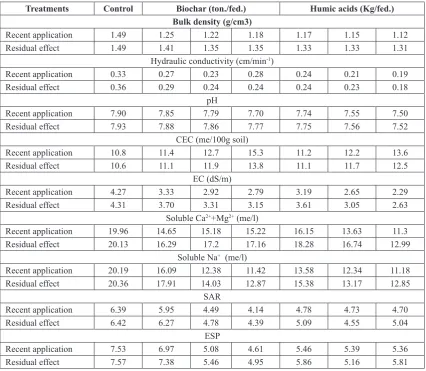
Data in Table 4 show the effect of the applied treatments on some physical and chemical properties of the investigated soil. Concerning the effect of the applied treatments on soil bulk
density and hydraulic conductivity values, data in Table 4 show that their values decreased by increasing the application rates of all the applied conditioners. The highest decreases of such values were associated with the treatment (20 kg humic acids/fed.) as the rate of decreases below the control under recent application reached 24.83 and 42.42% respectively, while the respective values under residual application reached 12.08 and 50.00%. Such decreases in soil bulk density
can be attributed to the low specific gravity of
organic materials and the role of organic products in enhancing soil aggregation which increases the apparent soil volume and consequently decrease bulk density. These results are in agreement with Tejada and Gonzalez (2006). Also, the improvement or the pronounced decrease in hydraulic conductivity of the studied sandy loam soil may be attributed to the creation of micro pores, and the dominance of meso and micropores on the exposed pore sizes. These results are in agreement with those of El-Fayoumy and Ramadan (2002).
Treatments Control Biochar (ton./fed.) Humic acids (Kg/fed.) Bulk density (g/cm3)
Recent application 1.49 1.25 1.22 1.18 1.17 1.15 1.12
Residual effect 1.49 1.41 1.35 1.35 1.33 1.33 1.31
Hydraulic conductivity (cm/min-1)
Recent application 0.33 0.27 0.23 0.28 0.24 0.21 0.19
Residual effect 0.36 0.29 0.24 0.24 0.24 0.23 0.18
pH
Recent application 7.90 7.85 7.79 7.70 7.74 7.55 7.50
Residual effect 7.93 7.88 7.86 7.77 7.75 7.56 7.52
CEC (me/100g soil)
Recent application 10.8 11.4 12.7 15.3 11.2 12.2 13.6
Residual effect 10.6 11.1 11.9 13.8 11.1 11.7 12.5
EC (dS/m)
Recent application 4.27 3.33 2.92 2.79 3.19 2.65 2.29
Residual effect 4.31 3.70 3.31 3.15 3.61 3.05 2.63
Soluble Ca2++Mg2+ (me/l)
Recent application 19.96 14.65 15.18 15.22 16.15 13.63 11.3
Residual effect 20.13 16.29 17.2 17.16 18.28 16.74 12.99
Soluble Na+ (me/l)
Recent application 20.19 16.09 12.38 11.42 13.58 12.34 11.18
Residual effect 20.36 17.91 14.03 12.87 15.38 13.17 12.85
SAR
Recent application 6.39 5.95 4.49 4.14 4.78 4.73 4.70
Residual effect 6.42 6.27 4.78 4.39 5.09 4.55 5.04
ESP
Recent application 7.53 6.97 5.08 4.61 5.46 5.39 5.36
Residual effect 7.57 7.38 5.46 4.95 5.86 5.16 5.81
Dias et al., 2010). Biochar is not at all inert in soil and can be oxidized, especially at the surface, through chemical and microbial activity (Cheng et al., 2006, 2008). The slow oxidization of biochar in soils can produce carboxylic functional groups (Brodowski et al., 2005 and Cheng et al., 2006). The formation of the acidic functional groups can neutralize alkalinity and eventually decrease soil pH. These results are in agreement with those found by (Dhanushkodi and Subrahmaniyan, 2012). With respect to soil CEC, data in the same table indicated that soil CEC values increased by increasing the application rate of both conditioners, and biochar treatments were more effective than that of humic acids in this concern. The rate of increment under recent applications of 20 ton biochar/fed. reached 41.67%, while reached 30.19% for residual effect of such treatment. These increases might be due to the presence of ash in biochar, which helps for
the immediate release of the occluded mineral nutrients like Ca, K and N for crop use, Scheuner
et al. (2004).
Also, microorganisms used humic acids as carbon source, thus may stimulate microorganisms to produce phytohormones, which play an important role in decline soil salinity (Khalil et al., 2013).
Data in the same table also revealed that SAR and ESP values decreased by the application of all amendments and the biochar treatment (20 ton /fed.) was more effective than all the other treatments in this concern. The rate of decrement under recent applications of such treatment reached 35.21 and 38.78% for SAR and ESP values, respectively, while the respective values under residual applications were 31.62 and 34.61% as compared with the control treatment. This was expected since biochar treatments had more soluble Na than that of humic ones.
Effect of the applied conditioners on soil fertility status
Soil organic carbon is one of the key indicators of soil quality, data in Table 5 show that soil organic matter content was increased due to all the applied treatments. It is also clear that the soil organic matter content were higher with the application of humic acids to soil than that of biochar ones. This is due to the higher OM content of humic acids relative to the other amendment, (Table 2). The increases in soil organic matter content were more obvious with the higher application rates of both the two conditioners and the best treatment in this concern was the application of (20 kg humic acids /fed.) as the rate of increment over the control reached 97.90 and 69.39 % under recent and residual applications, respectively.
With respect to soil total N, data in the same table indicated that all the applied treatments, especially those of humic acids, increased soil total N. The rate of increment over the control reached 48.21and 59.18% due to humic acids application at the rate of 20 kg /fed. under recent and residual applications, respectively. The respective values for biochar (20 ton/fed.) were 25.89 and 30.61%. This may be due to larger amounts of total C and N in the applied conditioners that could provide a larger source of N for mineralization. These results are in agreement with those obtained by Ebhin Masto, (2013). In this regard, Angelova et al. (2013) stated that there was a strong positive correlation
between the total organic carbon content and the total nitrogen content in soil and the application of organic materials might have produced more residual N in soil as compared with the control.
Data in Table 5 also indicate that the availability of P, K, Fe, Mn, Zn and Cu in soil was greatly enhanced by the application of all the applied treatments. The best treatment in this concern was that of (20 kg humic acids / fed.) where the rate of increment over the control reached 126.83, 78.8, 172.74, 190.3, 162.56 and 86.6 % for available P, K, Fe, Mn, Zn and Cu respectively under recent applications, while the respective increases under residual applications reached 98.38, 72.73, 153.68, 128.52, 78.65 and 77.53 %. The positive effects of the applied materials on such increases may be attributed to one or more of the following: a) higher initial content of such nutrients in the applied materials, (Table 2, b) reduction of soil pH values resulting from amendment application as found in this study (Table 4, c) slow mineralization process of organic matter, hence release of the nutrients and, d) converting unavailable soil phosphate into available forms due to humic acids application, (Bhattacharjee et al., 2001 and Angelova et al., 2013). The obtained results are in agreement with those reported by Shankar et al. (2012).
Effect of the applied conditioners on grain yield of the investigated plants:
Data in Table 6 indicate that grain yield of
wheat and corn plants significantly increased by the
TABLE 5. Effect of the applied conditioners on some soil nutrient concentrations
Treatments Control 5 Biochar (ton./fed.)10 20 5 Humic acids (Kg/fed.)10 20 O.M (%)
Recent application 0.49 0.60 0.61 0.63 0.65 0.71 0.97
Residual effect 0.49 0.53 0.55 0.59 0.56 0.67 0.83
Total N (%)
Recent application 0.11 0.13 0.13 0.14 0.15 0.16 0.17
Residual effect 0.10 0.12 0.12 0.13 0.14 0.15 0.16
Available P (ug/g)
Recent application 10.25 11.12 13.23 15.18 17.35 20.14 23.25
Residual effect 9.91 10.11 12.20 14.62 14.82 16.54 19.66
Available K (ug/g)
Recent application 85 96 118 132 123 145 152
Residual effect 77 82 95 110 98 123 133
Fe (ug/g)
Recent application 30.30 41.90 57.18 63.25 61.50 72.61 82.64
Residual effect 27.72 33.18 42.40 50.23 48.97 58.35 70.32
Mn (ug/g)
Recent application 15.62 19.90 25.40 32.61 30.42 36.50 45.35
Residual effect 13.22 16.36 19.51 24.33 23.90 26.31 30.21
Zn (ug/g)
Recent application 1.95 2.18 3.25 4.65 3.11 4.32 5.12
Residual effect 1.78 1.82 1.98 2.12 1.95 2.27 3.18
Cu (ug/g)
Recent application 0.97 1.12 1.55 1.64 1.53 1.69 1.81
Residual effect 0.89 0.92 1.08 1.50 0.95 1.20 1.58
TABLE 6. Yield and nutrients content of wheat and corn grains as affected by the applied conditioners
Treatments Control Biochar (ton./fed.) Humic acids (Kg/fed.) LSD at 5%
5 10 20 5 10 20
Grain yield (ton./fed.)
Wheat 1.95 2.12 2.42 2.58 2.27 2.58 2.72 0.031
Corn 3.45 3.66 4.21 4.52 3.65 4.23 4.75 0.271
N (%)
Wheat 0.69 0.96 1.04 1.24 0.92 1.22 1.34 0.035
Corn 0.62 0.87 0.95 1.12 0.92 1.10 1.25 0.032
P (%)
Wheat 0.27 0.31 0.35 0.42 0.35 0.45 0.57 0.023
Corn 0.36 0.42 0.44 0.47 0.45 0.48 0.56 0.034
K (%)
Wheat 0.51 0.58 0.61 0.56 0.58 0.63 0.68 0.040
Corn 0.48 0.51 0.53 0.55 0.51 0.55 0.62 0.026
Fe (ug/g)
Wheat 75 105 124 137 121 142 155 4.340
Corn 66 73 82 112 95 110 125 3.243
Mn (ug/g)
Wheat 27 35 39 44 36 42 46 13.435
Corn 25 32 35 39 32 37 41 2.885
Zn (ug/g)
Wheat 46 51 55 62 50 60 73 2.885
Corn 40 45 48 48 45 53 65 2.386
Cu (ug/g)
Wheat 14 15 19 21 20 22 26 2.093
The best treatment in this concern was the application of humic acids at the rate of 20 kg/ fed., where the rate of increment in wheat and corn grain yields over the control reached 39.48 and 37.68%, respectively. This positive effect may be attributed to the improvement action of the applied materials on soil physical properties as well as on the nutrients status in the soil which enhances plant growth, El Sanat (2003). Also, it may be due to the presence of essential nutrients in such materials which increased the metabolic activity of plant, Gupta (2005) as well as the direct effect of humic acids on solubilization and transport of nutrients which ultimately affect the plant productivity, Zaghloul et al., (2009). Morever, it may attributed to the increase in soil nutrient content and uptake of nutrients by plants as well as higher organic matter in the ash, Awodun et al., (2007). These results are in agreement with those reported by (Norman et al., 2004 and Steiner et al., 2007).
Effect of the applied conditioners on nutrients content of wheat and corn grains:
Nitrogen, phosphorus and potassium are of the integral components in plant metabolism. They are the key constituents of chlorophyll biosynthesis, protein, nucleic acids and other constituents. Data in Table 6 indicate that N, P and K concentrations in wheat and corn grains
significantly increased by the application of all
the experimental treatments. It is also clear that the values of such nutrients were higher under the humic acids applications than the biochar ones. The best treatment in increasing N, P and K was the application of humic acids at the rate of 20 kg/ fed., as the rate of increment over the control due to such treatment reached 94.20, 111.11 and 33.33 for N, P and K concentrations in wheat grains, respectively. The respective values for corn grains were 101.61, 55.55 and 29.17%. Data in Table 6 also indicate that Fe, Mn, Zn and Cu concentrations
in wheat and corn grains significantly increased
by the application of all experimental treatments. It is also clear that the values of such nutrients took the same trends previously mentioned for N, P and K concentrations in wheat and corn grains. The highest increases of Fe, Mn, Zn and Cu concentrations in wheat grains were found with the treatment (20 kg humic acids/ fed.), as the increases reached 106.67, 70.37, 58.70 and 85.71%, respectively. The respective increases in corn grains were 89.39, 64.00, 62.50 and 55.56%.
The positive effect of such materials on increasing macro- and micro-nutrients concentrations in wheat and corn grains may be attributed to that those materials act as valuable soil amendments that offer a balanced nutritional release pattern to plants, providing nutrients in readily available form that can be easily taken up by plants, Ferreras et al., (2006). Furthermore, humic acids have been reported to enhance mineral nutrient uptake by plants, because it affects the. permeability of root membranes (Türkmen et al., 2004). These results are in agreement with those obtained by Mesut et al. (2010).
Economical evaluation
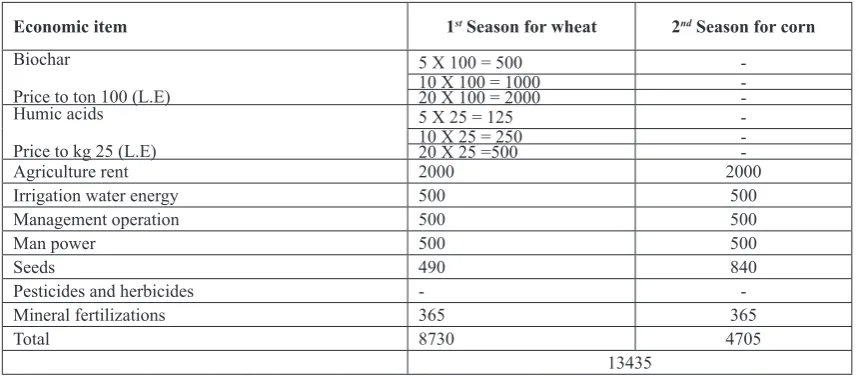
Data in Table 7 (a,b,c) reveal assessment of the experimental inputs and output as will as the ratio between them for each treatment, introducing investment ratio (IR) under the condition of El-Tina Plain area . Investment ratio was calculated from output/input analysis of variance for the data, as mentioned by Snedecor and Cochran (1982).
The data indicated the progressive increment in IR by increasing recent application rate and residual effect rate. The application of humic acids led to highest IR for all the two seasons as compared with biochar application, where the IR values under humic acids reached 1.57, 0.74, 1.55 and 0.60 for wheat grains, wheat straw, corn grains and corn shoot respectively. The respective IR values under biochar application were 1.64, 0.66, 1.52 and 0.59.
Concerning the effect of recent application and residual effect, it is clear that IR value under recent application (4.8) was higher than that under residual effect (4.26).
Conclusion
Results of the current study indicated the
beneficial application of biochar and humic acids
TABLE 7a. The prices of all agricultural management inputs under the condition of field experiment according
to market price
Economic item 1st Season for wheat 2nd Season for corn
Biochar
Price to ton 100 (L.E)
5 X 100 = 500
-10 X -100 = -1000
-20 X 100 = -2000
-Humic acids Price to kg 25 (L.E)
5 X 25 = 125
-10 X 25 = 250
-20 X 25 =500
-Agriculture rent 2000 2000
Irrigation water energy 500 500
Management operation 500 500
Man power 500 500
Seeds 490 840
Pesticides and herbicides -
-Mineral fertilizations 365 365
Total 8730 4705
13435 Biochar (price of ton = 100 pounds). Humic acids (price of kg = 25 pounds)
TABLE 7b. Production of both wheat and corn with prices
Productions Control Biochar (ton/fed.) Humic acids (ton/fed.) Kg Price (L.E)
5 10 20 5 10 20
Wheat Grain 1.95 2.12 2.42 2.58 2.27 2.58 2.72 3.10
Straw 2.33 2.70 2.90 3.34 3.10 3.34 3.57 1.00
Corn Grain 3.45 3.66 4.21 4.52 3.65 4.23 4.75 1.65
Shoot 4.85 5.11 5.38 5.42 5.09 5.31 5.62 0.50
TABLE 7c. Economical evaluation of experimental treatments of El-Tina Plain aerie conditions
Economic
parameters 1
st Season for wheat 2nd Season for corn
Grains Straw Grains Shoot
Biochar
5 Output 6572 2700 6039 2555
10 Output 7502 2900 6946 2690
20 Output 7998 3340 7458 2710
Total Input 13435 13435 13435 13435
Total output 22072 8940 20443 7955
IR 1.64 0.66 1.52 0.59
Humic acids
5 Output 7037 3100 6022 2545
10 Output 7998 3340 6979 2650
20 Output 8432 3570 7837 2810
Total Input 13435 13435 13435 13435
Total output 23467 10010 20838 8005
IR 1.75 0.74 1.55 0.60
Investment Ratio
References
A.O.A.C. (1995) Official Methods of Analysis. 15thed.
Association of agriculture chemists. Washington, D.C, U.S.A.
Abd E1-A1, F.S., Shafeek, M.R. Ahmed, A.A. and Shaheen, A.M. (2005) Response of growth and yield of onion plants to potassium fertilizer and humic acid. J. Agric. Sci. Mansoura Univ., Egypt,
30 (1), 441452-.
Angelova, V.R., Akova, V.I., Artinova, N.S. and Ivanov, K.I. (2013) The effect of organic amendments on soil chemical characteristics. Bulgarian J. Agric.
Sci., 19 (5), 958971-.
Arancon, N.Q., Edwards, C.A., Lee, S. and Byrne, R. (2006) Effects of humic acids from vermicomposts on plant growth. EuropeanJ. Soil Biol., 42, 6569-. Awodun, M.A., Ojeniyi, S.O. Adeboye, A. and Odedina,
A.S. (2007) Effect of oil palm bunch refuse ash on soil and plant nutrient composition and yield of maize. EurasianJ. Sustainable Agric., 1, 50–54. Bhattacharjee, G.; P. S. Chaudhuri and M. Datta (2001).
Response of paddy (Var. TRC- 87251-) crop on amendment of the field with different levels of vermicompost. Asian J. Microbial. Biotech.
Environ. Sci.,3, 191196-.
Black, C.A. (1982) Methods of Soil Analysis, Part 2, Amer. Soc. Agron. Madison, Wisconsin, USA. Brodowski, S., Amelung, W. Haumaier, L. Abetz, C.
and Zech, W. (2005) Morphological and chemical properties of black carbon in physical soil fractions as revealed by scanning electron microscopy and energy-dispersive x-ray spectroscopy. Geoderma, 128, 116–129
Chen, Y., Clapp, C.E. and Magen, H. (2004a) Mechanisms of plant growth stimulation by humic substances: The role of organo-iron complexes. Soil Sci. Plant Nutr., 50, 1089–1095.
Chen, Y., De Nobili, M. and Aviad, T. (2004b). Stimulatory effects of humic substances on plant growth. In: Magdoff FR, Weil R, (Ed.) Soil organic matter in sustainable agriculture. Boca Raton, CRC Press, FL, USA: 103–129.
Cheng, C. H., Lehmann, J. and Engelhard, M.H. (2008) Natural oxidation of black carbon in soils: Changes in molecular form and surface charge along a climosequence. Geochem., Cosmochim. Ac., 72, 1598–1610
Cheng, C.H., Lehmann, J. Thies, J.E. Burton, S.D. and Engelhard, M.H. (2006) Oxidation of black carbon by biotic and abiotic processes. Org. Geochem., 37, 1477–1488
Cottenie, A., Verloo, M. Kiekens, L. Velghe, G. and Camerlynck, R. (1982) Chemical Analysis of
Plants and Soils. Laboratory of analytical and agrochemistry. State Univ., Ghent, Belgium. Dhanushkodi, V. and Subrahmaniyan, K. (2012) Soil
management to increase rice yield in salt affected coastal soil – A Review. Int.J. Res. Chem. Environ.,
2, 1–5.
Dias, B.O., Silva, C.A. Higashikawa, F.S. Roig, A. and Sanchez- Monedero, M.A. (2010) Use of biochar as bulking agent for the composting of poultry manure: Effect on organic matter degradation and humification. Bioresour. Technol.,101, 1239–1246 Ebhin Masto, R.; Md. A. Ansari; J. George; V.A. Selvi
and L.C. Ram (2013) Co-application of biochar and lignite fly ash on soil nutrients and biological parameters at different crop growth stages of Zea mays. Ecological Engineering, 58, 314322-. El-Fayoumy, M.E. and H.M. Ramadan (2002) Effect
of bio-organic manures on sandy soils amelioration and peanut productivity under sprinkler irrigation system. Egypt.J. Soil Sci., 42, 838.415.
El Sanat, G.M. (2003) Effect of amelioration processes on nutrients status in salt affected soils. M. Sc.
Thesis, Fac. Agric. Menufiya Univ., Egypt. Ferreras, L., Gomez; S. Toresani, Firpo, I. and Rotondo,
R. (2006) Effect of organic amendments on some physical, chemical and biological properties in a horticultural soil. Bioresour. Technol., 97, 635–640. Gupta, P.K. (2005) Vermicomposting for sustainable
agriculture. Bharat Printing Press, Jodhpur, India: 11–14.
Hafez, M. Magda (2003) Effect of some sources of nitrogen fertilizer and concentration of humic acid on the productivity of squash plant. Egypt J. Appl.
Sci.19(10), 293309-.
Khalil, Heba, M.A., Afifi, M.M.I. El-Akshar, Y.S. and El-Sayed, G.A.M. (2013) Effect of bio- organic fertilizers on barley plants in a saline soil. J. Appl.
Sci. Res., 9, 53375343-.
1, 1–7.
Mesut, K., Önder, T. Metin, T. and Burcu, T. (2010) Phosphorus and humic acid application alleviate salinity stress of pepper seedling. African J. of
Biotechnol.9, 58455851-.
Mora, V., Bacaicoa, E. Zamarreno, A.M. Aguirre, E. Garnica M. Fuentes, M. and Garcia-Mina, J.M. (2010) Action of humic acid on promotion of cucumber shoot growth involves nitrate-related changes associated with the root-to-shoot distribution of cytokinins, polyamines and mineral nutrients. J. Plant Physiol., 167 633–642.
Nardi, S., Sessi, E. Pizzeghello, D. Sturato, A. Rella, R. and Parvoli, G. (2002) Biological activity of soil organic matter mobilized by root exudates. Chemosphere,46, 10751081-.
Norman, Q., Stephenlesa, A. Edwardsa, C.A. and Atiyeh, R. (2004) Effect of humic acid derived from cattle, food and paper –waste vermicomposts on growth of greenhouse plants. The Soil Ecology Laboratory, Ohio State Univ., USA.
Pitman, M.G. and Läuchli, A. (2004) Global impact of salinity and agricultural ecosystems. In: A. Läuchli and U. Lüttge (Ed.). Salinity: environment plants molecules. Springer, Netherlands.
Ramoliya, P.J. and Pandey, A.N. (2003) Effect of salinisation of soil on emergence, growth and survival of seedlings of Cordia rothii. Forest Econ.
& Mgt., 176,185194-.
Renard, D., Iriarte J. Birk, J. J. S. Rostain, B. Glaser and D. McKey (2012) Ecological engineers ahead of their time: The functioning of pre-Columbian raised-field agriculture and its potential contributions to sustainability today. Ecol. Eng.,45, 30–44.
Rodriguez-Navarro, A. and Rubio, F. (2006) High-affinity potassium and sodium transport systems in plants. J. Exp. Bot., 57, 1149 – 1160.
Scheuner, E. T., Makeschin, F. Wells, E.D. and Carter, P.Q. (2004) Short-term impacts of harvesting and burning disturbances on physical and chemical characteristics of forest soils in western Newfoundland, Canada. EuropeanJ. Forest Res., 123, 321330-.
Senesi, N. and Plaza, C. (2007) Role of humification processes in recycling organic wastes of various nature and sources as soil amendments. Clean –
Soil, Air, Water,35, 26–41
Shankar, K. Sreedevi, S. Sumathi, M. Shankar and Reddy, N. N. (2012) Comparison of nutritional quality of organically versus conventionally grown
tomato. Indian J. of Hort., 69 (1), 8690-.
Snedecor, G.W. and Cochran, W.G. (1982) In "Statistical methods". 7th ed. Iowa State Univ. Press,
USA.
Steiner, C., Teixeira, W. Lehmann, J. Nehls, T. Vasconcelos, J. de Macêdo; Blum, W. and Zech, W. (2007) Long term effects of manure, charcoal and mineral fertilization on crop production and fertility on a highly weathered Central Amazonian upland soil. Plant and Soil, 291, 275290-.
Tejada, M. and J.L. Gonzalez (2006) Relationships between erodibility and erosion in a soil treated with two organic amendments. Soil Till. Res., 91, 186198-.
Turkmen, O., Dursun, A. Turan, M. and Erdinc, C. (2004) Calcium and humic acid affect seed germination, growth, and nutrient content of tomato (Lycopersicon esculentum L.). Seedlings in saline Soil Conditions. Acta Agric. Scand., Sect. B, Soil & Plant Sci.,54, 168174-.
Uzoma, K.C., Inoue, M. Andry, H. Fujimaki, H. Zahoor, A. and Nishihara, E. (2011) Effect of cow manure biochar on maize productivity under sandy soil condition. Soil Use Manag., 27(2), 205212-. Woolf, D.; Amonette, J.E. Street-Perrott, F.A.
Lehmann, J. and Joseph, S. (2010) Sustainable biochar to mitigate global climate change. Nature Commun, 156, 147-.
Zaghloul, S. M., El-Quesni, F.E.M. and Mazhar, A.A.M. (2009) Influence of potassium humate on growth and chemical constituents of Thuja orientalis L seedlings. Ozean J. Appl. Sci., 2, 7378-.