Hazards and accessibility: combining and visualizing threat
and open infrastructure data for disaster management
Jordi Tost,
aFabian Ehmel,
aFrank Heidmann,
aStephanie M. Olen,
band Bodo Bookhagen
ba Interaction Design Lab, University of Applied Sciences Potsdam, Germany; [email protected],
[email protected], [email protected]
b Institute of Earth and Environmental Sciences, University of Potsdam, Germany; [email protected],
Abstract: The assessment of natural hazards and risk has traditionally been built upon the estimation of threat maps, which are used to depict potential danger posed by a particular hazard throughout a given area. But when a hazard event strikes, infrastructure is a significant factor that can determine if the situation becomes a disaster. The vulnerability of the population in a region does not only depend on the area’s local threat, but also on the geographical accessibility of the area. This makes threat maps by themselves insufficient for supporting real-time decision-making, especially for those tasks that involve the use of the road network, such as management of relief operations, aid distribution, or planning of evacuation routes, among others. To overcome this problem, this paper proposes a multidisciplinary approach divided in two parts. First, data fusion of satellite-based threat data and open infrastructure data from OpenStreetMap, introducing a threat-based routing service. Second, the visualization of this data through cartographic generalization and schematization. This emphasizes critical areas along roads in a simple way and allows users to visually evaluate the impact natural hazards may have on infrastructure. We develop and illustrate this methodology with a case study of landslide threat for an area in Colombia.
Keywords: Geovisualization, Data fusion, Generalization, Schematic maps, Natural hazards, Disaster management
1.
Introduction
In recent years, abundant research has been done in the fields of geographic information systems (GIS) and re-mote sensing in order to analyze disaster risk and to provide relevant information that improves decision-making and relief effectiveness in disaster management (Herold and Sawada 2012). Increasingly, satellite-based data is available faster and in ever-improving resolutions (Voigt et al. 2016). However, this apparent benefit may also lead to information overload (Chen 2010; Schick et al. 1999), which can be counter-productive for decision makers in disaster situations, where information must be understood rapidly and with the lowest cognitive workload.
Traditional satellite-based emergency mapping is commonly built on the estimation of threat maps, which pro-vide a static snapshot of the local potential threat of a particular hazard in a region. But besides the physical magnitude of the hazard, social vulnerability is the factor that usually determines its consequences (Cutter et al. 2003). Vulnerability is determined by socioeconomic, institutional, and natural and human-made environmental conditions (Hewitt 1998). One of these conditions is infrastructure (Garschagen et al. 2016). Disaster relief is not only affected by the immediate consequences of the hazard, but also by the area’s accessibility and mobility capabilities for internal displacements. Decisions based on the area’s road network have to be taken continuously and in real-time: relief teams need to manage the units in
aid and food distribution, population evacuations need to be performed, etc. In the aftermath of a disaster, time and coordination are crucial, and it is important to quickly identify mobility restrictions (e.g. road blockades) and isolated areas to respond efficiently. Moreover, assessing infrastructure vulnerability is essential for disaster preparedness to foresee which areas are most susceptible and with this, develop mitigation policies that may reduce disaster risk. For this, a proper evaluation of the threat along roads is needed, and this requires new ways to deal with and visualize threat data. To this end, our goal is to propose a more effective means of visualizing potential threats along roads and routes. We do this in a way that simplifies the use of threat data in the context of infrastructure vulnerability estimation and decision-making in all tasks that require mobility.
It rather proposes the design of a more dynamic and efficient way to gather and visualize existing threat data for mobility-related decision-making.
This paper proceeds as follows: we first summarize the related works, which lead to the problem definition. Subsequently, we present our case study in Colombia, explain the characteristics of the area of interest and introduce the dataset. We then present our interdisciplinary approach: first how data fusion works, and then how we developed the visualization by applying generalization transformations. Finally, we suggest possible applications, discuss the results, introduce our future work and propose recommendations for future research.
2.
Related Work
Past research has shown that infrastructure itself can be a crucial factor of risk (Garschagen et al. 2016). Infra-structure vulnerability has been modelled with multiple methods to estimate the performance of infrastructure systems in disasters (Faturechi and Miller-Hooks 2014). These methods are mostly based on mathematical models that quantify how susceptible a network is to malfunction given an adverse event such as a hazard, but are neither based on hazard data nor present a visual approach for real-world use.
In terms of data, remote sensing offers several possibilities to generate threat and hazard maps for risk assessment, including damage assessment for disaster response and recovery using high resolution images or, for example, detecting road damages after events (Coulibaly et al. 2014). The use of volunteered geographic information has been also shown effective after a disaster for road damage assessment (Schnebele et al. 2014). As an example, OpenStreetMap has shown the potential of open collaborative mapping for disaster relief (Poiani et al. 2016). During disasters, a large community of volunteers works on keeping maps updated by rapidly mapping damages and by completing areas that were not mapped before. This allows the possibility to create reliable routing services for emergency vehicles that use up-to-date infrastructure data (Neis et al. 2010), which can be complemented through data fusion (Jotshi et al. 2009).
To handle the ever-increasing amount of data, interactive GIS routines are being employed to support decision making in all phases of disaster management through interactive exploration and geovisualization (Herold and Sawada 2012). Information visualization also plays an essential role in coping with information overload. Its importance for making sense of large amounts of data and for supporting decision-making has already been demonstrated (Bresciani and Eppler 2009). Especially for high-stress situations during emergency response, visual representation has been proven useful for enhancing the capability to process information (Coury & Boulette 1992). Borzo (2004) recommends considering both the characteristics of decision makers and decision tasks in order to make the relevant insights stand out for each of them.
Cartographic generalization is used to improve the clarity of maps and emphasize the most important map features (MacEachren 1995). Shea and McMaster (1989) presented a logical framework that gives an understanding about when and how to generalize in digital maps using different techniques. Schematization is a type of generalization that aims to enhance perceptual tasks by minimizing detail and without losing map context (Mackaness and Reimer 2014). The metro map schematization metaphor (Garland 1994) has been largely applied to other spatial data, such as road networks or route maps, although most research has focused on the automated generation of schematic maps (Dong et al. 2008; van Dijk et al. 2016). Agrawala and Stolte (2001) proposed a set of schematization techniques to improve the usability of route maps based on cognitive psychology research (Denis 1997) and on the analysis of how people read hand-drawn route maps in comparison to standard maps. Their resulting approach distorts road lengths and angles, simplifies road shape and reduces contextual information and decoration, showing only road names and directions. This was proven usable for relatively short trips within a familiar region. However, this research also showed that for long routes and in non-familiar areas, a certain level of detailed local context along the route (i.e. area landmarks such as rivers, points of interest, etc.) is necessary to keep the sense of direction. An underdeveloped aspect of schematization is its application into new tools for expert users to use in real-world scenarios. One of the scarce examples is the research by Hurter et al. (2010), which proposes the automatic generation of schematic maps to display flight routes for air traffic control. Although the rules applied for air traffic control cannot be directly applied to route mapping for disaster management and vice versa, the problems that motivate the use of schematization are indeed related. Moreover, the working conditions in air traffic control are strongly related to those in disaster management, specifically in the response phase. Decisions have to be taken quickly and effectively under high pressure and stress, which lead to the need of easy-to-read visualizations with a low cognitive workload.
3.
Problem Definition
vulnerability modeling calculate general vulnerability indices based on multiple constrains that are addressed to reporting and policy making. But for practical purposes (e.g. field operations, etc.), there is a lack of tools that show the georeferenced potential local threat to infrastructure and that, built on geospatial mapping, visualize which areas can represent a threat to vital infrastructure in case of a hazard. In other words, it is important to know “which is the vulnerability index of my local road network?”, but for practical use, it is necessary to know “which spots on a road are susceptible to get damaged or blocked?”. Both challenges are indeed related. We need to reduce the gap between threat mapping and the assessment of local infra-structure vulnerability in a direct, pragmatic and visual way. We have access to wider amounts of better data and, according to our research, this requires new ways to: a) deal with the data –data fusion–, b) visualize the data, and c) explore the data. In this paper, we focus on data fusion and visualization.
4.
Case Study: Landslides in NE Colombia
The research presented in this paper was done in the scope of the DIGENTI project, whose goal is to construct an interdisciplinary methodology for quantifying and communicating the threat of natural hazards, and to provide an interactive guide for policy and decision makers in the field of disaster management.
The methodology presented in this project is built on a particular case study conducted in an area of interest in the Cesar and La Guajira departments of northeastern Colombia. The area contains part of the Serranía del Perijá mountain range, has a variable topography and a typical Caribbean weather with heavy raining and El Niño-related phenomena. This causes a threat of landsliding in the area. In the context of landslides, threat maps are used to depict potential danger from landslides and visualize the possibility of future landsliding throughout a given area.
For the area of interest, we estimated a new suite of high-resolution landslide potential maps (Olen and Bookha-gen 2016). These maps were calculated by combining the 12x12-meter TanDEM-X WorldDEM (WorldDEM 2017) with other environmental data, such as the Harmonized World Soil Database (FAO et al. 2012), to calculate the Factor of Safety (FOS, Selby 1974). The FOS, which determines landslide threat, estimates local hillslope instabilities and quantifies the probability that a hillslope is stable or not. The FOS polygons are classified into the following classes: 1) very unstable, 2) unstable, 3) moderately unstable, 4) moderately stable, 5) very stable. For instance, in an area with a FOS 1, where the ground is estimated as very unstable, the threat will be high. Otherwise, areas with FOS 4 or 5 are stable and will be safer. The figures used in this paper show only the areas classified with FOS 1 to 3 and these are color coded with red (FOS 1), orange (FOS 2) and yellow (FOS 3). Figure 1b shows the complete area of interest and the FOS dataset.
5.
Data Fusion
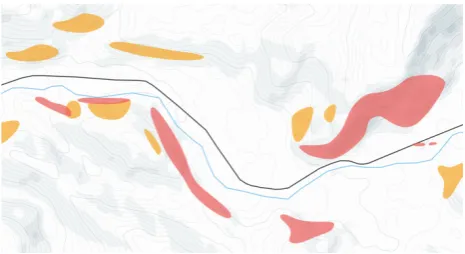
Showing a complete high-resolution threat dataset (e.g. FOS) over an area can be overwhelming, especially including infrastructure information (Fig. 1a). Information density on the map is too high and it is difficult to distinguish which particular unstable areas could be critical for the road network. We can approach this with data fusion. As seen in figures 1b and 2b, by filtering the threat along roads and routes, we reduce data congestion, obtaining only the potentially critical areas (FOS polygons) that may signify a threat to infrastructure.
Fig. 2. Two maps showing a road and FOS threat data: a) before data fusion, and b) after data fusion.
For this purpose, we propose the use of infrastructure data from the OpenStreetMap dataset, which includes roads, routes, streets, paths, etc. OpenStreetMap, as crowdsourcing-based open data platform, makes it easy for everyone to add and edit spatial data. For this reason, OpenStreetMap has become an important tool for relief and logistics teams during disasters, due to its constant updates of infrastructure status through collaborative mapping (Palen et al. 2015).
For performing the data fusion, we implemented the DIGENTI API, an application programming interface (API) that allows the combination of threat data with multiple spatial features. Besides querying threat data for roads, it is also possible to make queries for given points (bridges, settlements, points of interest, etc.) or polygons (areas).
Fig. 3. DIGENTI API’s data calls by point, line (or route) and polygon (or area).
If a trunk road has been blocked (e.g. by a landslide), relief logistics need to quickly evaluate the situation and determine alternative solutions. In such situations, the collaborative mapping of OpenStreetMap offers the possibility to access updated infrastructure information, which can be used by emergency routing platforms that calculate routes that avoid affected areas and blocked streets (Neis et al. 2010; Poiani et al. 2016). Besides damages, it is also important to identify critical points along the infrastructure that are susceptible of being hit (e.g. by future landslid-ing).
When planning a route, the deciding factors are: − “Which is the shortest route from A to B?” − “Which is the fastest route from A to B?” − “Which is the most resource-saving route from A
to B?”
And in the context of emergency response, a further factor could be:
− “Which is the safest route from A to B?”
Within the DIGENTI API, we have implemented a live routing service that queries threat data along the
calculated routes. With this threat-based routing service it would be possible to suggest different routes depending on threat and to calculate alternative routes that avoid trespassing critical areas.
Fig. 4. Route between Manaure Balcón del Cesar and San José del Oriente, calculated with the DIGENTI API.
The DIGENTI API, code examples, and further documentation are available on: https://github.com/FH-Potsdam/digenti-api.
6.
Visualization
In the context of emergency relief and logistics, decision makers need the essential insights to visually stand out. For this, the visualization part of our approach is based on cartographic generalization. This chapter describes step by step the transformation process divided into generalization of threat data, generalization of routes and a general schematization. This complete process is summarized in figure 7 by illustrating the routes of two emergency vehicles to a field operation.
It is important to consider that the authorities and entities involved in disaster management may be local, regional, national or even international. We assume that, depending on their role and level of local area knowledge, users will need data presented in different generalization scales. In this paper, we focus on the local scale.
6.1 Generalization of threat data
Fig. 5. Two maps showing threat along a road with a) raw data, and b) smoothed cluster grouping.
It may seem contradictory to apply these techniques on high-resolution data, since we lose information simultaneously. We believe that simplifying the dataset will help users to detect the most critical areas faster. Moreover, a tool visualizing threat data should always allow users to switch modes and request the raw dataset on demand (Shneiderman 1996).
6.2 Generalization of routes
Before we start with the schematization process, we reduce the granularity of routes through shape simplification and smoothing (Shea and McMaster 1989). This will trim line sharpness by reducing small perturbations and keeping only the most significant trends, offering a smoother map that keeps the overall route shape. The resulting aesthetic can be seen in figures 6a and 7c.
6.3 Schematization
Schematic maps are examples of how visual complexity can be reduced by manipulating map features, by morphing them, exaggerating important insights and reducing non-functional detail. It has been shown that effec-tive schematized route maps must contain all turning points on a route (Denis 1997), while representing the precise length, angle and shape of a road is less relevant (Tversky and Lee 1999). Considering this, and in order to highlight routes’ main characteristics, we propose a first schematization that removes small curves and morphs main route segments into straight lines. Turning points keep their overall angle and the length of route segments is still propor-tional to their length in the original map (Fig. 6b and 7d). With this, we want to assure that decision makers do not misunderstand road lengths when, for example, deciding between multiple routes. Moreover, we also keep and schematize that landmarks that are both relevant for the route condition and for the viewer to keep the sense of di-rection, such as water crossings. Regarding the threat data, we propose the abstraction of the polygons by straight-ening and repositioning them over the schematized route (Fig. 6b and 7d).
We introduce a second schematization, considering that preserving the exact angle of a road is less relevant for understanding a route map (Tversky and Lee 1999). Further transformations are: abstraction of landmarks (e.g. water crossings), the removal of all road angles and
the displacement of road segments to achieve a straight linear visualization. The result has a higher level of abstraction and is aesthetically similar to a step map or a network graph (Fig. 6c).
Fig. 6. Three road maps showing the same setting with different generalization levels: (a) smoothed and simplified map, (b) first schematization using the metro map metaphor, and (c) second schematization as a network graph.
7.
Applications
We can envision different use cases for our approach, especially when decisions based on area mobility and accessibility have to be taken. These applications can be both before a disaster, for preparedness and mitigation, and after a disaster, for emergency response. Two possible use cases are:
• Pre-disaster – analysis of infrastructure vulnerability: With our approach users would be able to evaluate and visualize threat to existing infrastructure and foresee critical spots along roads that could present accessibility and mobility deficits and potentially isolated areas. This could be used for several applications, including risk knowledge and communication, infrastructure development, determining response and evacuation procedures, or policy making, among others.
Fig. 7. Four maps showing the routes of two emergency vehicles (vehicles A and B) to a field operation. Each map shows the same information at different generalization phases: (a) original map, (b) generalization of threat data by shape simplification, (c) simplification and smoothing of routes and line features, and (d) schematic map.
8.
Conclusions and Further Work
This paper proposes data fusion and schematization of route maps for the field of disaster management. In the age of information overload, we believe that the presented techniques will support decision-making, by offering simple visualizations that enhance the important insights. By means of visual comparison, we believe that decision-makers will be able to take better decisions with a lower cognitive workload. While a proper evaluation has still not been conducted to test the comprehension and usability of our approach, first discussions with members of the Colombian National Unit for Disaster Risk Management (UNGRD) have shown significant interest, and pointed out the importance of simpler methods and new visualization techniques for their daily work in order to understand, communicate and assess risk. While a user evaluation with Colombian entities has been already planned in the near future to extract preliminary results of our approach, we believe that further research is required in order to take overall conclusions about the usability of schematic maps in the field of disaster management. Cartographic generalization implies the use of multiple levels of data detail depending on context and zoom levels. The current paper presents different levels of schematization, but always focuses on a local area. Disaster management is itself a wide field that involves multiple task profiles (e.g. planning tasks vs. live use) and different user roles (e.g. managers vs. workers on the field). Moreover, involved authorities can be local, regional, national or international, and may have local knowledge of the affected area or not. In order to assess this diversity, a user-centered design approach (Gabbart et al. 1999) is needed to define which levels of detail or abstraction are required for each role, task profile and level of local knowledge. Another important factor to take in to account is the area characteristics, since we have focused our experiments on a rural area with a low road density. It would be interesting to apply
the same methods in urban areas with a higher density and a nested road network and evaluate if there are different requirements.
We are conducting further research that is looking into new ways to generate and visualize schematized small multiples (Reimer et al. 2011) for comparing routes in a more abstract way based on different parameters such as distance, time, resource-performance and threat. Through small multiples, users will be able to visually compare various route options and quickly decide the most suitable. Although a routing algorithm of these characteristics could recommend the safest route automatically, we want to support the decision-making process with visualization, so users can combine the visualized information with their local knowledge and decide accordingly, alone or collaboratively in group decision-making. Additionally, we are exploring new ways to visualize threat in a more dynamic way that considers the area’s hydrologic networks and the threat of landslide-induced debris flows and flash floods.
Although we have presented our experiments built on available threat data from the area of interest in Colombia, we believe that the same or a similar approach can be applied for other remote sensing-based datasets and other areas. We hope that our approach encourages a productive discussion in the research community and inspires further research at the intersection between cartography, geovisualization and disaster management.
9.
Acknowledgements
We want to thank Swann Nowak for his contributions to the project and our colleague Sebastian Meier for his support, valuable ideas and continuous feedback. We also appreciate the contributions by Juliane Kummerlöwe, Ralf Puchert and Rolf Lessing from Delphi IMM on the server and database part. We are also grateful to Verónica Torres Acosta for the coordination and co-organization of the upcoming workshop at the UNGRD in Colombia. The project DIGENTI is funded by the German Federal Ministry for Economic Affairs and Energy (BMWi) within the INNOspace initiative of the German Aerospace Center (DLR). We are grateful for this support.
Acknowledgements of support for the project / paper / author are welcome.
10.
References
Agrawala, M., & Stolte, C. (2001, August). Rendering effective route maps: improving usability through generalization. In Proceedings of the 28th annual conference on Computer graphics and interactive techniques (pp. 241-249). ACM.
Borzo, J. (2004). Get the picture: In the age of information overload, visualization software promises to cut through the clutter. The Wall Street Journal.
transactions on visualization and computer graphics, 15(6).
Chen, C. (2010). Information visualization. Wiley Interdisciplinary Reviews: Computational Statistics, 2(4), 387–403.
Coulibaly, I., Spiric, N., Sghaier, M. O., Manzo-Vargas, W., Lepage, R., & St-Jacques, M. (2014, July). Road extraction from high resolution remote sensing image using multiresolution in case of major disaster. In Geoscience and Remote Sensing Symposium (IGARSS), 2014 IEEE International (pp. 2712-2715). IEEE.
Coury, B. G., & Boulette, M. D. (1992). Time stress and the processing of visual displays. Human factors, 34(6), 707-725.
Cutter, S. L., Boruff, B. J., & Shirley, W. L. (2003). Social vulnerability to environmental hazards. Social science quarterly, 84(2), 242-261.
Denis, M. (1997). The description of routes: A cognitive approach to the production of spatial discourse. Cahiers de psychologie cognitive, 16(4), 409-458.
Dong, W., Guo, Q., & Liu, J. (2008). Schematic road network map progressive generalization based on multiple constraints. Geo-spatial Information Science, 11(3), 215-220.
FAO, IIASA, ISRIC, ISSCAS, JRC. (2012). Harmonized World Soil Database (version 1.2). FAO, Rome, Italy and IIASA, Laxenburg, Austria.
Faturechi, R., & Miller-Hooks, E. (2014). Measuring the performance of transportation infrastructure systems in disasters: A com-prehensive review. Journal of infrastructure systems, 21(1), 04014025.
Gabbard, J. L., Hix, D., & Swan, J. E. (1999). User-centered design and evaluation of virtual environments. IEEE computer Graphics and Applications, 19(6), 51-59.
Garland, K. (1994). Mr Beck's Underground Map. Capital Transportation Publishing.
Garschagen, M., Hagenlocher, M., Comes, M., Dubbert, M., Sabelfeld, R., Lee, Y. J., ... & Pott, S. (2016). World Risk Report 2016. Bündnis Entwicklung Hilft and United Nations University–Institute for Environment and Human Security (UNU-EHS).
Herold, S., & Sawada, M. C. (2012). A review of geospatial information technology for natural disaster management in developing countries. Geographic Information Systems: Concepts, Methodologies, Tools, and Applications: Concepts, Methodologies, Tools, and Applications, 175.
Hewitt, K. (1998). Excluded perspectives in the social construction of disaster. What is a disaster, 75-91. Hurter, C., Serrurier, M., Alonso, R., Tabart, G., & Vinot,
J. L. (2010, May). An automatic generation of schematic maps to display flight routes for air traffic controllers: structure and color optimization. In
Proceedings of the international conference on ad-vanced visual interfaces (pp. 233-240). ACM.
Jotshi, A., Gong, Q., & Batta, R. (2009). Dispatching and routing of emergency vehicles in disaster mitigation using data fu-sion. Socio-Economic Planning Sciences, 43(1), 1-24.
Joyce, K. E., Belliss, S. E., Samsonov, S. V., McNeill, S. J., & Glassey, P. J. (2009). A review of the status of satellite remote sensing and image processing techniques for mapping natural hazards and disasters. Progress in Physical Geography, 33(2), 183-207.
MacEachren, A. M. (1995). How maps work: representation, visualization, and design. Guilford Press. Mackaness, W. A., Ruas, A., & Sarjakoski, L. T. (Eds.). (2011). Generalisation of geographic information: cartographic modelling and applications. Elsevier. Mackaness, W., & Reimer, A. (2014). Generalisation in
the context of schematised maps. In Abstracting Geographic Information in a Data Rich World (pp. 299-328). Springer International Publishing.
Neis, P., Singler, P., & Zipf, A. (2010). Collaborative mapping and emergency routing for disaster logistics– case studies from the haiti earthquake and the UN Portal for Afrika (pp. 1-6).
Nesbitt, K. V. (2004, July). Getting to more abstract places using the metro map metaphor. In Information Visualisation, 2004. IV 2004. Proceedings. Eighth International Conference on (pp. 488-493). IEEE. Olen, S. M., & B. Bookhagen (2016). Assessing hillslope
instability and natural hazard with the World DEM and TerraSAR-X SAR data in Northeast Colombia. In TerraSAR-X/TanDEM-X Science Team Meeting 2016, edited.
OpenStreetMap (2017). http://www.openstreetmap.org/about. Accessed 21 Feb
2017.
Palen, L., Soden, R., Anderson, T. J., & Barrenechea, M. (2015, April). Success & scale in a data-producing organization: The socio-technical evolution of OpenStreetMap in response to humanitarian events. In Proceedings of the 33rd annual ACM conference on human factors in computing systems (pp. 4113-4122). ACM.
Poiani, T. H., dos Santos Rocha, R., Degrossi, L. C., & de Albuquerque, J. P. (2016, January). Potential of collaborative mapping for disaster relief: A case study of OpenStreetMap in the Nepal Earthquake 2015. In System Sciences (HICSS), 2016 49th Hawaii In-ternational Conference on (pp. 188-197). IEEE.
Reilly, D. F., & Inkpen, K. M. (2004, May). Map morphing: Making sense of incongruent maps. In Proceedings of Graphics Interface 2004 (pp. 231-238). Canadian Human-Computer Communications Society. Reimer, A., Unger, A., Meulemans, W., & Dransch, D.
Schick, A. G., Gordon, L. A., & Haka, S. (1990). Information overload: A temporal approach. Accounting, Organizations and Socie-ty, 15(3), 199-220.
Schnebele, E., & Waters, N. (2014). Road assessment after flood events using non-authoritative data. Natural Hazards and Earth Sys-tem Sciences, 14(4), 1007. Selby, M. J. (1974). Dominant geomorphic events in
landform evolution. Bulletin of the International Association of Engineering Ge-ology-Bulletin de l'Association Internationale de Géologie de l'Ingénieur, 9(1), 85-89.
Shea, K. S., & McMaster, R. B. (1989). Cartographic generalization in a digital environment: When and how to generalize. In Proceedings for Auto-Carto (Vol. 9, pp. 56-67).
Shneiderman, B. (1996). The eyes have it: A task by data type taxonomy for information visualizations. In Visual Languages, 1996. Proceedings., IEEE Symposium on (pp. 336-343). IEEE.
Slocum, T. A., McMaster, R. B., Kessler, F. C., & Howard, H. H. (2009). Thematic cartography and Geovisualization. Prentice Hall.
Tversky, B., & Lee, P. U. (1999, August). Pictorial and verbal tools for conveying routes. In International Conference on Spatial In-formation Theory (pp. 51-64). Springer Berlin Heidelberg.
van Dijk, T. C., Haunert, J. H., & Oehrlein, J. (2016, June). Location‐dependent generalization of road
networks based on equivalent destinations. In Computer Graphics Forum (Vol. 35, No. 3, pp. 451-460).
Voigt, S., Giulio-Tonolo, F., Lyons, J., Kučera, J., Jones, B., Schneiderhan, T., et al. (2016). Global trends in satellite-based emergen-cy mapping. Science, 353(6296), 247–252.