ISSN 0975-928X
Research Article
Genetic divergence studies for yield, yield components and grain quality
parameters in rice (
Oryza sativa
L.)
Ashok, S*., Jyothula, D.P.B and Ratnababu, D
Department of Genetics and Plant Breeding, Acharya N. G. Ranga Agricultural University, Agricultural College, Bapatla-522101, Andhra Pradesh
* E-mail: [email protected]
(Received: 9 Apr 2017; Revised: 29 Nov 2017; Accepted: 18 Dec 2017)
Abstract
Genetic divergence was assessed among 64 rice genotypes with 17 characters from different eco–geographical regions of India using Mahalanobis’s D2
analysis. The experimental materials were evaluated during kharif-2014 at Agricultural College Farm, Bapatla, Andhra Pradesh, India. The 64 rice genotypes were grouped in to nine clusters. Out of nine clusters, maximum number of 30 genotypes are in cluster I. Cluster III is the second largest with 11 genotypes followed by cluster II and V each with 9 genotypes. Cluster IV, VI, VII, VIII and IX possess one genotype each. The pattern of distribution of genotypes into various clusters was at random indicating that geographical and genetic diversity were not related. The pattern of group constellations indicated significant variability among the genotypes. Characters viz., head rice recovery, test weight, volume expansion ratio, milling percentage, number of grains per panicle, and protein percent together contributed 80% towards total divergence suggested that these characters should be taken into consideration while selecting parents for hybridization.
.
Key words
Rice, Yield Components, Quality Parameter, Genetic Divergence, Cluster.
Introduction
The slogan ‘Rice is life’ aptly describes the importance of rice in food and nutritional security. Rice (Oryza sativa L.) is the world’s second most important cereal crop and staple food for more than 60% of the global population providing about 75% of the calorie and 55% of the protein intake in their average daily diet. In India, rice is grown in an area of 45.5 M ha with a production of 106.54 M t and 2424 kg ha-1 (Ministry of Agriculture, Directorate of Economics and Statistics, 2013-14). Maintaining stable rice production is extremely important to feed the constantly growing population. For the estimated population of 1.63 billion people by the year 2050 with a per capita rice consumption of 225 to 275 g/day, country would require 133 to 162 M t of rice (www.drricar.org, 2013). In the present scenario the rice productivity has reached a plateau. In order to achieve the expected targets, we have to develop the varieties with higher yield potential by breaking the existing yield plateau through utilizing more diversified parents in breeding programmes.
The success of any plant breeding programme largely depends on the existence of diversity among the genotypes (Allard, 1960). This helps in the choice of parents for hybridization in yield improvement programmes. Hence, estimation of genetic diversity for yield and its components among genotypes is important for planning the future hybridization programme. The use of Mahalanobis’s D2 statistics for estimating genetic
divergence has been emphasized by Sarawgi and
Bisne (2007). Hence, the present investigation was carried out in the southern block of Agricultural College Farm, Bapatla to ascertain the value and magnitude of genetic diversity of 64 rice genotypes and to select suitable genotypes for further utilization in breeding programme.
Materials and methods
ISSN 0975-928X
Results and discussion
The analysis of variance showed significant differences among the genotypes for all the characters. All the 64 genotypes were grouped into nine clusters (Table 1). The distribution of 64 genotypes into 9 clusters was at random with maximum number of 30 genotypes in cluster I. Cluster III is the second largest with 11 genotypes followed by cluster II and V each with 9 genotypes. As could be seen from the results that cluster IV, VI, VII, VIII and IX were solitary clusters. The formation of distinct solitary clusters may be due to the fact that geographic barriers preventing gene flow or intensive natural and human selection for diverse and adoptable gene complexes must be responsible for this genetic diversity. These results were in accordance with Ravindrababu et al. (2006), Chandra et al. (2007), Sharma et al. (2008), Kar et al. (2013), Monohara
et al. (2013), Karuppaiyan et al. (2013) and Beevi and Venkatesan (2015).
The maximum intra cluster D2 value was 162.88 for cluster V followed by 157.77 for cluster III, 115.98 for cluster II, 108.39 for cluster I, while it was zero for clusters IV, VI, VII, VIII and IX (Table 2). The high intra cluster distance in cluster V indicated the presence of wide genetic diversity among the genotypes viz., CR 3861-37-5-3, CR 3723-3, RP 5896-88-50-9-2-2-1, CB 09 128, BPT 2507, CB 11161, RP 5714-111-34-3-1-2, PAU 3842-52-1-2-1-1 and NLR 3135. Cluster mean values showed wide range among the genotypes studied, which indicates the presence of variation among the genotypes. The maximum inter cluster D2 values ware observed between cluster VII and VIII (935.64) followed by cluster IV and IX (837.28). Based on these studies crosses may be made between genotypes of clusters VII (RNR 17472) and cluster VIII (BPT 2658) followed by genotypes of clusters IV (CN 1443-5-2-5) and IX (OR 2545-11) to obtain new desirable recombinants in rice. Intra- and inter -cluster distance of 64 rice genotypes are showed in Fig. 1.
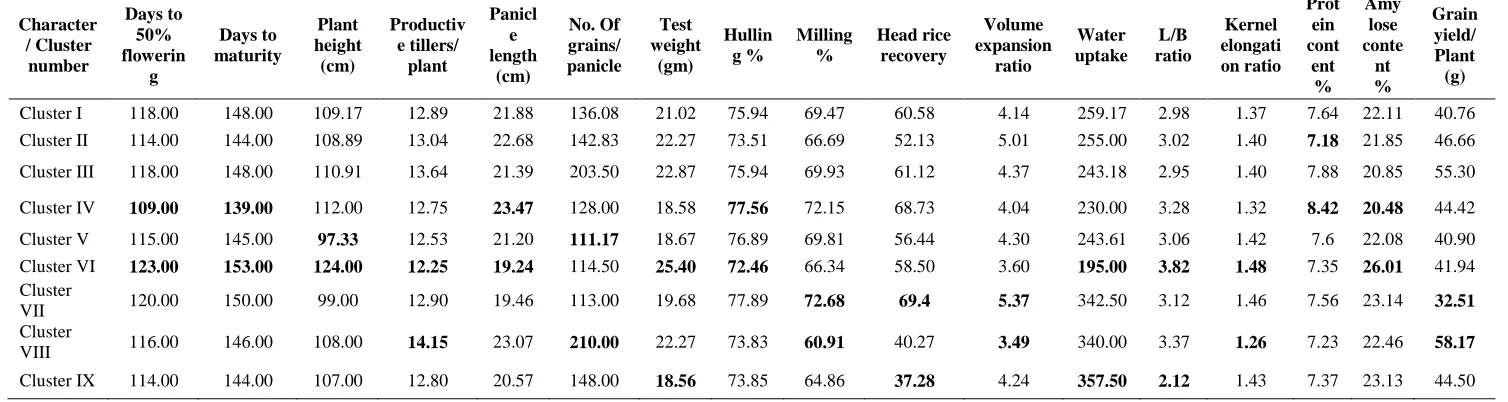
The cluster mean values for 17 characters are presented in Table 3. The data indicated a wide range of mean values between the characters. Days to 50% flowering had a range of 123 days for cluster VI to 109 days for cluster IV; days to maturity had a range of 153 days for cluster VI to 139 days for cluster IV; plant height (cm) varied from 124 cm for cluster VI to 97.33 cm for cluster V; number of productive tillers per plant had a range of 14.15 for cluster VIII to 12.25 for cluster VI; total number of grains per panicle had a range of 210 for cluster VIII to 111.17 for cluster V; test weight (g) recorded as high as 25.4 g in cluster V
recovery percentage had a range of 69.4 for cluster VII to 37.28 for cluster IX; volume expansion ratio varied from 5.37 for cluster VII to 3.49 for cluster VIII; water uptake had range of 357.50 for cluster IX to 195 for cluster VI; L/B ratio had a range of 3.82 for cluster VI to 2.12 for cluster IX; kernel elongation ratio varied from 1.48 for cluster VI to 1.26 for cluster VIII; protein percentage had a range of 8.42 for cluster IV to 7.18 for cluster II and amylose content varied as high as 26.01 for cluster VI to as low as 20.48 for cluster IV. Cluster mean values showed wide range among the genotypes studied, which indicates the presence of variation among the genotypes studied. The per cent contribution towards genetic divergence by all the 17 characters are presented in Table 4. The trait head rice recovery (29.51) showed maximum contribution towards genetic divergence followed by test weight (21.63), volume expansion ratio (13.14), milling percentage (7.09), number of grains per panicle (6.65), protein per cent (6.1), grain yield per plant (3.67), hulling percentage (3.47), plant height (2.38), L/B ratio (2.03), kernel elongation ratio (1.69), days to 50% flowering (1.24), panicle length (0.60), amylose content (0.45) and water uptake (0.35).
Acknowledgement
Necessary facilities provided by Regional Rice Research Unit- Bapatla, Agricultural College Farm-Bapatla and Acharya N.G. Ranga Agricultural University, Guntur are acknowledged.
References
Allard, R.W., 1960. Principles of Plant Breeding. John Wiley and Sons Inc., New York. 485. Beevi, A.H., and Venkatesan, M. 2015. Genetic
divergence studies in rice genotypes under saline condition. International Journal of Current Advanced Research.4: 6-8.
Chandra,. R., Pradhan, S.K., Sanjay Singh, Bose, L.K.., and Singh, O.N. 2007.Multivariate analysis in upland rice genotypes. World Journal of Agricultural Sciences. 3(3): 295-300.
Directorate, of Rice Research (DRR, Hyderabad). 2006. Laboratory Manual on Rice Grain Quality Procedures.
Kar, A.K., Das, S.R, and Bastia, D. 2013.Genetic divergence in selected indigenous aromatic rice of Odisha.Oryza. 50: 185-188.
ISSN 0975-928X
Monohara, K..K.., and Singh, N.P., 2013.Genetic divergence among rice landraces of Goa.Oryza. 50: 100-104.
Ravindrababu,V., Shreya, K., Kuldeep Singh, Dangi, Usharani and Siva Shankar, A. 2012. Correlation and path analysis studies in popular rice hybrids of india.International Jour nalo Scientificand Researc Publications.2 (3). Sarawgi, A.K and Bisne, R. 2007. Studies on genetic
divergence of aromatic rice germplasm for agro morphological and quality characters. Oryza. 44(1): 74-76.
ISSN 0975-928X
Table 1. Clustering pattern of 64 genotypes of rice (Oryza sativa L.) by Tocher’s method
.
Cluster No. No. of genotypes Name of the genotypes
I 30
CR 3727-12-1, CN 2028-5-1, CN 1406-10-2-2-1-MLD-14, CRH 102, MTU 7029, RP 5894-251-47-19-4-2-2, CRHR101, BPT 5204, RP 5878-ZGY1, OR (T) 20, PRNP-9553, CR 2690-2-2-1-1-3, RP 5897-211-69-15-9-2-2, BPT 2595, R (T) 22, OR (T) 21, CR 2681-3-2-1-1-2, PAN 830, CN 1477-19-5-3, CR 2826-1-1-1-3B-1
AD 11024, OR 2555-5, PAU 4332-30-3-3-1, CR 3813-4-10-1-1-1, CR 3862-25-7-3, CR 3813-4-4-4-3-1-2, WGL-737, RP 5895-61-19-8-4-3-2, PAU 3835-12-1-1-1
CR 3863-41-3-1
II 9 PAN 828, RP 5709-100-22-6-5-1, RP 5865-300-4-1-1-1-3-3, CR 2712-15-4, CR 3819-8-1-13-1, CR 2711-76 CR 3697-4-4-2-2-3, CB 09154, RNR 17462
III 11 NLR 3130, BPT 2270, CR 3605-4-2-1-2-1, CR 3847-1-1-2-2-1, RP 5893-136-69-17-8-7-1, NP 7060, MTU 1180, NP-9560, CRHR 32, OR 2394-22, RNR 11481
IV 1 CN 1443-5-2-5
V 9 CR 3861-37-5-3, CR 3723-3, RP 5896-88-50-9-2-2-1
CB 09 128, BPT 2507, CB 11161, RP 5714-111-34-3-1-2, PAU 3842-52-1-2-1-1, NLR 3135
VI 1 OR 2344-1
VII 1 RNR 17472
VIII 1 BPT 2658
ISSN 0975-928X
Table 2. Average intra-and inter –cluster D2 values among nine clusters in 64 rice (Oryza sativa L.) genotypes
.
Cluster No Cluster I Cluster II Cluster III Cluster IV Cluster V Cluster VI Cluster VII Cluster VIII Cluster IX
Cluster I 108.39 200.75 175.24 153.78 183.18 212.10 208.09 459.7 517.11
Cluster II 115.98 238.89 401.75 237.66 247.89 383.83 261.26 317.42
Cluster III 157.77 262.18 313.15 258.12 290.37 481.74 627.02
Cluster IV 0.00 232.77 366.96 161.36 790.07 837.28
Cluster V 162.88 395.54 277.01 456.29 383.08
Cluster VI 0.00 483.99 441.52 716.10
Cluster VII 0.00 935.64 836.48
Cluster VIII 0.00 167.60
Cluster IX 0.00
Table 3. Mean values of nine clusters by Tocher’s method for 64 genotypes of rice (Oryza sativa L.).
Character / Cluster number Days to 50% flowerin g Days to maturity Plant height (cm) Productiv e tillers/ plant Panicl e length (cm) No. Of grains/ panicle Test weight (gm) Hullin g % Milling % Head rice recovery Volume expansion ratio Water uptake L/B ratio Kernel elongati on ratio Prot ein cont ent % Amy lose conte nt % Grain yield/ Plant (g)
Cluster I 118.00 148.00 109.17 12.89 21.88 136.08 21.02 75.94 69.47 60.58 4.14 259.17 2.98 1.37 7.64 22.11 40.76 Cluster II 114.00 144.00 108.89 13.04 22.68 142.83 22.27 73.51 66.69 52.13 5.01 255.00 3.02 1.40 7.18 21.85 46.66 Cluster III 118.00 148.00 110.91 13.64 21.39 203.50 22.87 75.94 69.93 61.12 4.37 243.18 2.95 1.40 7.88 20.85 55.30 Cluster IV 109.00 139.00 112.00 12.75 23.47 128.00 18.58 77.56 72.15 68.73 4.04 230.00 3.28 1.32 8.42 20.48 44.42 Cluster V 115.00 145.00 97.33 12.53 21.20 111.17 18.67 76.89 69.81 56.44 4.30 243.61 3.06 1.42 7.6 22.08 40.90 Cluster VI 123.00 153.00 124.00 12.25 19.24 114.50 25.40 72.46 66.34 58.50 3.60 195.00 3.82 1.48 7.35 26.01 41.94 Cluster
VII 120.00 150.00 99.00 12.90 19.46 113.00 19.68 77.89 72.68 69.4 5.37 342.50 3.12 1.46 7.56 23.14 32.51 Cluster
VIII 116.00 146.00 108.00 14.15 23.07 210.00 22.27 73.83 60.91 40.27 3.49 340.00 3.37 1.26 7.23 22.46 58.17 Cluster IX 114.00 144.00 107.00 12.80 20.57 148.00 18.56 73.85 64.86 37.28 4.24 357.50 2.12 1.43 7.37 23.13 44.50
ISSN 0975-928X
Table 4. Contribution of different characters towards genetic divergence among 64 genotypes of rice (Oryza sativa L.).
Character %Contribution towards divergence
Days to 50% flowering 1.24
Days to maturity 0.00
Plant height (cm) 2.38
Productive tillers per plant 0.00
Panicle length (cm) 0.60
Grain yield per plant (g) 3.67
Number of grains per panicle 6.65
Test weight(gm) 21.63
Hulling % 3.47
Milling % 7.09
Head rice recovery 29.51
Volume expansion ratio 13.14
Water uptake 0.35
L/B ratio 2.03
Kernel elongation ratio 1.69
Protein content % 6.10
ISSN 0975-928X
Fig 1. Intra-and Inter-cluster distances of 64 rice (OryzaL.) in nine clusters based on Euclidean2 distances