R E S E A R C H
Open Access
An applied statistical method to identify
desertification indicators in northeastern
Iran
Mehdi Sarparast
1, Majid Ownegh
1, Ali Najafinejad
1and Adel Sepehr
2*Abstract
Background:Desertification could be considered ultimate consequence of land degradation in an ecosystem. Iran with more than 75% arid and semi-arid areas involves fragile and susceptible ecosystems to desertification. We applied a statistical algorithm including regression trees and random forest techniques for determining main factors affecting desertification based on ESAs in Taybad-Bakharz region at northeastern Iran.
Results:The results indicated a significant correlation between the desertification hazard value with variables of wind erosion, precipitation, aridity index, technology development, slope index, vegetation state and land use changes.
Conclusions:Regression trees and random forest techniques in desertification hazard provide an absolute
estimation of the relationship between dependent and independent variables. We can use a robust base for further investigations and refined with findings from in-depth studies carried out at the local scale.
Keywords:Desertification hazard, Regression trees, Random forest, Data mining
Background
In recent decades, the challenges of environment regard-ing dryregard-ing lake, groundwater depletion, land fissures, drought, migration, poverty etc. are highlighted in heart of Middle East, Iran, with more than 3000 years civilization. All of mentioned threatens indicated that civilization is collapsing due to ecosystem degradation particularly in arid areas. These consequences can be briefed in a word“desertification”.
If no remedial action is taken, desertification rate will be increasing significantly and threaten sustainable liveli-hoods at least for people of arid and semi-arid regions of Iran, areas with more than 75% expansion in Iran. Detecting, distinguishing and mitigation of the outcomes of desertification and finding main parameters affecting desertification rate in an area is most effective step in ac-tion plans of combating desertificaac-tion (UNCCD,1994).
Many methods such as mathematical models, para-metric equations, remote sensing, direct observation,
and measurements have suggested assessing desertifica-tion hazard in different regions of the world (Sepehr et al.2007). In relation to desertification risk mapping, as-sessment, and forecasting, many studies can be found that mainly are based on empirical and regional models. European project of ESAs (Environmental Sensitive Areas) team that called MEDALUS (Mediterranean Desertification and Land Use) is one of the regional frameworks to detect sensitive areas regarding desertifi-cation risk in Mediterranean region (Kosmas et al. 1999). Ladisa et al. (2012), applied this method for asses-sing desertification risk in Apulia region, southeastern Italy and reported that this method shows efficient out-put regarding desertification vulnerability and detecting sensitive environments. Leman et al.2016 used the GIS-based integrated evaluation model base on ESAs on two assessment sets in Langkawi, Malaysia. “Set A included indicators chosen from Malaysian integrated ESA tool1 and set B involved indicators derived from five eco-environments in China. The results showed Set A in order to reveal environmental sensitivity is more appro-priate and more efficient than Set B”. There is miscel-laneous reports regarding application of the ESAs
* Correspondence:[email protected]
2Department of Desert and Arid Zones Management, Ferdowsi University of
Mashhad, Mashhad, Iran
Full list of author information is available at the end of the article
method to detect sensitive areas to desertification, such as Wijitkosum (2016), De Pina Tavares et al. (2015), and Sepehr et al. (2007). The common point of all these arti-cles is the high efficiency of ESAs method for recognizing desertification-prone areas. Heretofore, many studies have been done regarding desertification risk assessment and fore-casting, and in the majority of those emphasized on regional and empirical indicators and methods (Martínez-Valderrama et al. 2016; Ferrara et al. 2012; Karamesouti et al. 2015; Patriche and Bandoc2017; Patriche et al.2017; Salvati et al. 2016; Zambon et al.2017).
Data mining knowledge, as a logical process for find-ing useful data through large amount of data, and
par-ticularly regression technique can be used for
modeling the relationship between one or more inde-pendent variables and deinde-pendent variables (Ramageri 2010). For example, the regression tree and random forest techniques as two relatively new tree-based models optimized predictive performance by combin-ing a large number of simple trees into a powerful model rather than a single tree model based on trad-itional regression trees (Skurichina and Duin 2002). Yang et al. (2016) used regression tree and random forest model to map topsoil organic carbon concentra-tion in an alpine ecosystem. Their results showed that the two methods can be used as strong and effective modeling approaches in the mapping of soil organic matter concentration. This article aims to investigate correlation between desertification indicators and choosing main indicators affecting desertification by regression statistical methods based on ESAs frame-work in northeastern Iran. The most important indices
participating in desertification risk were identified by regression tree and random forest techniques.
Methods
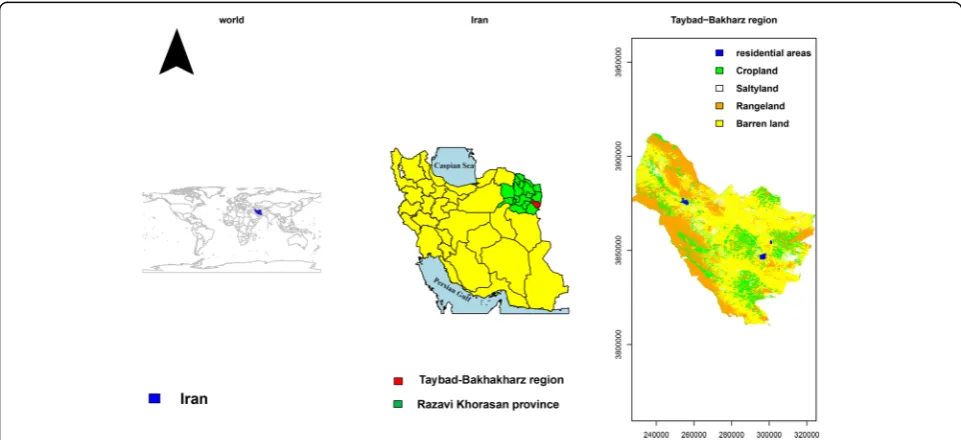
Study area
This study was applied in Taybad-Bakharz located in an arid and semi-arid environment of Khorasan Razavi prov-ince, northeastern Iran with an area of 4800 km2(Fig.1). The livelihood of rural communities of the studied region is depends on livestock and farming. Precipitation varies between 100 and 250 mm based on topographic condi-tions with a wide temporal and spatial distribution. Mean annual temperature is about 16 °C, during the day in sum-mer, temperature goes up 42 °C, and actual evapotranspir-ation changes between 800 and 2100 mm per year. The wind velocity ranges from 5.3 to 6.8 m/s, with the max-imum occurring in May approximately 6 m/s. Moreover, over 120 days per year have wind. Additional file1shows the digital elevation model (DEM) of the studied area.
Calculating desertification hazard index
Interaction between main driving force factors and spatial-temporal changes of main factors have been led to desertification in the studied area. To select main criteria expert’s opinions were taken by Delphi decision-making framework. We applied the ESAs method to detect desertification-prone areas based on modified main criteria and indicators. Choosing and providing the indicators were according to the avail-able information and maximum influence on desertifi-cation process in the region. To map layers ArcGIS;
version 10.2 and R software; packages of raster, sp., rgdal, maptools, and lulcc were used.
According to the ESAs, the quality of each criteria was provided by geometric mean of considered effective indi-cators on criteria quality. Eq. 1 shows the relation used to calculate criteria quality index by geometric mean of indicators.
QI¼Xn
i¼1¼
ffiffiffiffiffiffiffiffiffiffiffiffiffiffiffiffiffiffiffiffiffiffiffiffiffiffiffiffiffiffiffiffiffiffiffiffiffiffiffiffiffiffiffiffiffi X1X2…;Xn n
p
ð1Þ
Where QI is criteria quality index and X showing indi-cators affecting the quality of each criterion.
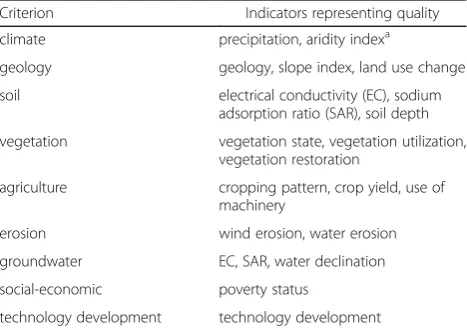
Nine (9) main criteria affecting desertification suscep-tibility were chosen with indicators regarding the quality of each criterion. The criteria and indicators illustrated in Table 1. The quality layers were classified in four quantitative and qualitative classes as shown in Table2. An interval weighing was considered between 0 and 4 for the quantitative value of qualitative status of each criterion.
After providing the quality layer for each criterion in-volving nine quality layers, desertification hazard index was calculated by geometric mean of quality layers as shown eq.2.
DH¼ðCQISQIGQIAQIVQIS−EQIEQITQIGWQIÞ1=9
ð2Þ
where DH is desertification hazard value, and CQI, SQI, GQI, AQI, VQI, S-EQI, EQI, TQI, GWQI respectively refer to quality of climate, soil, geology, agriculture, vegetation, socio-economic, erosion, technology develop-ment, and ground water.
A land unit map (LUM) was considered for investiga-tion of quality of each criterion and desertificainvestiga-tion status based on geomorphological facies. For providing LUM, imagery data of LANDSAT (TM and ETM+) were used (Landsat satellites). The reason for choosing geomorph-ology facies for LUM and calculating the status of each criterion and desertification risk in each of study unit is the relation to the slow changes of surface morphology during short time vs rapid changes of land-cover and land-use due to human activities particularly in recent decade in the studied region.
Regression trees
To identify the most effective criteria and indicators on desertification hazard, we applied CART (classification and regression tree) analysis. Classification and regression tree model is a nonparametric method introduced by Breiman et al. (1984). This method is able to predict the quantitative variables (regression tree) and classification variables (classi-fication tree) based on a set of qualitative and quantitative variables (Yeh 1991). A classification or regression tree model has been formed from the several branches and some nodes. The first node that includes all the sam-ples is called the parent node. Other nodes are called child nodes. Then, based on one of the predictor var-iables, two branches take place and this situation con-tinues to the end node (Frisman 2008). Another parameter is pruning the tree structure and selecting the appropriate size of the tree. The CART analysis was done using R software (apart and rpart.plot packages).
Random Forest
Random forest is a non-parametric method and belongs to the collection methods that were obtained from ma-chine learning methods in the late nineteenth century (Catani et al, 2013; Pourghasemi and Kerle, 2016). This algorithm is a set of classification and regression trees developed by Breiman (2001). Breiman proposed ran-dom forests, which add an additional layer of ranran-domness to bagging (Liaw and Wiener2002). To perform this pro-cedure, several parameters must be determined. The first parameter is the number of predicting trees. In this study, 500 trees were created. The second parameter is the num-ber of the predictor variable with no need to prune trees Table 1Main criteria affecting desertification and considered
indicators for quality degree of criteria
Criterion Indicators representing quality
climate precipitation, aridity indexa
geology geology, slope index, land use change
soil electrical conductivity (EC), sodium
adsorption ratio (SAR), soil depth
vegetation vegetation state, vegetation utilization, vegetation restoration
agriculture cropping pattern, crop yield, use of
machinery
erosion wind erosion, water erosion
groundwater EC, SAR, water declination
social-economic poverty status
technology development technology development
a
Aridity index was calculated by ratio of annual rainfall to potential of evapotranspiration proposed by FAO/UNEP for global desertification map AI=P/ETP (UNEP1992)
Table 2Quantitative and qualitative classes of criteria and desertification hazard
class Interval score Sensitive degree to desertification
Desertification Hazard
1 0–1.5 Low Low
2 1.6–2.5 Medium Moderate
3 2.6–3.5 High High
in classification. The proximity matrix was used for identi-fying structure in the data (Breiman2002). The Random Forest package provides an R interface to the Fortran pro-grams by Breiman and Cutler (available at https:// www.stat.berkeley.edu/~breiman/).
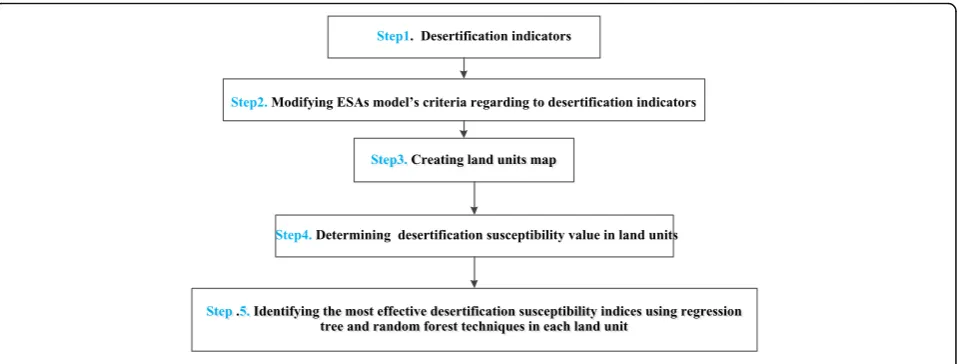
After calculating desertification hazard index, regression trees and random forest technique was applied for identify-ing preference of main criteria affectidentify-ing desertification. The sample population involved 25 land units provided based on geomorphology facies with 21 variables including indica-tors considered for criteria quality as independent variables and desertification hazard as dependent variable. The flow-chart of methodology applied in this study is shown in Fig.2.
Results and discussion
Desertification hazard areas
The desertification status was calculated on each of sep-arated land units. The Kavir areas (salty-clay pans and Sabkha) are smallest zones and low-level pediment fan and valley terrace deposits cover largest areas in the studies region as shown in Table 3 and Fig. 3. Further-more, most geomorphology facies involve badlands and pediment deposits surfaces and concentrated on the east and northwest region, where land-use is mainly agricul-ture and cultivated areas. The geology map of the stud-ied region shown in the Additional file2.
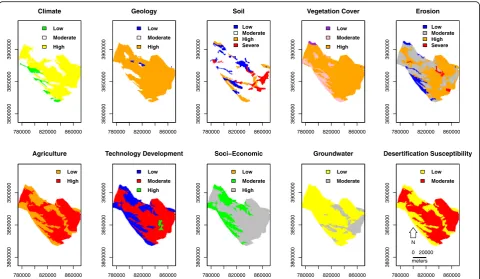
Results indicated that regarding climate criterion the studied area classified in high vulnerable to desertifica-tion hazard, in othe word shows a high-risk class of desertification as 65% of the studied area are susceptible in relation to climate factors. The results showed that in-dicators considered for geology criterion are main fac-tors affecting desertification, so that about 88% areas are prone-area to desertification. In addition, the criteria of vegetation and agriculture show undesirable conditions as well as 85% areas considered desertification-prone
area regarding vegetation, where it is 63% for agriculture indicators. In terms of the technology development, 80% of the study area gained moderate class of desertification hazard. Erosion criterion including wind and water ero-sion indicated that 57% of study area are classified in high-risk desertification class for wind erosion and 63% areas shows high level for water erosion. Moderate conditions classified regarding groundwater and soil criteria. Therefore, based on impact degree of indicators regarding desertification susceptibility, more than 20% of Taybad-Bakharz region shows susceptible and prone area to desertification. Ultimately, a desertification suscepti-bility classified in two sensitivity levels involving moder-ate degree with 37% of the area, and high degree with 63% of the areas. The classification categories of the indices and desertification hazard in the form of the map are shown in Fig. 4. It should be noted that all of layers and maps were classified into four classes based on Table3. The output maps have been presented based on gained classes, for example for the geology and cli-mate criteria, the desertification does not show severe class, so this class was ignored in the legend while for erosion criterion, the legend includes all of the classes as it gained all of the desertification risk classes.
Regression tree outcomes
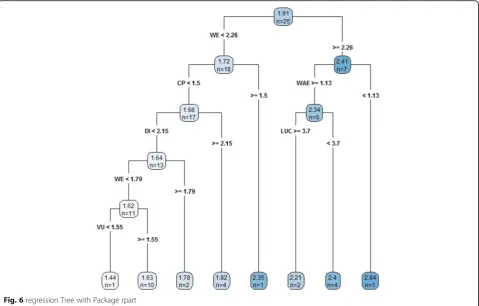
The results of CART for the 21 targets outcome variables-desertification hazard are presented in Figs. 5, 6, and 7, respectively. Figures 6 and 7 includes the predictor vari-ables and the value that split each subgroup. Within each node, the mean score or proportion of participants in each response category are presented.Figure 5shows the com-plexity parameter (cp) option of the summary function that instructs it to prune the printout, but it does not prune the tree. The cp shows minimum error so that the regression tree is pruned by cp wherever the error shows
minimum amount, the regression tree is pruning. The pruning based on cp is a validation test in regression tree, indeed before regression; a training was used by 30% of total data. For more information the raw data used in stat-istical methods has been presented in Additional file3.
In the Fig. 6, n shows the land units and means the amount of the polygons which was determined based on
geomorphology map (geology and morphology maps). All of indicators were evaluated in each land units (poly-gone) separetely.
Given to the Fig. 6, the first split for desertification hazard status is based on the score of the wind erosion index. The subgroup that represented higher hazard tak-ing scores (< 2.26, > = 2.26) and was further split based on water erosion and then land use change status on the left (This subgroup does not split again). Also, crop pat-tern status and the next split that was related to the aridity index and vegetation utilization indices (on the right). Vegetation utilization and land-use change cri-teria showed relatively lower correlation with desertifica-tion hazard value.
In Fig. 7, Parent group shows the desertification risk with mean 1.92, the children group presents the erosion status including water and wind erosion. The water ero-sion is a sub-tree or a branch. The highest correlation was obtained between wind erosion and desertification. The water erosion only involves one branch and its division does not continue in regression tree. The crop pattern shows highest correlation with wind erosion with continuous division and after that, aridity index indicates correlation with crop pattern. Therefore, desertification risk is affective by wind erosion with a powerful correl-ation with crop patterns and aridity index. In addition, as water erosion shows a weakness correlation, we can have a judgement that wind erosion has most powerful correlation with desertification in all of land units.
The regression tree used when we have numerical var-iables. This method tries to recognize highest correlation between variables by using Gini coefficient, Chi-square, Table 3Frequency and distribution of geomorphological facies
(lands unit) in Taybad-Bakharz area Land
unit
Geomorphological facies Area (ha) % Frequency
1 Rocky outcrop (Sandstone and sandy limestone)
1387 0.3 1
2 Rocky outcrop (Conglomerate and sandstone)
1050 0.22 1
3 Rocky outcrop (Pale red marl and gypsiferous marl)
16,057 3.0 1
4 Rocky outcrop (Andesitic to basaltic volcanic tuff)
1165 0.25 1
5 Rocky outcrop (Andesitic volcanosediment)
3238 0.7 1
6 Rocky outcrop (Andesitic volcanic tuff)
15,710 3.3 1
7 Rocky outcrop (Dacitic to Andesitic tuff)
2638 0.55 1
8 Rocky outcrop (Rhyolitic to rhyolitic tuff)
3295 0.7 1
9 Rocky outcrop (Rhyolitic to rhyolitic volcanic)
9273 2.0 2
10 Rocky outcrop (Granite) 4864 1.0 2
11 Rocky outcrop (Red marl, gypsiferous marl)
5363 1.2 1
12 Hills with gully erosion 10,000 2 4
13 Badland 41,000 8.7 9
14 Rocky outcrop (debris) 12,900 2.7 3
15 Eroded Inselberg 9980 2.0 3
16 Hills 10,000 2.0 4
17 Rocky outcrop (Gneiss, granite, amphibolite)
7600 1.6 2
18 Clay flat 21,700 4.5 3
19 High level pediment fan and valley terrace deposits (semi-Cultivated)
52,950 11.2 12
20 Low-level pediment fan and valley terrace deposits (Cultivated)
222,900 47 9
21 Sand dune (semi-active) 7220 1.5 1
22 Irregular aspect 4325 1 1
23 Inselberg 4847 1 1
24 Low-level piedmont fan and playa
5480 1.2 1
25 Kavir (Salty-clay pan, Sabkha) 230 .1 1
MSE, and entropy. The Gini coefficient find homogeny variable and regression tree will be found correlations based on mean of variables. The regression presents a classification by Gini coefficient by number of successes and failures.
The cross-validation shows only a small difference in desertification hazard status. Given to the regression trees outcomes, among 21 independent variables, indica-tors such as wind erosion, precipitation, soil EC, soil tex-ture, groundwater (SAR) and slope had the greatest
impact on desertification hazard, respectively. These in-dicators are highly associated with the value of desertifi-cation hazard. Wind erosion and cropping pattern indices in 18 land units are identified as the most im-portant factor affecting desertification hazard. Also, arid-ity index is listed as the most important factors of desertification in 13 land units. Although, water erosion index have less impact on the hazard of desertification (7 land units). Finally, wind erosion, cropping pattern, aridity index and precipitation are identified as the most
780000 820000 860000
3800000 3 850000 3900000 Climate Low Moderate High
780000 820000 860000
3800000 3 850000 3900000 Geology Low Moderate High
780000 820000 860000
3800000 3850000 3900000 Soil Low Moderate High Severe
780000 820000 860000
3800000 3850000 3900000 Vegetation Cover Low Moderate High
780000 820000 860000
3800000 3 850000 3900000 Erosion Low Moderate High Severe
780000 820000 860000
3800000 3 850000 3900000 Agriculture Low High
780000 820000 860000
3800000 3 850000 3900000 Technology Development Low Moderate High
780000 820000 860000
3800000 3850000 3900000 Soci−Economic Low Moderate High
780000 820000 860000
3800000 3850000 3900000 Groundwater Low Moderate
780000 820000 860000
3800000 3850000 3 900000 Desertification Susceptibility Low Moderate 0 20000 meters N
Fig. 4desertification susceptibility areas for main indicators. Desertification susceptibility map provided based on preference degree of each indicators
important indicators that affected desertification hazard in this region.
Random Forest outcome
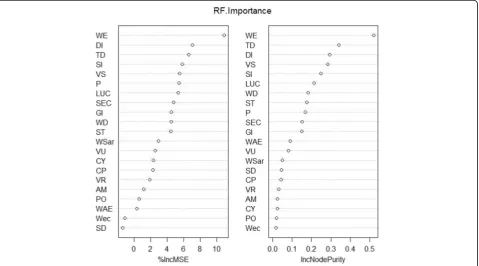
The results from the variable selection random forest are shown in Figs. 8 and 9. Independent variables in-volving 21 indicators ordered based on mean decrease accuracy. The accuracy measure determined main effective criteria including wind erosion, technology
development, aridity index, slope index, soil EC, land-use changes, vegetation state, precipitation, geology, water declination, and soil texture. Moreover, based on variable importance for the RF-model, we observed that wind erosion, technology development, aridity index, slope index, vegetation state and land-use change variables are relatively most important on desertification hazard of Taybad-Bakharz region, respectively. The important per-cent values of these variables measured 10.48%, 7.5%, 6.8%, 5.9% 5.3%, and 5.2% respectively.
Fig. 6regression Tree with Package rpart
As shown in Fig. 8, in forest random method, at the first will be created classification trees that called tree of vote. The forest will be decided and classified base on the most vote, then average of tree’s outcome presents the regression. In Fig. 9, the preference of each variable was calculated by mean square error (MSE) and purity or entropy degree. The less MSE indicates an indicator with more preference.
Conclusions
Land degradation and desertification consequences such as dust storms, drying of lakes, water scarcity, poverty
and migration, and ultimately ecosystem collapse in Iran with more than 75% drylands require a carefully under-standing of the desertification process and recognizing driving forces. This study examines the performance of a statistical method to identify the most important criteria affecting desertification process and risk. Studied region showed desertification-prone areas with 63% high-risk level of desertification. Application of regression trees and random forest techniques identified the most important criteria affecting desertification and recog-nized that indicators such as wind erosion, technology de-velopment, aridity index, slope index, precipitation,
Fig. 8plot showing the decrease of (in terms of out-of-bag classification errors, OOBE) OOBE with increasing number of trees T# in the RF structure. A working value of T# = 300 was chosen for the RFtb model structure used in the tests and experiments
vegetation state and land use change are major indicators affecting the quality of criteria and desertification in the Taybad-Bakharz. The results of this research indicated that erosion factors including water and wind erosion are the most important desertification factors in the studied area. Over-grazing and vegetation degradation in the re-gion particularly in recent decade led to degraded soils and decreasing fertility, so the erosion rate is raising in the study area. Data mining process and particularly regres-sion trees and random forest technique in desertification hazard can be recommended as a robust base for further investigation of desertified lands for best management of processes in these areas.
Endnotes
1
- Tool in this research used for indicators system
Additional files
Additional file 1:Digital Elevation Model (DEM) of studied area. (JPEG 125 kb)
Additional file 2:Geology map of Taybad-Bakharz in northeastern Iran. (JPEG 134 kb)
Additional file 3:The raw data used in statistical algorithms. (CSV 3 kb)
Abbreviations
CART:Classification And Regression Tree; cp: Complexity Parameter; ESAs: Environmental Sensitive Areas; LUM: Land Unit Map;
MEDALUS: Mediterranean Desertification and Land Use; MSE: Mean Square Error; OOBE: Out-Of-Bag classification Errors
Acknowledgements
The authors are thanks from administration of Natural Resources and Environment College, Ferdowsi University of Mashhad for supporting and providing the facilities, particularly Dr. Naseri and Dr. Mosaedi who are head of college and vice-head separately.
Funding
The Gorgan University of Agricultural Sciences and Natural Resources and Iran science and technology ministry provided the funding of this research.
Availability of data and materials
Not applicable.
Authors’contributions
MS conducted the fieldwork and contributed to the analysis of the data as well as in writing the first draft. MO is a supervisor for the research, and AN is an adviser. AS supervised data analysis and contributed in revising the manuscript and providing the final draft. He is corresponding the research. All authors read and approved the final manuscript.
Competing interests
The authors declare that they have no competing interests.
Publisher’s Note
Springer Nature remains neutral with regard to jurisdictional claims in published maps and institutional affiliations.
Author details
1Gorgan University of Agricultural Sciences and Natural Resources, Gorgan,
Golestan, Iran.2Department of Desert and Arid Zones Management,
Ferdowsi University of Mashhad, Mashhad, Iran.
Received: 27 May 2017 Accepted: 23 February 2018
References
Breiman, L., J. Friedman, C.J. Stone, and R. Olshen. 1984.Classification and regression trees. CRC press, Taylor and Francis Group. pp. 246–280. Breiman, Leo. 2001. Manual on Random Forests. University of California. p. 33.
https://www.stat.berkeley.edu/~breiman/randomforest2001.pdf. Breiman, Leo. 2002.Manual on setting up, using, and understanding random
forests. Vol. v3.1https://www.stat.berkeley.edu/~breiman/.
Catani, F., D. Lagomarsino, S. Segoni, and V. Tofani. 2013. Landslide susceptibility estimation by random forests technique: Sensitivity and scaling issues. Natural Hazards and Earth System Sciences13 (11): 2815–2831. De Pina Tavares, J., I. Baptista, A.J.D. Ferreira, P. Amiotte-Suchet, C. Coelho, S.
Gomes, R. Amoros, E.A. Dos Reis, A.F. Mendes, L. Costa, J. Bentub, and L. Varela. 2015. Assessment and mapping the sensitive areas to desertification in an insular Sahelian mountain region case study of the Ribeira Seca watershed, Santiago Island, Cabo Verde.Catena128: 214–223.https://doi. org/10.1016/j.catena.2014.10.005.
Ferrara, A., L. Salvati, A. Sateriano, and A. Nolè. 2012. Performance evaluation and cost assessment of a key indicator system to monitor desertification vulnerability.Ecological Indicators23: 123–129https://doi.org/10.1016/j. ecolind.2012.03.015.
Frisman L. (2008) App lying classification and regression tree analysis to identify Priso Ners with high lllV risk Behaviorst. 40 (December).
Karamesouti, M., V. Detsis, A. Kounalaki, P. Vasiliou, L. Salvati, and C. Kosmas. 2015. Catena land-use and land degradation processes affecting soil resources : Evidence from a traditional Mediterranean cropland (Greece).Catena132: 45–55.https://doi.org/10.1016/j.catena.2015.04.010.
Kosmas, C., M. Kirkby, and N. Geeson. 1999.The MEDALUS project Mediterranean desertification and land use; manual on key indicators of desertification and mapping environmentally sensitive areas to desertification. Brussels: European Commission.
Ladisa, G., M. Todorovic, and L. Trisorio. 2012. A GIS-based approach for desertification risk assessment in Apulia region, SE Italy.Physics and Chemistry of the Earth49: 103–113.https://doi.org/10.1016/j.pce.2011.05.007. Leman, N., M.F. Ramli, and R.P. Khairani Khirotdin. 2016. GIS-based integrated
evaluation of environmentally sensitive areas (ESAs) for land use planning in Langkawi, Malaysia.Ecological Indicators61: 293–308.
https://doi.org/10.1016/j.ecolind.2015.09.029.
Liaw, A., and M. Wiener. 2002. Classification and regression by randomForest.R news2 (December): 18–22.
Martínez-Valderrama, J., J. Ibáñez, G. Del Barrio, M.E. Sanjuán, F.J. Alcalá, S. Martínez-Vicente, A. Ruiz, and J. Puigdefábregas. 2016. Present and future of desertification in Spain: Implementation of a surveillance system to prevent land degradation.Sci Total Environ.563–564: 169–178.https://doi.org/10. 1016/j.scitotenv.2016.04.065.
Patriche, C., and G. Bandoc. 2017. Quantification of land degradation sensitivity areas in southern and central southeastern Europe. New results based on improving DISMED methodology with new climate data.Catena158: 309–320.https://doi.org/10.1016/j.catena.2017.07.006. Patriche, C., M. Dumitra, and G. Bandoc. 2017. Catena spatial assessment of land
degradation sensitive areas in southwestern Romania using modi fi ed MEDALUS method. 153: 114–130.https://doi.org/10.1016/j.catena.2017.02.011. Pourghasemi, H.R., and N. Kerle. 2016. Random forests and evidential belief function-based landslide susceptibility assessment in western Mazandaran Province , Iran. Environmental Earth Sciences.https://doi.org/10.1007/s12665-015-4950-1. Ramageri, M. 2010. Data mining techniques and applications.Indian J Comput Sci
Eng1 (4): 301–305.
Salvati, L, Kosmas C, Kairis O, Karavitis C, Acikalin S, Belgacem A, Chaker M, Fassouli V, Gokceoglu C, Gungor H, Hessel R, Sol A, Khatteli H, Kounalaki A, Laouina A, Ocakoglu F, Ouessar M, Ritsema C, Colantoni A, Carlucci M (2016) Assessing the effectiveness of sustainable land management policies for combating deserti fi cation : A data mining approach 183, 754–762.https:// doi.org/10.1016/j.jenvman.2016.09.017.
Sepehr, A., A.M. Hassanli, M.R. Ekhtesasi, and J.B. Jamali. 2007. Quantitative assessment of desertification in south of Iran using MEDALUS method. Environmental Monitoring and Assessment134 (1–3): 243–254.
UNCCD. 1994.Elaboration of an international convention to combat desertification in countries experiencing serious drought and/or desertification, particularly in Africa, 1–58 (June).http://www2.unccd.int/.
UNEP. 1992.World atlas of desertification. London: Edward Arnold. Wijitkosum, S. 2016. The impact of land use and spatial changes on
desertification risk in degraded areas in Thailand.Sustainable Environ Res26 (2): 84–92.https://doi.org/10.1016/j.serj.2015.11.004.
Yang, R.M., G. Zhang, F. Liu, Y. Lu, F. Yang, F. Yang, M. Yang, Y.G. Zhao, and D.C. Li. 2016. Comparison of boosted regression tree and random forest models for mapping topsoil organic carbon concentration in an alpine ecosystem. Ecological Indicators60: 870–878.https://doi.org/10.1016/j.ecolind.2015.08.036. Yeh, Chyon-Hwa. 1991. Classification and regression trees (CART).Chemometrics
and Intelligent Laboratory Systems12 (1): 95–96. https://doi.org/10.1016/0169-7439(91)80113-5.