ORIGINAL ARTICLE
Characteristics of Eddy Current Attenuation
and Thickness Measurement of Metallic Plate
Zhiwei Zeng
1*, Pengcheng Ding
1, Jiayi Li
1, Shaoni Jiao
1, Junming Lin
2and Yonghong Dai
2Abstract
In eddy current testing, the law of attenuation of eddy current (EC) is of great concern. In conductive half space under the excitation of uniform magnetic field, the EC density decreases exponentially in the depth direction. However, in conductor with finite thickness tested by coil, the distribution of EC in the depth direction is more complicated. This paper studies the characteristics of EC attenuation in metallic plate of finite thickness. Simulation results show that there is an EC reflection at the bottom of plate, which changes the law of EC attenuation. A new concept, namely the equivalent attenuation coefficient, is proposed to quantify the speed of EC attenuation. The characteristics of EC attenuation are utilized to explain the nonmonotonic relation between coil voltage and plate thickness. Procedure of selecting frequency is discussed. Thereafter, measurement of plate thickness is carried out and accurate result is obtained.
Keywords: Eddy current testing, Attenuation of eddy current, Thickness measurement, Metallic plate
© The Author(s) 2019. This article is distributed under the terms of the Creative Commons Attribution 4.0 International License (http://creat iveco mmons .org/licen ses/by/4.0/), which permits unrestricted use, distribution, and reproduction in any medium, provided you give appropriate credit to the original author(s) and the source, provide a link to the Creative Commons license, and indicate if changes were made.
1 Introduction
Eddy current testing (ECT) which is based on the princi-ple of electromagnetic induction is regarded as an effec-tive nondestruceffec-tive testing method [1]. It can be used to detect surface [2, 3] and subsurface [4, 5] defects in conductive materials and measure thicknesses [6, 7] of metallic plates.
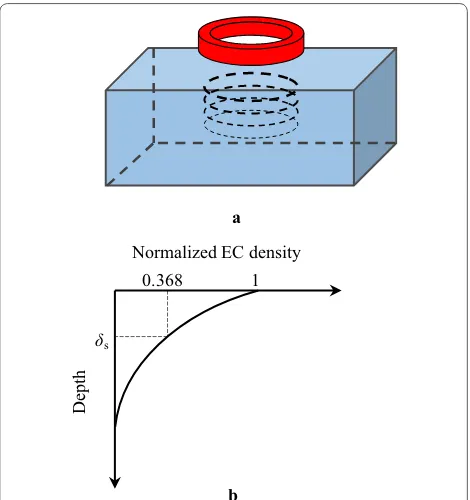
It is well known that eddy current (EC) density is maxi-mal on conductor surface and decreases exponentially along the depth direction, which is called skin effect [8, 9]. Figure 1(a) illustrates the skin effect, in which the dashed circles represent the EC flows at various depths and larger thickness of circle means larger amplitude of EC density. The capability of EC penetration is deter-mined by the speed of attenuation of EC [10, 11]. The speed of attenuation of EC is related to the reduction of the normalized EC density per unit depth rather than referring to the absolute value of EC density, in which the normalized EC density is computed by dividing the amplitude of EC density by the value on the conductor
surface. Thus, the speed of attenuation of EC is independ-ent of the intensity of the excitation currindepend-ent. The depth at which the normalized EC density equals 1/e (36.8%) is referred to as skin depth and is illustrated in Figure 1(b). A prior knowledge of skin depth is of great concern when detecting subsurface defects and measuring thicknesses of plates.
In isotropic conductive half space under the excitation of uniform magnetic field, the relation between normal-ized EC density J / J0 and depth d is
where a is the attenuation coefficient. The skin depth denoted as δS , is given by
where f is the excitation frequency, μ is the permeability, σ is the conductivity. This skin depth is referred to as the standard skin depth.
It is found that the skin depth of EC in conductive plate with infinite thickness under the excitation of pancake coil can have a large difference from the standard skin depth [10]. The discrepancy is attributed to the diffusion (1) J/J0=e−αd,
(2) δS=
1
α =
1
πfµ σ
,
Open Access
*Correspondence: [email protected]
1 School of Aerospace Engineering, Xiamen University, Xiamen 361005,
China
effect and the combined cancellation/diffusion effect of EC and is greatly dependent on the geometric parameters of pancake coil, as explained in Ref. [11].
In the available references discussing skin effect in ECT [10, 11], the test samples are assumed to have large thick-nesses such that the EC densities at the bottom surfaces are very small and can be neglected. In many applications of ECT, however, the test samples have finite thicknesses and the EC densities at the bottom surfaces cannot be neglected. Study on the characteristics of EC attenu-ation in flat plate of finite thickness is not found. This paper attempts to fill in the blank. We utilizes the finite element analysis software AxisymMag [12] developed in lab for solving axisymmetric magnetic field problems to compute EC densities. The software has been verified by comparing computation results with analytical solutions [12].
The Aφ formulation [13] is used in the paper where Aφ is the circumferential component of the modified mag-netic vector potential. The governing equation is
where ν is the reluctivity of the material, σ is the conduc-tivity, and Jsφ is the circumferential component of the excitation current density. Eq. (3) is solved by the Galer-kin method.
(3)
−ν∂
2 Aφ
∂z2 +ν Aφ
ρ2 −
ν ρ
Aφ
∂ρ −ν ∂2Aφ
∂ρ2 +σ
∂Aφ
∂t =Jsφ,
The paper then studies the measurement of plate thick-ness. Thickness is an important variable that plays an essential role in controlling product performance and cost [14, 15]. Methods for thickness measurement have been presented in literature. Model based approaches seek for plate thickness by comparing measured signal with model predicted signal and updating plate thick-ness in the model by certain optimization methods [16, 17]. The approaches have been applied in measuring thicknesses of conducting plates [18, 19], coatings [20, 21] and air gaps in aeronautical multilayered structures [22, 23]. Feature based methods measure plate thick-ness based on the analysis of signal characteristics. Sig-nal features can be sigSig-nal phase [24, 25] and amplitude [26, 27] in sinusoidal ECT or peak value [28, 29] and rise time [30, 31] in pulsed ECT. Other features include the no-reference-needed feature [32] and the frequency-to-zero feature [33]. This paper uses sinusoidal excitation and selects voltage amplitude as the feature for thickness measurement.
In short, the paper investigates the characteristics of attenuation of EC in the depth direction in metallic plate of finite thickness tested by pancake coil. Based on this, measurement of plate thickness is studied.
2 Characteristics of EC Attenuation in Metallic Plate
Figure 2 shows the geometrical model of ECT of metal-lic plate. The plate is assumed to be infinitely large in the directions parallel to the conductor surface. Therefore the model can be regarded as axisymmetric. The dimen-sions of the pancake coil are also shown in the figure. The density of the excitation current is 3.077 × 10⁶ A/m2. The
material of the test sample has a conductivity of 2.0 × 10⁷
S/m and a relative permeability of 1. The thickness of the plate and the working frequency are variable.
2.1 Analysis of EC Density
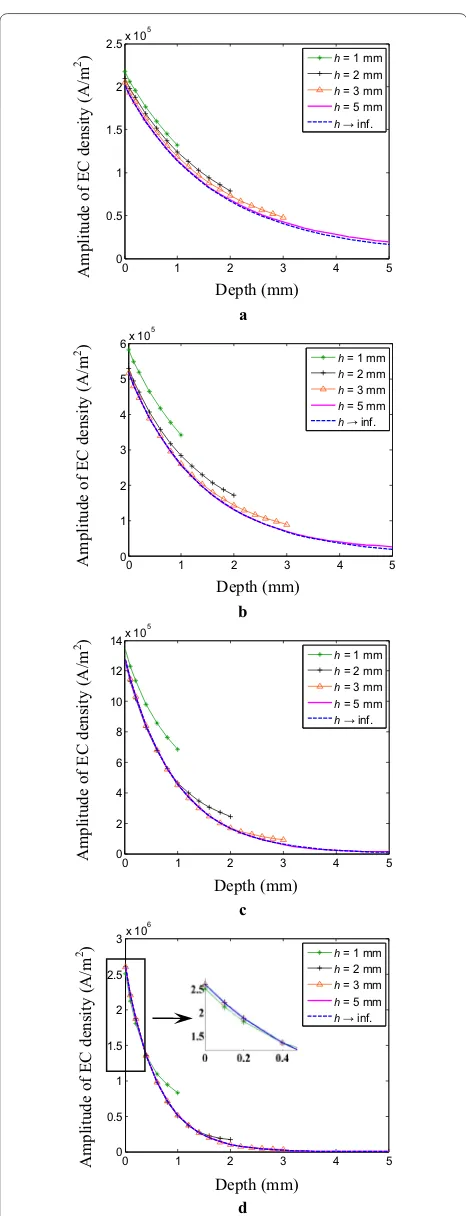
Figures 3(a)‒(d) show the amplitudes of EC densities as functions of depth for various plate thicknesses at 1 kHz, 3 kHz, 10 kHz, and 30 kHz, respectively. For comparison, a
b 1 0.368
δs
Dept
h
Normalized EC density
Figure 1 Illustrations of skin effect and skin depth: a skin effect; b skin depth
1.0 6.5
Conductor h
the EC densities in conductive half space are also shown. Two characteristics are found.
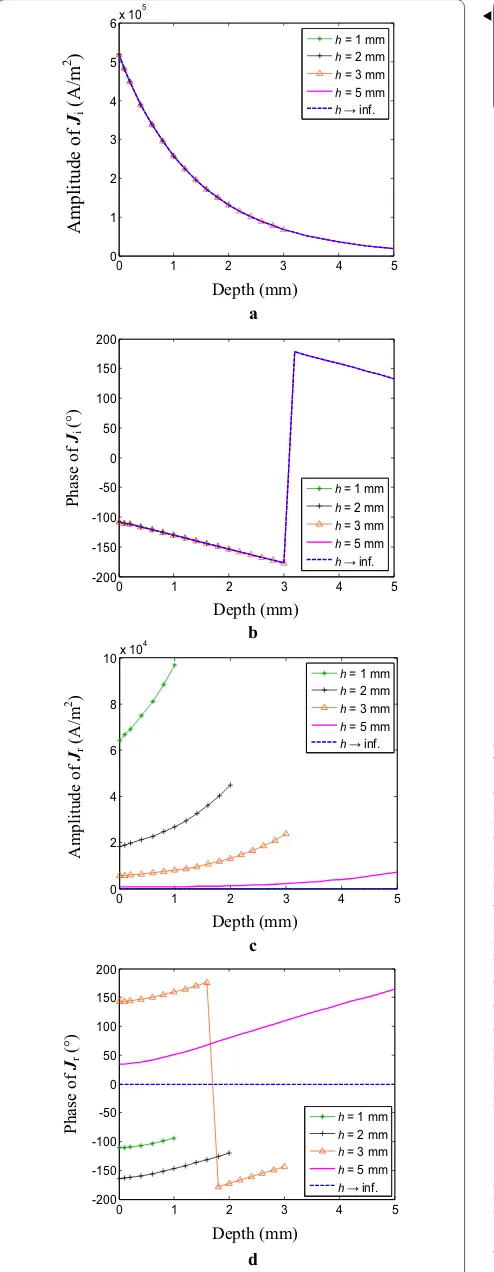
(1) The EC densities at the bottoms of the plates are increased comparing with those at the same depths in conductive half space. It means that there is reflection of EC at the bottoms of the plates. To explain the changes of EC densities, we plot the incidence EC densities Ji and the reflection EC densities Jr as functions of depth at
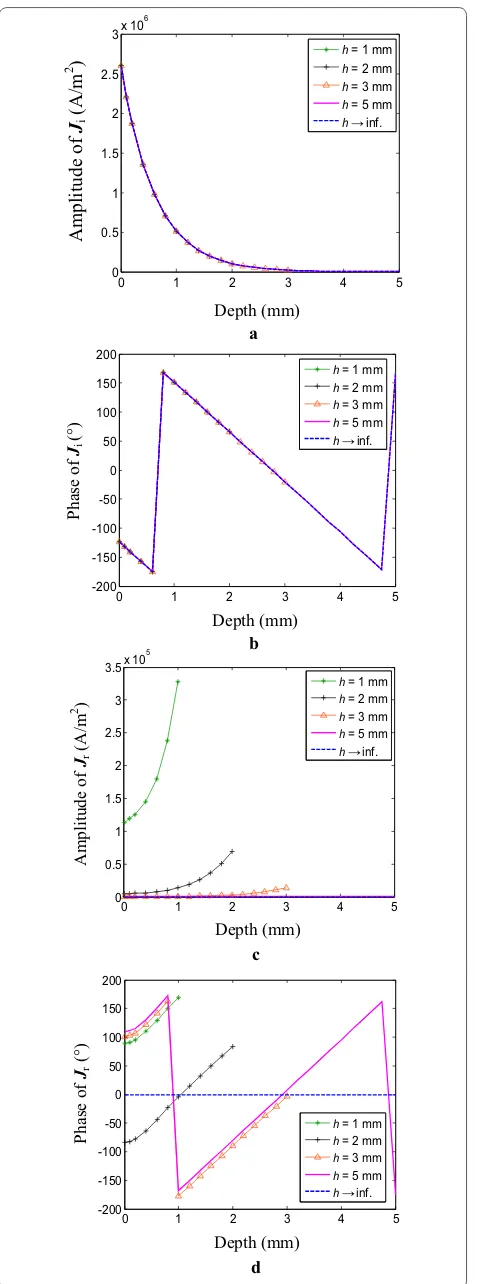
fre-quencies of 3 kHz and 30 kHz, respectively as shown in Figures 4 and 5. The incidence EC densities are actually the EC densities in conductive half space. The reflection EC densities are obtained by subtracting the incidence EC densities from the total EC densities. It is seen that with reducing plate thickness the reflection EC density is increased and the reflection EC densities are larger at the bottoms of the plates and smaller at the tops of the plates. At the bottoms of the plates at either frequency, the phase differences between the reflection EC densities and the corresponding incidence EC densities are smaller than 90°; therefore the reflection of EC increases the total EC densities at the bottoms of the plates.
(2) The EC density at the top of the plate of finite thick-ness can be larger (e.g., when the frequency is 3 kHz and the plate thickness is 1 mm) or smaller (e.g., when the frequency is 30 kHz and the plate thickness is 1 mm) than that at the top of the conductive half space. This is because the phase difference between the reflection EC density and the incidence EC density at the top of the plate can be acute or obtuse. When the frequency is 30 kHz and the plate thickness is 1 mm, the phases of the reflection EC density and the incidence EC density at the top surface are 89.44° and − 123.6°, respectively. Their angle is larger than 90°. Therefore the EC density at the top of the plate in this case is reduced.
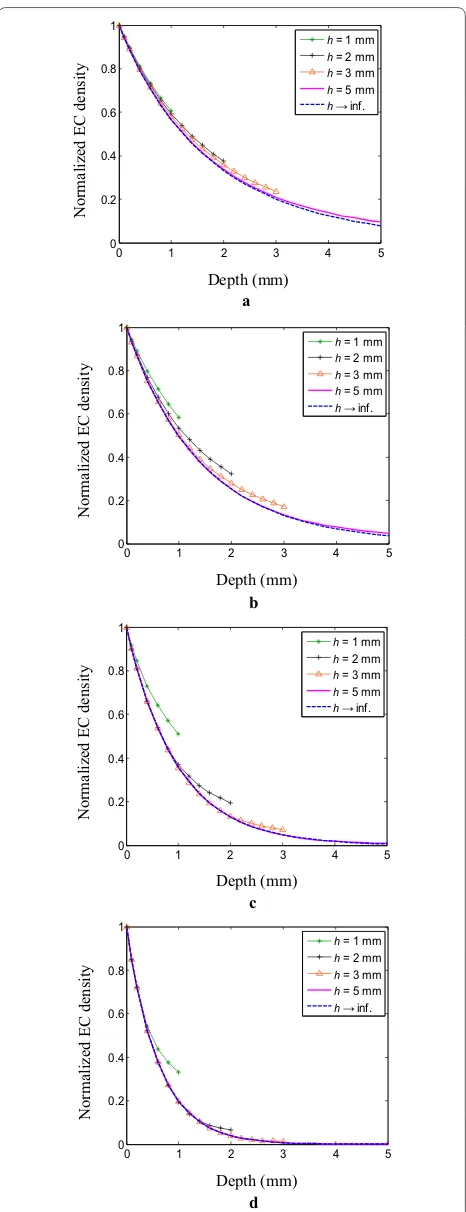
2.2 Analysis of Normalized EC Density
Figures 6(a)‒(d) show the normalized EC densities as functions of depth for various plate thicknesses at 1 kHz, 3 kHz, 10 kHz, and 30 kHz, respectively. The following characteristics are found.
(1) Within certain ranges of working frequency and plate thickness, the speed of attenuation of EC in plate of finite thickness is much slower than that in conductive half space. Two cases are analyzed. One is that, both the EC densities at the top surface and the bottom surface are increased and the increment of EC density at the bottom of the plate is larger than that at the top of the plate (e.g., when the fre-quency is 3 kHz and the plate thickness is 1 mm). The other case is that the EC density at the bottom of the plate is increased whereas the EC density at the top of the plate is decreased (e.g., when the fre-a
b
c
d
0 1 2 3 4 5
0 0.5 1 1.5 2
2.5x 10
5
h = 1 mm
h = 2 mm
h = 3 mm
h = 5 mm
h→ inf.
0 1 2 3 4 5
0 1 2 3 4 5
6x 10
5
h = 1 mm
h = 2 mm
h = 3 mm
h = 5 mm
h→ inf.
0 1 2 3 4 5
0 2 4 6 8 10 12
14x 10
5
h = 1 mm
h = 2 mm
h = 3 mm
h = 5 mm
h→ inf.
0 1 2 3 4 5
0 0.5 1 1.5 2 2.5
3x 10
6
h = 1 mm
h = 2 mm
h = 3 mm
h = 5 mm
h→ inf.
Amplitude of EC density (A/m
2 )
Depth (mm)
Depth (mm)
Amplitude of EC density (A/m
2 )
Depth (mm)
Amplitude of EC density (A/
m
2 )
Depth (mm)
Amplitude of EC density (A/
m
2 )
Figure 3 EC densities as functions of depth for various plate
quency is 30 kHz and the plate thickness is 1 mm). In both cases, the speed of attenuation of EC is decreased.
(2) When the frequency is low (e.g., 1 kHz) or the thickness of the plate is large (e.g., 5 mm), the dif-ference between the speed of attenuation of EC in plate of finite thickness and that in conductive half space is inconspicuous. At low frequency, the vari-ation of the reflection EC density in the range of plate thickness is slow. With large plate thickness, the incidence EC density at the bottom of the plate is small, which results in small reflection of EC. In both cases, the influence of EC reflection on the speed of attenuation of EC is not obvious.
(3) With fixed frequency, the attenuation of EC in thin-ner plate is slower than that in thicker plate. The reason is that compared with the EC density in thicker plate, the increase of EC density at the bot-tom of the plate is larger than that at the top of the plate.
2.3 Equivalent Attenuation Coefficient
When the plate thickness is small, the ratio of EC den-sity at the bottom of the plate to that at the top of the plate may be larger than 1/e. In this case, skin depth cannot be obtained. Furthermore, the relation between EC density and depth in the plate no longer possesses an exponential function owing to the nonuniform exci-tation field and the EC reflection at the bottom of the plate. Thus the attenuation coefficient in Eq. (1) is not applicable. In this scenario, we propose the concept of equivalent attenuation coefficient to take place of skin depth and attenuation coefficient to quantify the speed of attenuation of EC. The equivalent attenuation coef-ficient is defined in such a way that the curve of nor-malized EC density vs. depth is fitted by an exponential function in the form of
and the coefficient of the exponential term is the equiva-lent attenuation coefficient.
Table 1 shows the values of equivalent attenua-tion coefficient of EC in the test samples at different
(4)
J/J0=e− ˜αd, a
b
c
d
0 1 2 3 4 5
0 1 2 3 4 5 6x 10
5
h = 1 mm
h = 2 mm
h = 3 mm
h = 5 mm
h→ inf.
0 1 2 3 4 5
-200 -150 -100 -50 0 50 100 150 200
h = 1 mm
h = 2 mm
h = 3 mm
h = 5 mm
h→ inf.
0 1 2 3 4 5
0 2 4 6 8 10x 10
4
h = 1 mm
h = 2 mm
h = 3 mm
h = 5 mm
h→ inf.
0 1 2 3 4 5
-200 -150 -100 -50 0 50 100 150 200
h = 1 mm
h = 2 mm
h = 3 mm
h = 5 mm
h→ inf.
Amplitude of
Ji
(A/m
2 )
Depth (mm)
Depth (mm)
Depth (mm)
Phase of
Ji
(°
)
Phase of
Jr
(°
)
Depth (mm)
Amplitude of
Jr
(A/
m
2 )
Figure 4 Incidence EC densities and reflection EC densities as
functions of depth for various plate thicknesses at 3 kHz: a amplitudes
of incidence EC densities; b phases of incidence EC densities; c
amplitudes of reflection EC densities; d Phases of reflection EC
frequencies. It can be seen that at a certain frequency, the equivalent attenuation coefficient is smaller for thinner plate, which means that the EC reflection at the bottom of thinner plate is stronger, and the attenu-ation of EC in the plate becomes slower. When the plate thickness is fixed, the equivalent attenuation coefficient increases with increasing excitation frequency.
3 Measurement of Plate Thickness
This section studies the measurement of plate thickness. The relation between coil voltage and plate thickness is obtained by numerical simulation. The characteristics of EC attenuation obtained in Section 2 are utilized to explain such relation. Thereafter, the working frequency is selected and the experiment of thickness measurement is performed.
The method of measuring plate thickness is as follows. First, the relation between coil voltage and plate thickness is established by numerical simulation. Then we choose working frequency such that the range of plate thickness of interest is coved by the linear part of the curve of volt-age-thickness relation. Given measured voltage, the plate thickness is found by interpolating the curve.
3.1 Relation between Coil Voltage and Plate Thickness Figure 7 shows the simulation result of coil voltage due to EC vs. plate thickness obtained using the model and parameters shown in Figure 2. As the plate thick-ness increases, the coil voltage due to EC increases dra-matically, then decreases slowly, and finally approaches constant.
The relation between coil voltage due to EC and plate thickness is analyzed as follows. As illustrated in Figure 8, with increasing plate thickness, the volume of EC distri-bution becomes larger, which has an effect of increasing the coil voltage. At the same time, according to the analy-sis in Section 2, the increase of plate thickness reduces the EC reflection at the bottom of the plate and the atten-uation of EC becomes faster, which has a trend of reduc-ing the coil voltage. When the plate is thin, the voltage increases dramatically as the plate thickness increases, indicating that the increasing effect is dominant over the decreasing effect. As the plate thickness increases, the distance between EC in the range of Δd and coil becomes larger, resulting in weaker influence of this part of EC on the coil. When the plate thickness reaches a certain value, the increasing effect and the decreasing effect are a
b
0 1 2 3 4 5
0 0.5 1 1.5 2 2.5
3x 10 6
h = 1 mm
h = 2 mm
h = 3 mm
h = 5 mm
h→ inf.
0 1 2 3 4 5
-200 -150 -100 -50 0 50 100 150 200
h = 1 mm
h = 2 mm
h = 3 mm
h = 5 mm
h→ inf. Depth (mm)
Depth (mm)
Phase of
Ji
(°
)
Amplitude of
Ji
(A/m
2 )
c
d
0 1 2 3 4 5
0 0.5 1 1.5 2 2.5 3 3.5x 10
5
h = 1 mm
h = 2 mm
h = 3 mm
h = 5 mm
h→ inf.
0 1 2 3 4 5
-200 -150 -100 -50 0 50 100 150 200
h = 1 mm
h = 2 mm
h = 3 mm
h = 5 mm
h→ inf.
Phase of
Jr
(°)
Amplitude of
Jr
(A/m
2 )
Depth (mm)
Depth (mm)
Figure 5 Incidence EC densities and reflection EC densities
as functions of depth for various plate thicknesses at 30 kHz: a
amplitudes of incidence EC densities; b phases of incidence EC
densities; c amplitudes of reflection EC densities; d phases of
balanced and the coil voltage reaches the maximum. When the plate is thicker, the decreasing effect is greater than the increasing effect. Accordingly, the coil voltage reduces when the plate thickness increases. When the plate thickness is large, there is almost no EC reflection at the bottom of the plate, and the increased volume of EC has little effect on the coil. Both of the increasing effect and the decreasing effect are negligible, leading to a con-stant voltage.
a
b
c
d
0 1 2 3 4 5
0 0.2 0.4 0.6 0.8 1
h = 1 mm
h = 2 mm
h = 3 mm
h = 5 mm
h→ inf.
0 1 2 3 4 5
0 0.2 0.4 0.6 0.8 1
h = 1 mm
h = 2 mm
h = 3 mm
h = 5 mm
h→ inf.
0 1 2 3 4 5
0 0.2 0.4 0.6 0.8 1
h = 1 mm
h = 2 mm
h = 3 mm
h = 5 mm
h→ inf.
0 1 2 3 4 5
0 0.2 0.4 0.6 0.8 1
h = 1 mm
h = 2 mm
h = 3 mm
h = 5 mm
h→ inf.
Normalized EC density
Normalized EC density
Depth (mm)
Depth (mm)
Normalized EC density
Depth (mm)
Normalized EC density
Depth (mm)
Figure 6 Normalized EC densities as functions of depth for various
plate thicknesses: a 1 kHz; b 3 kHz; c 10 kHz; d 30 kHz
Table 1 Equivalent attenuation coefficient of EC in the test samples of various thicknesses at different frequencies
Plate thickness
(mm) Equivalent attenuation coefficient ˜ α
1 kHz 3 kHz 10 kHz 30 kHz
1 0.4995 0.5409 0.6684 1.2400
2 0.5011 0.5886 0.9211 1.6070
3 0.5054 0.6342 1.0080 1.6170
5 0.5191 0.6776 1.0200 1.6180
inf. 0.5283 0.6810 1.0200 1.6180
0 2 4 6 8 10
0.02 0.04 0.06 0.08 0.1
Plate thickness (mm)
Amplitude of voltage (V
)
Figure 7 Relation between coil voltage due to EC and plate thickness
d
0
Thicknes
s
EC densities
3.2 Selection of Frequency
In thickness measurement, the working frequency is a critical parameter. This subsection studies the selection of frequency.
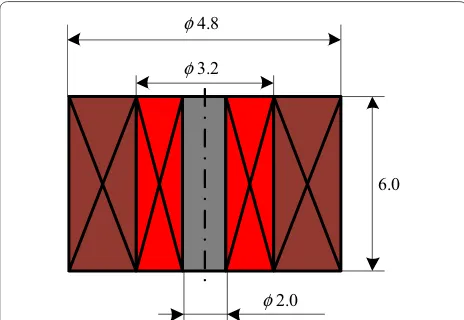
A probe is designed for measuring thickness of metallic plate. As shown in Figure 9, the probe consists of an exci-tation coil in the inside and a reception coil in the out-side. The liftoff is 0.5 mm. A magnetic core with a relative permeability of 650 is placed at the center of the probe to improve detection sensitivity. The plate being tested has an electrical conductivity of 3.5 × 10⁷ S/m and a relative permeability of 1. The thickness of the plate ranges from 0.2 mm to 10.0 mm.
Figure 10 shows the relations between normalized out-put voltage and plate thickness at different frequencies. For the convenience of comparing the voltages under different frequencies, at each frequency, the voltages for various plate thicknesses have been divided by the volt-age for conductive half space. Each of the curves in Fig-ure 10 has a change rule that is reverse to that in Figure 7,
because Figure 7 only shows the coil voltages attributed to EC and each point in Figure 10 is the total coil voltage which is composed of the voltage caused by EC and the voltage generated by the mutual-induction between the excitation coil and the reception coil.
The frequency is selected by the following process. First of all, the range of measurement of plate thickness is specified. Then fit each curve in Figure 10 in the range of measurement by a straight line and compute the cor-responding fitting correction coefficient R2 and the slope
of the line. Finally, select the frequency such that the value of R2 meets requirement and the slope is the
maxi-mum. In this example, the range of measurement is [0, 2] mm. In this range, the values of R2 of linear fitting of the
curves at 0.5 kHz, 1 kHz, 1.5 kHz, 2 kHz, and 3 kHz are 0.99, 0.99, 0.97, 0.94, and 0.86, respectively. The require-ment of R2 for a good linear fitting in this case is that R2
should be larger than 0.9. Among the curves meeting this requirement, the curve at 2 kHz has the largest slope. Thereby, the frequency is selected as 2 kHz.
3.3 Experiment of Thickness Measurement
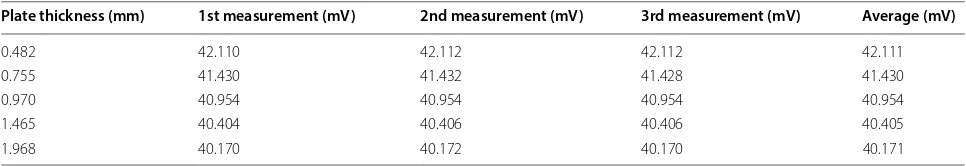
After selecting working frequency, the experiment of measuring plate thickness is conducted. The experimen-tal system includes the mutual-induction probe, phase-locked amplifier 7280 and signal generator DG3061. The signal generator supplies a sinusoidal signal with fre-quency of 2 kHz and peak-to-peak value of 1.5 V. Each of the aluminum plates has a square surface with side length of 100 mm. The plate thicknesses range from 0.482 mm to 1.968 mm.
When doing experiment, we put the probe on the plates in succession from the smallest thickness to the largest thickness and read the voltages on the reception coil. This process is then repeated twice. Table 2 lists the results of three measurements at the same position of each plate and the corresponding average values. Excel-lent repeatability of measurement is seen from the figure. Finally, another plate with known thickness of 1.194 mm is used to verify the accuracy of thickness meas-urement. The average voltage of three measurements is 40.627 mV. Lagrangian interpolation using this voltage and the data in Table 2 gives a thickness of 1.189 mm. The absolute error is 0.005 mm and the relative error is 0.42%.
4 Conclusions
The characteristics of variation of EC in the depth direc-tion in flat plates of finite thicknesses are systematically studied. More specifically, EC densities in metallic plates excited by pancake coils are computed using the finite element method and then the distributions of EC densi-ties in the depth direction are plotted and analyzed. The
φ4.8
φ3.2
φ2.0
6.0
Figure 9 Geometrical model of mutual-induction probe (unit: mm)
0 2 4 6 8 10
0.98 1 1.02 1.04 1.06 1.08 1.1 1.12 1.14
0.5 kHz 1 kHz 1.5 kHz 2 kHz 3 kHz
Plate thickness (mm)
Normalized induced voltag
e
results show that the speed of attenuation of EC in metal-lic plate of finite thickness is slower than that in conduc-tive half space. The thinner the plate is, the slower the EC attenuates. This fact indicates that reflection of EC hap-pens at the bottom of the plate. The speed of EC attenu-ation in metallic plate of finite thickness is quantified by equivalent attenuation coefficient, a new concept pro-posed in this paper.
Based on the analysis of the behavior of EC in metal-lic plate of finite thickness, we elaborate the relation between coil voltage and plate thickness. Thereby, selec-tion of working frequency is discussed. Finally, the exper-iment of thickness measurement is carried out and plate thickness is found by interpolating the voltage-thickness relation given measured coil voltage.
Authors’ Contributions
ZZ was in charge of the whole trial; PD and JL wrote the manuscript; JL and SJ conducted the simulation and experiment; JL and YD assisted with sampling and laboratory analyses. All authors read and approved the final manuscript.
Authors’ Information
Zhiwei Zeng, born in 1974, is currently a professor at School of Aerospace Engineering, Xiamen University, China. His main research interests include electromagnetic nondestructive testing and electromagnetic field numerical analysis.
Pengcheng Ding, born in 1988, is currently a PhD candidate at School of Aero-space Engineering, Xiamen University, China. He received his master’s degree from Nanchang Aviation University, China, in 2016. His research interests include electromagnetic nondestructive testing and electromagnetic field numerical analysis.
Jiayi Li, born in 1993, is currently a senior CAE engineer at BYD Auto Co., Ltd,
China. She received her master’s degree on aviation engineering from Xiamen University, China, in 2018.
Shaoni Jiao, born in 1986, is currently a lecturer at Taiyuan University of Technology, China. She received her PhD degree from Xiamen University, China, in 2017. Her research interests include eddy current testing and numerical analysis.
Junming Lin, born in 1956, bachelor degree, is currently the director of
Eddysun Academician Expert Workstation. His research interests include cloud detection and monitoring, electromagnetic, acoustic and integrated technologies.
Yonghong Dai, born in 1964, is currently the Deputy general manager and senior engineer of Eddysun (Xiamen) Electronics Co., Ltd., China. He received his bachelor’s degree on materials in Zhejiang University, China, in 1985. His research interests include electromagnetic and integrated nondestructive testing.
Funding
Supported by National Natural Science Foundation of China (Grant No. 51277154), Xiamen Key Laboratory of Optoelectronic Transducer Technol-ogy and Fujian Key Laboratory of Universities and Colleges for Transducer Technology, and Innovative Talents Program of Far East NDT New Technology & Application Forum.
Competing Interests
The authors declare that they have no competing interests.
Author Details
1 School of Aerospace Engineering, Xiamen University, Xiamen 361005, China. 2 Work Station of Academicians, Fujian Province (Eddysun), Xiamen 361008,
China.
Received: 25 April 2019 Revised: 13 November 2019 Accepted: 19 November 2019
References
[1] J L Ren, J M Lin. Electromagnetic Nondestructive Testing. Beijing: Science Press, 2008. (in Chinese)
[2] N Yusa, H Hashizume. Numerical investigation of the ability of EC testing to size surface breaking cracks. Nondestructive Testing and Evaluation, 2017, 32(1): 50-58.
[3] K B Ali, A N Abdalla, D Rifai, et al. Review on system development in eddy current testing and technique for defect classification and characteriza-tion. IET Circuits Devices & Systems, 2017, 11(4): 330-343.
[4] D Rifai, A N Abdalla, N Khamsah, et al. Subsurface defects evaluation using eddy current testing. Indian Journal of Science and Technology, 2016, 9(9): 1-7.
[5] D Pereira, T G R Clarke. Modeling and design optimization of an eddy cur-rent sensor for superficial and subsuperficial crack detection in inconel claddings. IEEE Sensors Journal, 2015, 15(2): 1287-1292.
[6] L L Tian, C Yin, Y H Cheng, et al. Successive approximation method for the measurement of thickness using pulsed eddy current. Instrumentation and Measurement Technology Conference IEEE, 2015: 848-852.
[7] H B Wang, W Li, Z H Feng. Noncontact thickness measurement of metal films using eddy-current sensors immune to distance variation. IEEE Transactions on Instrumentation and Measurement, 2015, 64(9): 1-8. [8] M T Kakhki, J Cros, P Viarouge. New approach for accurate prediction of
eddy current losses in laminated material in the presence of skin effect with 2-D FEA. IEEE Transactions on Magnetics, 2016, 52(3): 1-4.
[9] S Majidnia, J Rudlin, R Nilavalan. Investigations on a pulsed eddy current system for flaw detection using an encircling coil on a steel pipe. Insight-Non-Destructive Testing and Condition Monitoring, 2014, 56(10): 560-565. [10] Z Mottl. The quantitative relations between true and standard depth
of penetration for air-cored probe coils in eddy current testing. NDT & E International, 1990, 23(1): 11-18.
[11] S N Jiao, X H Liu, Z. Zeng. Intensive study of skin effect in EC testing with pancake coil. IEEE Transactions on Magnetics, 2017, 53(7): 1-8.
[12] M F Luo. Three-dimensional finite element simulation of pulsed eddy current testing. Xiamen University, 2013. (in Chinese)
[13] Z M Chen, D J Xie, Z W Zeng, et al. Numerical simulation method of electro-magnetic nondestructive testing. Beijing: China Mechanical Industry Press, 2017. (in Chinese)
Table 2 The output voltages for various plate thicknesses
Plate thickness (mm) 1st measurement (mV) 2nd measurement (mV) 3rd measurement (mV) Average (mV)
0.482 42.110 42.112 42.112 42.111
0.755 41.430 41.432 41.428 41.430
0.970 40.954 40.954 40.954 40.954
1.465 40.404 40.406 40.406 40.405
[14] Z L Qu, Q Zhao, Y G Meng. Improvement of sensitivity of eddy current sensors for nanoscale thickness measurement of Cu films. NDT & E Inter-national, 2014, 61: 53-57.
[15] M B Fan, B H Cao, P P Yang, et al. Elimination of liftoff effect using a model-based method for eddy current characterization of a plate. NDT & E International, 2015, 74: 66-71.
[16] T W Krause, C Mandache, J H V Lefebvre. Diffusion of pulsed eddy cur-rents in thin conducting plates. AIP Conference Proceedings, Colorado, USA, July 22-27, 2008: 368-375.
[17] M B Fan, G L Wu, B H Cao, et al. Uncertainty metric in model-based eddy current inversion using the adaptive Monte Carlo method. Measurement, 2019, 137: 323-331.
[18] A V Egorov, S V Kucheryavskiy, V V Polyakov. Resolution of effects in multifrequency eddy current data for reliable diagnostics of conductive materials. Chemometrics and Intelligent Laboratory Systems, 2017, 160: 8-12.
[19] X, L Chen, Y Z Lei. Inverse problem of pulsed eddy current field of fer-romagnetic plates. Chinese Physics B, 2015, 24(3): 303011-303017. [20] D J Zhang, Y T Yu, C Lai, et al. Thickness measurement of multi-layer
conductive coatings using multifrequency eddy current techniques.
Nondestructive Testing Communications, 2016, 31(3): 191-208. [21] Z A Ansari, B A Abu-Nabah, M Alkhader M. Estimating Ti-6Al-4V
coat-ing thickness over SS304 substrate uscoat-ing simulated scoat-ingle-frequency apparent eddy current conductivity. Advances in Science and Engineering Technology International Conferences (ASET) IEEE, 2019: 1-5.
[22] L T Cung, N H Nguyen, P Y Joubert, et al. A model based approach for inspection of aeronautical multi-layered structures by eddy currents. The International Journal for Computation and Mathematics in Electrical and Electronic Engineering, 2019, 38(1): 382-394.
[23] B Ye, M Li, G Qiu, et al. Quantitative estimating size of deep defects in multi-layered structures from eddy current NDT signals using improved ant colony algorithm. Frattura ed Integrità Strutturale, 2014, 8(28): 32-41. [24] W Li, Y Ye, K Zhang, et al. A thickness measurement system for metal films
based on eddy current method with phase detection. IEEE Transactions on Industrial Electronics, 2017, 64(5): 3940-3949.
[25] M B Fan, B H Cao, A I Sunny, et al. Pulsed eddy current thickness measure-ment using phase features immune to liftoff effect. NDT & E International, 2017, 86: 123-131.
[26] Y T Yu, D J Zhang, C Lai, et al. Quantitative approach for thickness and conductivity measurement of monolayer coating by dual-frequency eddy current technique. IEEE Transactions on Instrumentation and Meas-urement, 2017, 66(7): 1874-1882.
[27] K H Gao, Y T Yu, J Yang, et al. Study on eddy-current nondestructive test-ing method of the double-layers conductive Coattest-ing Thickness. Journal of Mechanical Engineering, 2017, 53(14): 114-119. (in Chinese)
[28] L Zhao, C J Li, Z X Duan, et al. The metal thickness detection using pulsed eddy-current computation and detection method. Cluster Computing, 2018(14): 1-12.
[29] W Zhang, Y Li, Y Shi, et al. Feature analysis and processing of pulsed remote field eddy current signal in oil pipes. Chinese Journal of Scientific Instrument, 2019, 40(1): 12-20. (in Chinese)
[30] J H Zhang, M D Yuan, S L Song, et al. Precision measurement of coating thickness on ferromagnetic tube using pulsed eddy current technique.
International Journal of Precision Engineering and Manufacturing, 2015, 16(8): 1723-1728.
[31] D D Wen, M B Fan, B H Cao, et al. Adjusting LOI for enhancement of pulsed eddy current thickness measurement. IEEE Transactions on Instru-mentation and Measurement, 2019, 99: 1-7.
[32] J Li, X J Wu, Q Zhang, et al. Pulsed eddy current testing of ferromagnetic specimen based on variable pulse width excitation. NDT & E International, 2015, 69: 28-34.