R E S E A R C H A R T I C L E
Open Access
UPLC/FT-ICR MS-based high-resolution
platform for determining the geographical
origins of raw propolis samples
Cho Hyun Kim
1, Mee Young Kim
2, Seung-Wan Lee
2and Kyoung-Soon Jang
1,3*Abstract
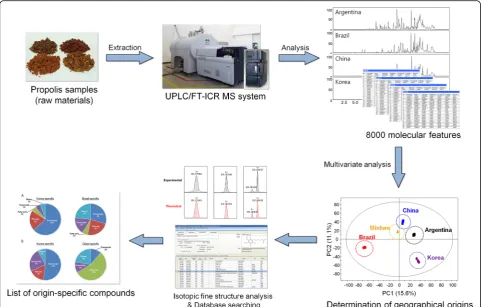
In this study, we demonstrate a high-resolution 15 Tesla Fourier transform ion cyclotron resonance (FT-ICR) mass spectrometry coupled with a reverse-phase ultra-performance liquid chromatography (RP-UPLC) system for determining the geographical origins of raw propolis samples. The UPLC/FT-ICR MS-based high-resolution platform was validated on the ethanol-extracted propolis (EEP) from various propolis raw materials originating from different countries (i.e., Argentina, Brazil, China, and Korea) to determine the geographical origins of the propolis and the origin-specific key compounds. Based on approximately 8000 molecular features extracted from UPLC/FT-ICR MS datasets, a partial least squares-discriminant analysis (PLS-DA) plot showed distinct separations among propolis samples from four different origins. Key propolis components contributing to the discrimination of Korean propolis from Brazilian and Chinese propolis were identified and classified into five subgroups (i.e., flavonoids, phenols, terpenoids, fatty acids, and others). This analysis revealed the characteristic features of the different propolis samples, and this analytical platform can be further used to determine the geographical origins and to assess the quality of the commercial products.
Keywords:Propolis, Ethanol extract, FT-ICR, Geographical origin, Quality control
Introduction
Propolis, the resinous substance collected by honey bees
(Apis mellifera) from buds and resins of various plant
spe-cies, has been used in folk medicine for many years be-cause of its beneficial effects on various symptoms such as wounds, sore throats, and stomach ulcers (Burdock1998; Huang et al.2014). Propolis is composed of various inor-ganic minerals and orinor-ganic compounds, including vita-mins, amino acids, lipids, organic acids, and flavonoids (Huang et al.2014). Among the chemical components of propolis, phenolic compounds, including flavonoids, are the major constituents and contribute largely to the pharmacological effects of propolis (Banskota et al.1998).
Propolis is generally classified as poplar- or Baccharis-type according to its botanical origin. The poplar-Baccharis-type propolis, which originates from Populus buds that are
primarily found in East Asian countries such as China and Korea, is known to have high phenolic contents because the poplar-type plants have high phenolic con-tents (Ristivojevic et al. 2015). Baccharis-type propolis originates from Baccharis dracunculifolia, which in-habits South American countries (i.e., Brazil, Bolivia and Argentina) (Park et al.2004). TheBaccharisspp. is a sig-nificant source of tropical Brazilian green propolis, and cinnamic acid is one of the most significant constituents in the Baccharis plants. Typically, artepillin C, a cin-namic acid derivative, is the representative phenolic compound present in Brazilian propolis. In addition, low flavonoid and phenolic contents and a high content of volatile compounds are the relevant characteristics of Baccharis-type plants.
Because the compositional diversity of propolis depends on the habitats of the source plants, propolis samples col-lected from different origins exhibit different characteris-tics or biological activities such as antitumor, antibacterial, antiviral, antifungal, anti-inflammatory, and antioxidant activities (Burdock 1998). For pharmaceutical and food * Correspondence:[email protected]
1
Biomedical Omics Center, Korea Basic Science Institute, Cheongju 28119, Republic of Korea
3Division of Bio-Analytical Science, University of Science and Technology,
Daejeon 34113, Republic of Korea
Full list of author information is available at the end of the article
applications, knowledge of the chemical composition of the propolis raw materials is necessary; however, to date, the quality of propolis has been examined using a subset of the known phenolic constituents. Therefore, more detailed information is required to better under-stand the complicated substances in propolis and their related functions. Zhou and colleagues reported an HPLC-based determination of the geographical origins of various Chinese propolis (Zhou et al. 2008). Sawaya and coworkers also demonstrated a simple propolis fingerprinting method using easy ambient sonic-spray ionization mass spectrometry (EASI-MS) to characterize their geographical origin (Sawaya et al. 2010). However, these analytical techniques were not suitable for identify-ing unknown compounds due to its low resolvidentify-ing power and poor mass accuracy. The development of LC/ MS-based analytical methods has enabled to more reliably and accurately identify complicated propolis compounds. Pietta et al. showed that the analytical platforms based on atmospheric pressure chemical ionization (APCI) MS and HPLC combined with photodiode array detection can be utilized for reliably identifying a large number of propolis components (Pietta et al. 2002). Gardana and coworkers also applied LC-tandem MS system in order to determine phenolic compounds in different source origins (Gardana et al.2007).
More recently, high-resolution mass spectrometry has been used to characterize phenolic compounds in propolis with high accuracy. Among various types of high-resolution mass analyzers including Q-Tof and Orbitrap, Fourier transform ion cyclotron resonance (FT-ICR) is mostly considered as a powerful tool to in-terpret elemental compositions of compounds of inter-est (Choi et al.2018). The indisputable resolving power (full width at half maximum, FWHM: > 800,000 atm/z 200) and mass accuracy (< 1 ppm) of FT-ICR enable to identify chemical compositions of extremely complicated mixtures without chromatographic separation. The iso-topic fine structure obtained from FT-ICR MS can also be used to determine the elemental formula (Shi et al.1998; Nakabayashi et al.2013). da Costa and coworkers showed the direct infusion electrospray ionization (ESI) FT-ICR mass spectrometry-based evaluation of phenolic com-pounds in plant leaves (da Costa et al.2016). Gardana and colleagues also used UPLC/MS/MS and high-resolution FT-ICR MS systems to reliably detect propolis allergens in raw propolis materials and commercial formulations (Gardana and Simonetti2011).
In the present study, ethanol-extracted propolis (EEP) prepared from various propolis samples originating from different countries were analyzed using high-resolution 15 T FT-ICR mass spectrometry coupled with a reverse-phase ultra-high-performance liquid chromatog-raphy (RP-UPLC) system to determine the geographical
origins of the propolis (Fig.1). This analysis showed the characteristic features of the different propolis samples and figured out the key molecules discriminating those geographical origins. Furthermore, these results could be further utilized to assess the quality of commercial products.
Materials and methods Chemicals
Caffeic acid,p-coumaric acid, rutin, quercetin, cinnamic acid, kaempferol, chrysin, pinocembrin, caffeic acid phe-nethyl ester (CAPE), and artepillin C were purchased from Sigma (St. Louis, MO). All other reagents were of analytical grade.
Preparation of ethanol-extracted propolis
Each raw propolis material (10 g) was mixed with etha-nol (30 mL) and then incubated for 48 h at room temperature with vigorous shaking. The resultant extract was obtained by filtration. The extracts were finally pre-pared as 1% of the total flavonoid content based on the quercetin, which was determined as described in the lit-erature (Chang et al. 2002). The resultant EEP samples were stored at−20 °C until analysis.
UPLC analysis
Chromatography was performed on an ACQUITY HSS T3 column (1.8 μm, 2.1 × 100 mm, Waters, Milford, MA) using an ACQUITY UPLC™ system (Waters) by injecting 2 μL of each EEP sample. The column was maintained at 40 °C. The gradient condition of UPLC started at 10% (v/v) acetonitrile (ACN)/water with 0.1% formic acid and was maintained for 5 min at a flow rate of 300μL/min; the ACN content was linearly ramped to 45%, where it was maintained at this flow rate for 10 min, then ramped to 90%, where the flow rate was maintained for 3 min. The column was washed with 98% ACN for 4 min and re-equilibrated with 10% ACN for 4 min for the next run. The effluent was monitored at a wavelength of 280 nm.
UPLC/FT-ICR MS analysis
voltage of 15 V, a collision gas energy of −3.0 V, an accumulation time of 50 ms, a transient length of 1.398 s, an acquisition size of 4 MB, and a scan number of 1, with a sine-bell apodization window function applied in the time-domain signal. External calibration was performed with quadratic regression using a 100μg/ mL arginine solution. Data acquisition was controlled by the ftmsControl 2.1 and HyStar 4.1 software (Bruker Daltonics), and data processing for selection of molecu-lar features was performed using the DataAnalysis 4.4 program (Bruker Daltonics). Bucketing of the molecular features was processed using ProfileAnalysis 2.2 software (Bruker Daltonics).
Multivariate analyses
The multivariate data analyses such as principal compo-nent analysis (PCA) and partial least squares-discriminant analysis (PLS-DA) with Pareto scaling were performed using the SIMCA-P+ 12.0 software (Umetrics, Umeå, Sweden) to discriminate the different origins. Molecular features containing the retention time and mass-to-charge ratio were extracted from the UPLC/FT-ICR MS raw spectra of four propolis samples and one mixture sample to determine key compounds among different propolis
samples. The datasets including the UPLC/FT-ICR MS-based molecular features were used for the multivariate analysis. After the PLS-DA analysis, the interesting vari-ables were selected using the variable importance in pro-jection (VIP) scores over 4 for further identification of key propolis components reflecting the origin. The molecular formulae and corresponding compounds of the selected variables were identified via METLIN (Smith et al.2005), HMDB (Wishart et al.2007), and other publicly available database searches.
Results and discussion
Quantitation of ten phenolic components in various EEP samples by UPLC analysis
To investigate the chemical composition of propolis originating from different countries, we prepared EEP using raw materials from four different countries (i.e., Argentina, Brazil, China, and Korea). Four EEP samples were analyzed using UPLC with a UV detector (280 nm), and typical chromatograms were obtained. In general, a diode array detector (DAD) has been used to measure a variety of flavonoids or phenolic compounds at a range of wavelengths (i.e., 200–500 nm) because those molecules have typical UV absorption maximum (Harnly et al.2007; Fig. 1Schematic workflow of UPLC/FT-ICR MS-based high-resolution analytical platform for determining the geographical origins of raw
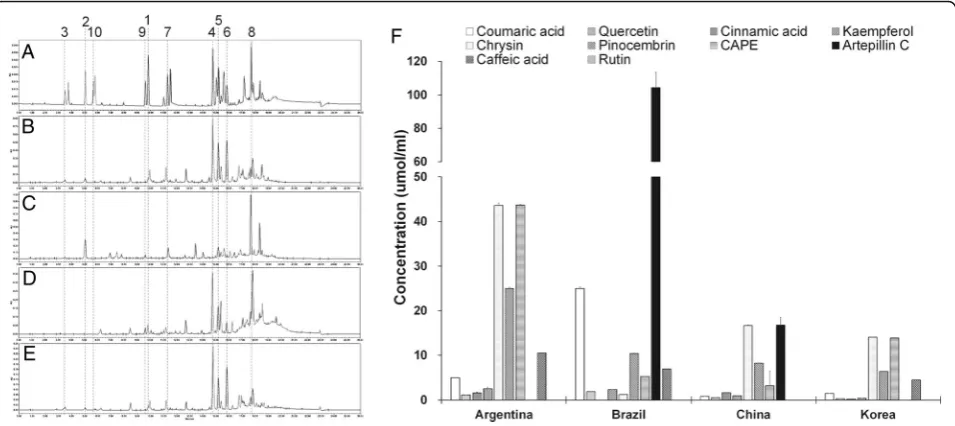
Pellati et al.2011; Zhang et al.2013). Most flavonoids or phenols showed an absorption maximum at around 240– 290 or 300–350 nm. However, those phenolic compounds were mostly been detected at a UV wavelength of 280 nm (Seal2016; Yang et al.2016), so the UPLC-based detection of the phenolic components in EEP samples was done at a wavelength of 280 nm in this study. As shown in Fig.2, the chromatographic profiles of EEP samples from Asian countries (China and Korea) were similar (Fig. 2d, e), whereas the UPLC chromatograms of South American propolis (Argentina and Brazil) were apparently distinct from each other (Fig.2b, c). The UPLC profile of Argen-tinean propolis appeared more similar to that of Korean propolis.
We selected ten phenolic compounds (i.e., coumaric acid, quercetin, cinnamic acid, kaempferol, chrysin, pinocembrin, CAPE, artepillin C, caffeic acid, and rutin), which are the most well-known constituents of propolis, and quantitated the compounds in the EEP samples using standards of these phenolic compounds. Each con-centration of the key components in the EEP samples is shown in Fig. 2f. The major compound in Brazilian propolis was artepillin C, as previously determined, and the concentration of artepillin C in Brazilian propolis was sixfold higher than that in Chinese propolis; no arte-pillin C was observed in the Argentinean or Korean propolis. In addition to the comparison of the chromato-graphic profiles of phenolic compounds monitored at the wavelength of 280 nm, we also compared the EEP profiles using UPLC combined with high-resolution FT-ICR MS analysis.
In-depth analysis of EEP samples using high-resolution UPLC/FT-ICR MS
The investigation of key components contributing to the determination of the geographical origins of propolis is necessary for assessing the quality of propolis and for better use of propolis depending on the biological activ-ities of the key components. Total UPLC/FT-ICR MS ion chromatograms were obtained for four EEP samples (Fig. 3a–d). To confirm the analysis of the EEP samples, the identification and intensity-based quantification were carried out from the raw data. The quantitative analysis results for the ten key phenolic species were compared with those obtained by UPLC analysis. The quantitative results via UPLC/FT-ICR MS agreed well with the UPLC data, supporting the reliability of the FT-ICR MS data. The comparative results are summarized in Table1.
To elucidate the key compounds determining the geo-graphical origins of propolis, the molecular features ob-tained via UPLC/FT-ICR MS analysis were investigated. Approximately 8000 molecular features, including the retention time and m/z values, were extracted from the LC/FT-ICR MS raw data for the four EEP samples. PLS-DA plots of the four propolis samples showed that the UPLC/FT-ICR data well separate the propolis sam-ples by their geographic origin, while the Chinese and Korean propolis were not well resolved by the UPLC-based PLS-DA model, indicating that the selected quantitative information for the ten phenolic com-pounds in EEP samples was not sufficient to differentiate the samples’ origins (Fig. 3e, f ). Given these observa-tions, we speculated that the analysis of a few selected
Fig. 2UPLC chromatograms of EEP samples from South America (bArgentina,cBrazil) and Asia (dChina,eKorea).aThe chromatogram obtained from polyphenol standards. The numbers and the corresponding dotted lines indicate each phenolic standard. 1 = cinnamic acid; 2 = coumaric acid;
3 = caffeic acid; 4 = chrysin; 5 = pinocembrin; 6 = CAPE; 7 = kaempferol; 8 = artepillin C; 9 = quercetin; 10 = rutin.fBar graph showing the
constituents in propolis might be insufficient for the quality control or quality assurance of the propolis prod-ucts and the accurate determination of their source ori-gins. Interestingly, Argentinean propolis differed from the Brazilian propolis, although the two countries are both located in Latin America, whereas China and Korea are in Asia; the Argentinean propolis was not included for further identification of key compounds.
Investigation of key components discriminating Korean propolis from Brazilian and Chinese propolis
As previously mentioned, the chemical composition of South American propolis differs substantially from that of East Asian propolis because of their botanical origins (i.e., poplar- and Baccharis-type plants). As shown in
Fig.3f, we observed good discrimination of Brazilian and
Korean propolis; we therefore decided to determine the Fig. 3Total ion chromatograms of EEP samples fromaArgentina,bBrazil,cChina, anddKorea, as obtained by UPLC/FT-ICR MS. PLS-DA models obtained using UPLC and UPLC/FT-ICR MS data. Quantitation data of ten phenolic compounds using UPLC was used for model (e), whereas
selected key molecular features (VIP > 4, and fold change≥2 or≤ −2 or observed only in each sample) obtained by FT-ICR MS analysis were
used to generate model (f)
Table 1Comparisons of ten phenolic compounds identified from EEP samples using UPLC and UPLC/FT-ICR MS
No. Compound RT
(min)
MW UPLCa UPLC/FT-ICR MSb
Brazil China Korea K/B K/C Brazil China Korea K/B K/C
1 Cinnamic acid 9.8 148.05 N.D 1.7 0.2 N/A 0.1 N.D N.D N.D N/A N/A
2 Coumaric acid 4.8 164.05 25 0.8 1.5 0.1 1.9 O O O Unique Unique
3 Caffeic acid 3.5 180.04 7 N.D 4.5 0.6 N/A O O O Unique Unique
4 Chrysin 14.5 254.06 1.2 16.7 14.1 11.8 0.8 O O O Unique 0.8
5 Pinocembrin 14.9 256.07 10.4 8.3 6.4 0.6 0.8 O O O 1.1 1.1
6 CAPE 15.6 284.10 5.3 3.2 13.9 2.6 4.3 O O O 7.8 4.3
7 Kaempferol 11.0 286.05 2.3 1 0.4 0.2 0.4 O O O -0.4 1.1
8 Artepillin C 17.7 300.17 104.5 16.8 N.D N/A N/A O O O 1.8 2.2
9 Quercetin 9.5 302.04 1.9 0.6 0.3 0.2 0.5 O O O 0.3 2.0
10 Rutin 5.6 610.15 N.D N.D N.D N/A N/A N.D N.D N.D 2.2 0.6
N.Dnot detected,N/Anot applicable
a
The values were the concentration of each component (μmoL/mL of EEP extract exhibiting 1% of the total flavonoid quantity) estimated using UPLC
b
Table
2
Key
compounds
discriminating
Korean
and
Brazilian
propolis.
The
key
compounds
were
selected
from
key
molecular
features
with
VIP
>
4,
and
a
fold
chang
e
≥
2o
r
≤
−
2
or
observed
only
in
each
sample
(Continued)
No.
RT (min)
m
/
z
Formul
a
Error (ppm
)
VIP
Exp
ected
com
pound
Feat
ure
Class
(funct
ion)
Fol
d
chang
e
(lo
g2)
K
orea
only
Brazil
only
29
17
.59
30
1.180
C19 H24 O3
0.00
0
17
.75
Art
epillin
C
N/A
O
Cinnamic
acid
derivatives
(anti-inflam
matory
activity)
30
12
.48
31
1.128
C19 H18 O4
0.07
7
5.
04
Mora
cin
N
N/A
O
Flavono
ids
31
17
.81
32
1.243
C20 H32 O3
0.38
6
4.
27
Hyd
roxyei
cosatet
raenoi
c
acid
(HET
E)
N/A
O
Unsaturated
fatt
y
acids
32
9.
86
36
3.180
C20 H26 O6
0.08
0
4.
51
Gi
bberellin
A36
N/A
O
Diterpenoi
ds
(p
lant
hormone
s)
(Stowe
and
Yamaki
1959
)
33
15
.13
39
1.212
C22 H30 O6
0.42
7
6.
68
Ne
oquassi
n
N/A
O
Quassinoids
(inse
cticidal
activit
y)
(Dou
et
al.
20
08
)
34
7.
21
51
7.134
C25 H24 O12
0.18
4
5.
04
Api
gen
in
7-(2
′′
,3
′′
-dia
cetylglu
coside)
N/A
O
Flavono
ids
(ant
i-cancer
effect
)
35
19
.74
52
7.337
C32 H46 O6
0.75
9
4.
27
(24E)
-3alpha-acet
oxy-15
alpha-h
ydroxy-23oxo-7,
9(11),24
-lanostatrien-2
6-oic
acid
N/A
O
Triterpenes
No.
1
to
18:
key
compounds
with
a
fold
change
of
≥
2
and
no.
19
to
35:
key
compounds
with
a
fold
change
of
≤−
2
Numbers
in
italic
represent
the
compounds
observed
only
in
each
key propolis components discriminating Korean and Brazilian propolis. In addition, the molecular features obtained from Korean and Chinese propolis samples were investigated to figure out the key molecules that differentiate these two Asian propolis varieties. To deter-mine the key components distinguishing the different propolis samples among 8164 molecular features ob-tained from UPLC/FT-ICR MS analysis, approximately 100 features with VIP values greater than 4.0 and fold changes above or below 2 or fold changes observed only in each sample were selected for further investigation.
Finally, we obtained 35 and 43 key components dis-criminating Korean and Brazilian propolis and Korean and Chinese propolis, respectively. All the significant compounds contributing to the geographical determin-ation of Korean and Brazilian propolis are summarized in Table2, while the key compounds discriminating Ko-rean and Chinese propolis are listed in Table 3. Identifi-cation of the chemical formulae was possible from the accurate molecular masses and their experimental iso-topic fine structures (IFSs) of all metabolites. Prediction of the compound was made by searching METLIN and HMDB databases. The extracted ion chromatograms, the corresponding mass spectra, and IFSs of the pro-posed compounds were summarized in the Additional
file 1. Then, the proposed key compounds could be
di-vided into five subgroups based on their chemical class
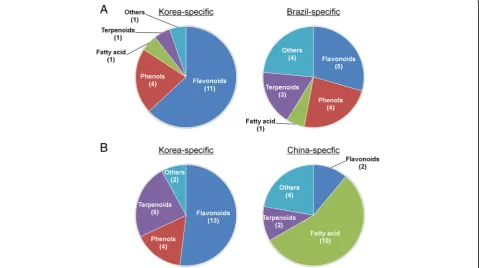
(i.e., flavonoids, phenols, terpenoids, fatty acids, and others). The pie charts of the chemical classes of the key compounds discriminating Korean and Brazilian prop-olis showed that the flavonoids were the most abundant (61%), followed by phenols (22%), terpenoids (6%), others (6%), and fatty acids (5%) in Korean propolis; meanwhile, the most frequently assigned class was flavo-noids (29%) and others (24%), followed by phenols (23%), terpenoids (18%), and fatty acids (6%) in Brazilian propolis (Fig. 4a). Key propolis classes for differentiating Korean and Chinese propolis were divided by flavonoids (52%), terpenoids (24%), phenols (16%), and others (8%) in Korean propolis, whereas Brazil-specific compounds were classified by fatty acids (56%), others (22%), flavo-noids (11%), and terpeflavo-noids (11%) (Fig.4b).
In particular, flavonoid species seemed a most signifi-cant contributor differentiating Korean propolis from Brazilian and Chinese propolis. In Brazilian propolis, di-and tri-terpenoids including Gibberrellins, a kind of plant hormones that affect plant growth and developments (Hedden and Sponsel 2015), were significantly observed. Those key components would strongly reflect their botan-ical differences. Between two Asian propolis origins (Korea versus China), flavonoids and terpenoids species were reliably identified as Korea-specific key molecules, but Chinese propolis appears to possess fatty acid class compounds. The unsaturated fatty acids including
ricinoleic acid and eicosanedioic acid, distinctly found in the Chinese propolis could also be utilized as dietary sources as the unsaturated fatty acids present in prop-olis are considered to be a good source to the diet (Rebiai et al.2017).
Conclusions
Here, a high-resolution 15 T FT-ICR MS equipped with UPLC system was introduced to investigate the key phenolic compounds responsible for determining the geographical origin of propolis (i.e., Korea versus Brazil and Korea versus China). We then proposed 16 flavo-noids, 8 phenolic compounds, 4 terpeflavo-noids, 2 fatty acids, and 5 others in Korean and Brazilian propolis, while 15 flavonoids, 10 fatty acids, 8 terpenoids, 4 phenols, and 6 others were proposed in Korean and Chinese propolis. These key compounds can be used as chemical markers to classify and identify the geograph-ical origins of propolis. In the pharmaceutgeograph-ical and food industries, those key propolis components could play a significant role in distinguishing high-quality propolis from inferior or fake propolis. Moreover, the informa-tion of the key propolis constituents can be utilized to verify the effects of propolis in the prevention and treatment of various symptoms and diseases. Further characterization and biological evidence of the key compounds could focus on the evaluation of the com-pounds for quality assessment of propolis products and for standardization of propolis.
The chemical composition of propolis is strongly linked to vegetation present in the collection area as well as collecting periods and climates (Bankova et al.2000). However, changes in vegetation on the Chinese contin-ent are as great as changes from southern Argcontin-entina to northern Brazil. Yang and coworkers showed that the compositions and concentrations of aroma-active com-ponents collected from 23 regions of Chinese continent were significantly different (Yang et al. 2010). Therefore, a more detailed investigation of plant species close to the production area of propolis even in the same country is needed to determine the source origin more accur-ately. Although the results were obtained with only four different propolis samples from each origin and the key propolis compounds were not confirmed by tandem MS analysis, this UPLC/FT-ICR MS-based high-resolution platform showed the potentials for the comprehensive analysis of highly complicated bioactive compounds.
Furthermore, it could also be used to investigate novel propolis compounds with biological activities and are helpful for the pharmaceutical and food industries, which require an understanding of the chemical com-position, botanical origin, and biological properties of propolis.
Additional file
Additional file 1:Extracted ion chromatograms, FT-ICR MS spectra and isotopic fine structures of key compounds discriminating Korean and
Bra-zilian propolis, proposed in Table2, and discriminating Korean and
Chin-ese propolis, proposed in Table3. (PDF 1066 kb)
Abbreviations
ACN:Acetonitrile; APCI: Atmospheric pressure chemical ionization;
CAPE: Caffeic acid phenethyl ester; EEP: Ethanol-extracted propolis; ESI: Electrospray ionization; FT-ICR: Fourier transform ion cyclotron resonance; IFS: Isotopic fine structures; PCA: Principal component analysis; PLS-DA: Partial least squares-discriminant analysis; RP-UPLC: Reverse-phase ultra-performance liquid chromatography; VIP: Variable importance in projection
Acknowledgements
This work was supported by KBSI grant (G38110) and Basic Science Research Program through the National Research Foundation of Korea (NRF) funded by the Ministry of Science and ICT (2016R1C1B2006863).
Availability of data and materials
Research data have been provided in the manuscript and supporting information file.
Authors’contributions
CHK and KSJ are involved in research design and execution of the experiments. MYK, SWL, and KSJ are involved in data interpretation and supervision of the studies, and all authors contributed to writing of the manuscript. All authors read and approved the final manuscript.
Competing interests
The authors declare that they have no competing interests.
Publisher’s Note
Springer Nature remains neutral with regard to jurisdictional claims in published maps and institutional affiliations.
Author details 1
Biomedical Omics Center, Korea Basic Science Institute, Cheongju 28119, Republic of Korea.2Propolis Research Institute, Seoul Propolis Co, Daejeon 34025, Republic of Korea.3Division of Bio-Analytical Science, University of Science and Technology, Daejeon 34113, Republic of Korea.
Received: 10 December 2018 Accepted: 25 January 2019
References
Bankova VS, Solange LC, Marcucci MC. Propolis: recent advances in chemistry
and plant origin. Apidologie. 2000;31:3–15.
Banskota AH, Tezuka Y, Prasain JK, Matsushige K, Saiki I, Kadota S. Chemical constituents of Brazilian propolis and their cytotoxic activities. J Nat Prod.
1998;61:896–900.
Burdock GA. Review of the biological properties and toxicity of bee propolis
(propolis). Food Chem Toxicol. 1998;36:347–63.
Chang CC, Yang MH, Wen HM, Chern JC. Estimation of total flavonoid content in propolis by two complementary colorimetric methods. J Food Drug Anal.
2002;10:178–82.
Choi M, Choi AY, Ahn SY, Choi KY, Jang KS. Characterization of molecular composition of bacterial melanin isolated from Streptomyces glaucescens using ultra-high-resolution FT-ICR mass spectrometry. Mass Spectrom Lett.
2018;9:81–5.
da Costa MF, Galaverna RS, Pudenzi MA, Ruiz ALTG, de Carvalho JE, Eberlin MN, dos Santos C. Profiles of phenolic compounds by FT-ICR MS and antioxidative and antiproliferative activities of Stryphnodendron obovatum
Benth leaf extracts. Anal Methods. 2016;8:6056–63.
Dou J, McChesney JD, Sindelar RD, Goins DK, Khan IA, Walker LA. A new quassinoid from crude quassin-extract of Quassia amara. Int J Pharmacogn.
Gardana C, Scaglianti M, Pietta P, Simonetti P. Analysis of the polyphenolic fraction of propolis from different sources by liquid chromatography-tandem
mass spectrometry. J Pharm Biomed Anal. 2007;45:390–9.
Gardana C, Simonetti P. Evaluation of allergens in propolis by ultra-performance liquid chromatography/tandem mass spectrometry. Rapid Commun Mass
Spectrom. 2011;25:1675–82.
Harnly JM, Bhagwat S, Lin LZ. Profiling methods for the determination of phenolic compounds in foods and dietary supplements. Anal Bioanal Chem.
2007;389:47–61.
Hedden P, Sponsel V. A century of Gibberellin research. J Plant Growth Regul.
2015;34:740–60.
Huang S, Zhang CP, Wang K, Li GQ, Hu FL. Recent advances in the chemical
composition of propolis. Molecules. 2014;19:19610–32.
Mundt S, Kreitlow S, Jansen R. Fatty acids with antibacterial activity from the
cyanobacterium Oscillatoria redekei HUB 051. J Appl Phycol. 2003;15:263–7.
Nakabayashi R, Sawada Y, Yamada Y, Suzuki M, Hirai MY, Sakurai T, Saito K. Combination of liquid chromatography-Fourier transform ion cyclotron resonance-mass spectrometry with 13C-labeling for chemical assignment of
sulfur-containing metabolites in onion bulbs. Anal Chem. 2013;85:1310–5.
Park YK, Paredes-Guzman JF, Aguiar CL, Alencar SM, Fujiwara FY. Chemical constituents in Baccharis dracunculifolia as the main botanical origin of
southeastern Brazilian propolis. J Agric Food Chem. 2004;52:1100–3.
Pellati F, Orlandini G, Pinetti D, Benvenuti S. HPLC-DAD and HPLC-ESI-MS/MS methods for metabolite profiling of propolis extracts. J Pharm Biomed Anal.
2011;55:934–48.
Pietta PG, Gardana C, Pietta AM. Analytical methods for quality control of
propolis. Fitoterapia. 2002;73(Suppl 1):S7–20.
Rebiai A, Belfar ML, Mesbahi MA, Nani S, Tliba A, Ghamem Amara D, Chouikh A. Fatty acid composition of Algerian propolis. J Fundam. Appl Sci. 2017;9:
1656–71.
Ristivojevic P, Trifkovic J, Andric F, Milojkovic-Opsenica D. Poplar-type propolis: chemical composition, botanical origin and biological activity. Nat Prod
Commun. 2015;10:1869–76.
Rupasinghe HP, Jackson CJ, Poysa V, Di Berardo C, Bewley JD, Jenkinson J. Soyasapogenol A and B distribution in soybean (Glycine max L. Merr.) in relation to seed physiology, genetic variability, and growing location. J Agric
Food Chem. 2003;51:5888–94.
Sawaya AC, Abdelnur PV, Eberlin MN, Kumazawa S, Ahn MR, Bang KS, Nagaraja N, Bankova VS, Afrouzan H. Fingerprinting of propolis by easy ambient
sonic-spray ionization mass spectrometry. Talanta. 2010;81:100–8.
Seal T. Quantitative HPLC analysis of phenolic acids, flavonoids and ascorbic acid in four different solvent extracts of two wild edible leaves, Sonchus arvensis and Oenanthe linearis of North-Eastern region in India. J Appl Pharm Sci.
2016;6:157–66.
Shi SD, Hendrickson CL, Marshall AG. Counting individual sulfur atoms in a protein by ultrahigh-resolution Fourier transform ion cyclotron resonance mass spectrometry: experimental resolution of isotopic fine structure in
proteins. Proc Natl Acad Sci U S A. 1998;95:11532–7.
Sitton D, West CA. Casbene: an anti-fungal diterpene produced in cell-free
extracts of Ricinus communis seedlings. Phytochemistry. 1975;14:1921–5.
Smith CA, O'Maille G, Want EJ, Qin C, Trauger SA, Brandon TR, Custodio DE, Abagyan R, Siuzdak G. METLIN: a metabolite mass spectral database. Ther
Drug Monit. 2005;27:747–51.
Stowe BB, Yamaki T. Gibberellins: stimulants of plant growth. Science. 1959;129:
807–16.
Vieira C, Evangelista S, Cirillo R, Lippi A, Maggi CA, Manzini S. Effect of ricinoleic acid in acute and subchronic experimental models of inflammation.
Mediators Inflamm. 2000;9:223–8.
Wang Y, Liu F, Liang Z, Peng L, Wang B, Yu J, Su Y, Ma C. Homoisoflavonoids and the antioxidant activity of Ophiopogon japonicus root. Iran J Pharm Res.
2017;16:357–65.
Wishart DS, Tzur D, Knox C, Eisner R, Guo AC, Young N, Cheng D, Jewell K, Arndt D, Sawhney S, Fung C, Nikolai L, Lewis M, Coutouly MA, Forsythe I, Tang P, Shrivastava S, Jeroncic K, Stothard P, Amegbey G, Block D, Hau DD, Wagner J, Miniaci J, Clements M, Gebremedhin M, Guo N, Zhang Y, Duggan GE, Macinnis GD, Weljie AM, Dowlatabadi R, Bamforth F, Clive D, Greiner R, Li L, Marrie T, Sykes BD, Vogel HJ, Querengesser L. HMDB: the human
metabolome database. Nucleic Acids Res. 2007;35:D521–6.
Yang C, Luo L, Zhang H, Yang X, Lv Y, Song H. Common aroma-active components of propolis from 23 regions of China. J Sci Food Agric. 2010;90:
1268–82.
Yang Y, Sun X, Liu J, Kang L, Chen S, Ma B, Guo B. Quantitative and qualitative analysis of flavonoids and phenolic acids in snow chrysanthemum (Coreopsis tinctoria Nutt.) by HPLC-DAD and UPLC-ESI-QTOF-MS. Molecules. 2016;21: 1307.
Zhang A, Wan L, Wu C, Fang Y, Han G, Li H, Zhang Z, Wang H. Simultaneous determination of 14 phenolic compounds in grape canes by HPLC-DAD-UV
using wavelength switching detection. Molecules. 2013;18:14241–57.
Zhou J, Li Y, Zhao J, Xue X, Wu L, Chen F. Geographical traceability of propolis by high-performance liquid-chromatography fingerprints. Food