www.adv-radio-sci.net/13/41/2015/ doi:10.5194/ars-13-41-2015
© Author(s) 2015. CC Attribution 3.0 License.
Validation of the radiation pattern of the VHF MST radar
MAARSY by scattering off a sounding rocket’s payload
T. Renkwitz, C. Schult, R. Latteck, and G. Stober
Leibniz-Institute of Atmospheric Physics at the Rostock University, Schloss-Str. 6, 18225 Kühlungsborn, Germany Correspondence to: T. Renkwitz ([email protected])
Received: 16 January 2015 – Revised: 14 April 2015 – Accepted: 2 June 2015 – Published: 3 November 2015
Abstract. The Middle Atmosphere Alomar Radar System (MAARSY) is a monostatic radar with an active phased ar-ray antenna designed for studies of phenomena in the meso-sphere and lower thermomeso-sphere. Its design, in particular the flexible beam forming and steering capability, makes it a powerful instrument to perform observations with high angu-lar and temporal resolution. For the configuration and anal-ysis of experiments carried out with the radar it is essential to have knowledge of the actual radiation pattern. Therefore, during the time since the radar was put into operation various active and passive experiments have been performed to gain knowledge of the radiation pattern. With these experiments the beam pointing accuracy, the beam width and phase dis-tribution of the antenna array were investigated. Here, the use of a sounding rocket and its payload as a radar target is described which was launched in the proximity of the radar. The analysis of these observations allows the detailed inves-tigation of the two-way radiation pattern for different antenna array sizes and beam pointing positions.
1 Introduction
The Middle Atmosphere Alomar Radar System (MAARSY) was built in 2009/2010 by the Leibniz-Institute of Atmo-spheric Physics (IAP) on the island Andøya in Northern Nor-way (69.30◦N, 16.04◦E). The MAARSY radar facilitates
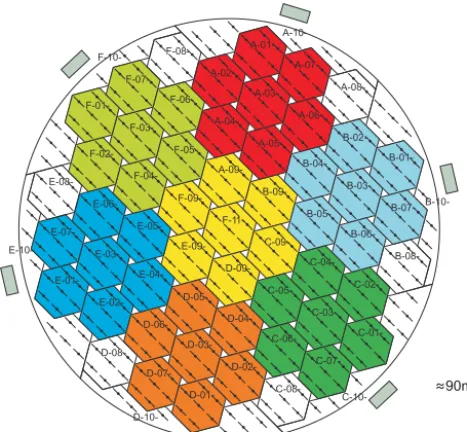
studies of the arctic atmosphere with high spatial and tem-poral resolution within the mesosphere/lower thermosphere and the troposphere/lower stratosphere and is therefore cat-egorized as a MST radar. The main active phased array an-tenna consists of 433 individual 3-element Yagi anan-tennas (see Fig. 1) optimized for approximately 5 MHz bandwidth at the operating frequency of 53.5 MHz. Each individual antenna of
the main array is connected to its own transceiver allowing independent phase and amplitude settings. This arrangement facilitates very flexible beam forming and steering properties of the radar. A detailed technical description of the radar is given by Latteck et al. (2012). Furthermore, additional ex-ternal antenna groups or individual antennas may be con-nected to the receivers allowing e.g. interferometric obser-vations with antenna spacings and baseline lengths divergent to the main array and its subarrays. Extensive simulations of the radiation pattern of the main antenna array and the addi-tional groups have been performed during the design phase and since the radar was put into operation. These simulations were performed with the Numerical Electromagnetic Code (version 4.1) investigating the radiation properties like the antenna gain, beam width and shape, the side lobe suppres-sion, the influence of the soil properties and mutual coupling for various beam pointing directions.
C-05- C-06-
C-03-
C-02- C-08-
C-07-
C-01- C-10-
D-05-
D-04- D-02-
D-06- D-03-
E-02- D-08-
D-07- D-01- D-10-
E-01-≈90m
Figure 1. Sketch of the MAARSY VHF radar antenna array with the nomenclature of the individual subarrays. The colored sub-groups mark the MAARSY343 subarray.
a VHF antenna array is the placement of e.g. a transmitter onboard a satellite. This has to be carried out carefully as the wave’s propagation through the ionosphere is subject to Fara-day rotation and is therefore often limited to circularly polar-ized antenna arrays (see e.g. Fukao et al., 1985; Sato et al., 1989). Alternatively, a receiver may be placed on an airplane or helicopter to sample directly the radar’s emissions, advan-tageously in the radiation far field.
In this paper we present an active radar experiment per-formed with MAARSY, which allows the determination of the beam pointing accuracy, the effective beam width and side lobe attenuation. For this purpose we use the backscatter of a sounding rocket’s payload that was launched in the prox-imity of the radar. In the subsequent section we will describe the experiment we conducted to evaluate the radiation pattern of the MAARSY radar by the use of the sounding rocket’s payload as a radar target. Subsequently we will present and discuss the results of this experiment and compare these to the simulation findings. Finally, conclusions and an outlook will be presented.
2 Experiment description
In the end of June 2013 the WADIS sounding rocket cam-paign (WAve propagation and DISsipation in the middle at-mosphere) was conducted at the Andøya Space Center lo-cated in the proximity of MAARSY. During this campaign several meteorological and one instrumented rocket were launched. These rocket launches were accompanied by si-multaneous operations of various ground based radar, lidar
and balloon facilities. Herein, MAARSY was the leading radar facility to detect and observe polar mesospheric sum-mer echoes (PMSE) with multiple beam directions to pro-pose favorable launch conditions and to derive detailed in-formation about the PMSE structure during the flight. For this purpose MAARSY was operated with a dedicated exper-iment configuration during the flight to sequentially observe 16 different beam directions along the predicted payload’s trajectory.
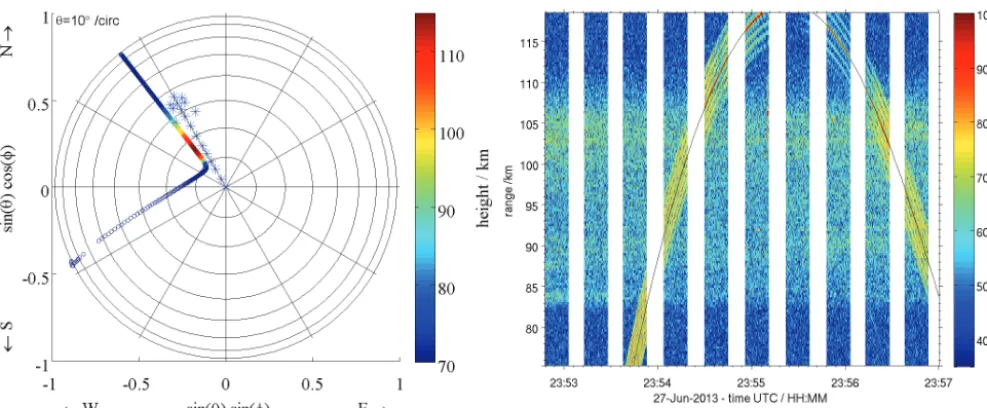
Besides the initial objectives of this scan configuration, the subsequent analysis of the spatially and temporally spread PMSE and the in-situ observations of the rocket’s payload, additional backscatter was observed. The analysis of the radar data set turned out to contain strong backscatter from the rocket, the payload and likely the rocket’s nose cone. Favorably, the rocket motor and the payload had a length of approximately half the radar wavelength allowing strong backscatter. The beam positions MAARSY was sequentially scanning using the entire antenna array for transmission and the GPS trajectory1 of the payload with color-coded height are depicted in the left panel of Fig. 2. The GPS trajectory of the payload has been validated by interferometric means of MAARSY, using various combinations of subarrays care-fully calibrated in range and phase. Due to the large radar cross-section of the payload we detected signatures of it in basically all beam positions. Thus, within 75 and 119 km range the flight of the payload has been observed almost con-tinuously as shown in an power integrated plot in the right panel of Fig. 2. The prominent data gaps are caused by the selected experiment configuration, mainly the chosen sam-ple rate and the available data transfer speed of the acquisi-tion system existent at that time. The experiment settings are shown in Table 1.
The partially strong backscatter of at most 50 dB signal-to-noise ratio allows the detection of the radar’s main lobe and its first side lobe and is therefore exceptionally valuable for radiation pattern comparisons. In the subsequently presented analysis of the experiment’s data different sizes of the anten-nas array are used for reception, where the use of the entire antenna array (MAARSY433) should provide the maximum gain of all configurations in the selected beam pointing direc-tion and therefore the minimum available beam width.
Figure 2. Left panel: trajectory of the WADIS rocket payload in reference to MAARSY, depicted in spherical coordinates, overlaid by the beam positions used in the WADIS scan experiment, marked by asterisks. The height of the payload during its flight is depicted color coded. Right panel: integrated power of all beams in the scan (median removed) depicted over range and time. The thin black line marks the range calculated from the GPS coordinates, which agrees exceptionally well to the observed range during the entire flight. The enhanced intensity between approximately 82 and 106 km range origins PMSE observed with different beam positions.
tional to this completely hardware combined channel, 15 ad-ditional receiving channels have been connected to subarray groups of 49 or 7 antennas each (Anemones and Hexagons, respectively). With the knowledge of the absolute phases of these individual subarray groups larger subarrays may be formed in software by integrating the signals of e.g. seven Anemones resulting in MAARSY343 (marked in color in Fig. 1). This software combined subarray is exceptionally interesting due to its large aperture and thus good angular resolution. The use of different sizes of the antenna array al-lows the verification of the beam pointing accuracy, beam width and side lobe attenuation for multiple beam directions for every single configuration. Furthermore the use of small subarrays in this experiment is exceptionally interesting as those broad radiation patterns do not contribute significantly to the two-way pattern. As an extreme case the use of an om-nidirectional antenna for reception result in a two-way pat-tern that is identical to the patpat-tern of the one-way transmit-ting antenna as the two-way pattern is the product of both individual radiation patterns.
The radiation pattern of the corresponding subarray groups and the entire antenna array have been simulated for the re-spective beam pointing positions for the entire hemisphere with 1◦resolution in both azimuth and zenith angle. Within
these simulations the antenna array have been modeled with best accuracy of the antenna structure itself and the soil prop-erties. Thus, the most realistic pattern and so the side lobes are taken into account for the subsequent analysis. The re-sulting two-way pattern for the different receiving subar-rays were computed afterwards to obtain simulated
intensi-ties along the payload’s trajectory. The simulated intensiintensi-ties were then corrected for the changing radar cross-section of the target during its flight.
For this purpose we assume a metallic mainly pure cylin-drical surface and a simplified spherical bottom side of ap-propriate dimensions. The most significant approximation used here refers to both ends of the payload, where various instruments are placed. These instruments represent diverse surface structures significantly smaller than the used wave-length which makes it intricate to derive a comprehensive expression and therefore a half sphere is assumed. This im-perfection is, however, relieved as the total effective area is dominated by the payload’s cylindrical body. Considering the length of the target of approximately half the radar wave-length Rayleigh scattering appears most appropriate for the purpose of this analysis and the desired accuracy.
Applying these approximations of the geometric shape the radar cross-sections σs andσb for the cylindrical side and
the bottom surface may be expressed by the approximations given by Fuhs (1983), respectively.
σso=9/4π h2(2π r/λ)4 (1)
σsp=
π·h2
(π/2)2+(ln(λ/1.78π r))2 (2)
σs= σso+σ p
s/2·sinθa (3)
σb=7.11π r2·(2π/λ)4·cosθa (4)
The height and radius of the payload are denoted byh and
Figure 3. Detected intensities for the beam direction φ=330◦ and θ=13◦ using MAARSY433 on reception. The backscatter at around 85 km height originates PMSE. The red angles mark backscatter likely caused by the motor and the rocket’s nose cone.
which varies between 10 to 30◦during the evaluated period. In Eqs. (1) to (3)σsoandσspdescribe the orthogonal and
par-allel components of the total radar cross section σs of the
cylindrical body, where the first dominates significantly. As the MAARSY antenna array was mainly circularly polarized during the experiments, no consideration of the orientation angle of the payload and the polarization angle are necessary as it would have been for linear polarization near the reso-nance scattering. Besides this angular independency of cir-cular polarization for the mentioned target it, however, leads to a reduction of effective area by a factor of 2 (in Eq. 3), comparable to the polarization loss between linear and circu-lar pocircu-larization. Alternatively, equations and approximations given by e.g. van Vleck et al. (1947), Mailloux (1994) and Skolnik (2008) yield to results of equivalent cross sections. It has to be noted, diffraction and creeping waves around the backside of the body are neglected in the shown approxima-tions. The radar cross-section was computed for every point of the trajectory considering the pitch angle of the rocket (and its payload) and the geometric angle of attack from the radar to the target. The radar cross-section thus varies for the eval-uated beam direction by a factor of 3 dB at most accounting for the previously mentioned approximations. This mainly affects the simulated intensity of the outward side lobe and to a lesser extent the simulated beam width. This factor is mainly caused by the variable effective area of the dominat-ing cylindrical surface with the minimum at approximately 80 km height during the upleg and the maximum during the downleg due to the increasing zenith angle and thus angle of attack and effective area.
3 Analysis and discussion
In this section the analysis of the experiment’s data for few beam positions and their interpretation are discussed.
Figure 3 shows the detected intensities for the beam point-ing direction ofφ=330◦andθ=13◦. Here, besides the
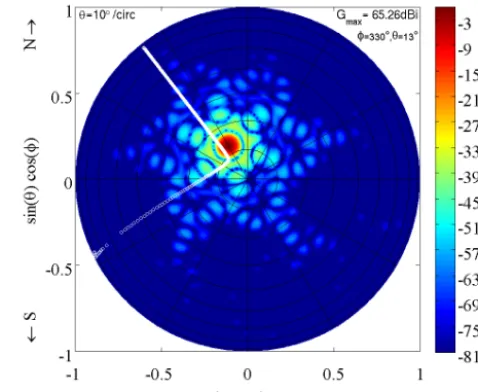
sig-Figure 4. Simulated two-way radiation pattern pointing to φ=330◦ andθ=13◦by the superposition of MAARSY433 and MAARSY343 for transmission and reception, respectively. Equiva-lently to Fig. 2 left, the trajectory of the payload is marked by white circles.
Figure 5. Simulated two-way radiation pattern pointing toφ=322◦ andθ=28◦by the superposition of MAARSY433 and an Anemone group of 49 antennas for transmission and reception, respectively. Equivalently to Fig. 2 left, the trajectory of the payload is marked by white circles.
the payload was far outside the main and the first side lobe re-sulting in at least 40 dB less gain in these directions. More in-teresting are the observations for the earlier highlighted beam pointing direction ofφ=322◦andθ=28◦(see Fig. 5).
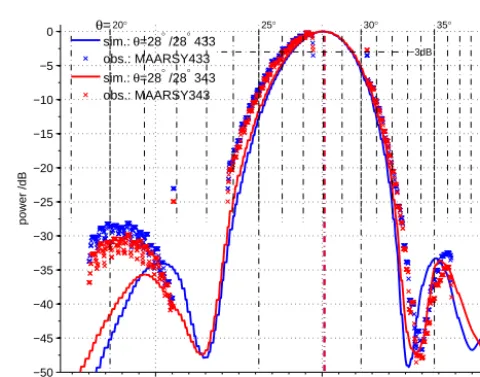
Here, the payload almost exactly passes through the radar’s beam pointing direction and thus facilitates strong backscatter from both, the main lobe and the first side lobe ring (see Fig. 6). Therefore this beam pointing direction was used for the detailed analysis and comparison with the sim-ulated radiation pattern. For this purpose the maximum de-tected intensities close to the GPS trajectory are used, as marked with crosses in Fig. 7 for both MAARSY433 (blue) and MAARSY343 (red) on reception. The simulated intensi-ties, computed for the actual state of the antenna array during this experiment for reception and transmission, are depicted as solid lines in the respective color for both array sizes.
Similarly to the detected power in Fig. 6, the intensities have been simulated for each point of the GPS trajectory and thus the direction from the radar to the target. It can be seen that the relative intensities and the beam shape for both array sizes are approximately the same. MAARSY’s beam pointing appears to be shifted very slightly towards zenith, which is however hardly to see due to the existing data gap at the simulated maximum intensity. Nevertheless the misalign-ment can be approximated to be in the order of less than 0.5◦. The observed beam width for MAARSY433 on reception ap-pears to be slightly broader than the width of MAARSY343. This is just opposite to the simulation and the general approx-imation since the aperture of the MAARSY433 supersedes MAARSY343 and thus the theoretical relative beam width is inversely proportional to their aperture ratio. Furthermore,
Figure 6. Detected intensities for the beam direction φ=322◦ andθ=28◦using MAARSY343 on reception. The backscatter at around 85 km height originates PMSE.
23:56:00 23:56:30 23:57:00 −50
−45 −40 −35 −30 −25 −20 −15 −10 −5 0
27−Jun−2013 − time UTC / HH:MM
power /dB
20° 25° 30° 35° 40°
θ=
−3dB
sim.: θ=28° /28° 433 obs.: MAARSY433 sim.: θ=28° /28° 343 obs.: MAARSY343
Figure 7. Detected and simulated intensities (marked by crosses and solid line, respectively) for the beam directionφ=322◦ and θ=28◦using MAARSY433 and MAARSY343 (blue and red, re-spectively). Black vertical broken lines mark the zenith angle la-beled on top of the figure. Colored vertical broken line accentuates the maximum of simulated intensity.
the beam width of the main lobe of both arrays seem to be broadened by 0.5◦ at most, which is consistent to the out-ward shifted positions of the minima between the main lobe and the first side lobe ring. The side lobe attenuation agrees fairly well to the simulations with about 2 dB increased in-tensity towards zenith.
affect-23:56:00 23:56:30 23:57:00 −35
−30
27−Jun−2013 − time UTC / HH:MM
Figure 8. Equivalent to Fig. 7. Detected intensities for the beam directionφ=322◦andθ=28◦using Anemones A–E, M (blue) and Anemone F (red) marked by crosses. The corresponding simulated intensities are shown forφ=322◦andθ=28◦(blue) andφ=322◦ andθ=26.5◦(red).
ing the side lobe level. Both issues have already been incor-porated in the simulations used for this comparison.
To investigate the reason of the broadened beam width smaller subarray groups have been used in a similar man-ner as before. In Fig. 8 the simulated and observed intensi-ties for Anemone subarrays (49 antennas each) are shown. It was found that six out of the seven available Anemones show equivalent detected intensities, while Anemone F slightly differed. The main lobe of Anemone F seems to be shifted towards zenith, which is also underlined by an intensified side lobe towards zenith and vice versa with the outer side lobe. The best agreement to the observations was found for the simulation of pointing the Anemone at most 1.5◦off the nominal beam direction. This misalignment however should not result in broadening the beam width of the entire antenna array in such an extent as seen before. Equivalent to the pre-vious example using (almost) the entire antenna array, the two-way beam width using the Anemone subarrays on re-ception appears to be broadened by 0.5◦. Consistently, the minima between main and side lobe are shifted outwards by approximately 0.6◦.
As quoted in the prior section a rather broad, in an extreme case omnidirectional, antenna does not change the two-way radiation pattern significantly. During this experiment, the smallest available antenna groups were Hexagon subarrays, composed of seven antennas each. In total eight Hexagons spread over the antenna array have been used and analyzed (see Fig. 9). Besides mediocre variation of the detected in-tensities via the side lobes (e.g. B-08), all Hexagons show an equivalent shape and width of the main and side lobe. How-ever, the beam width appears to be still enlarged by
approx-23:56:00 23:56:30 23:57:00 −35
−30
27−Jun−2013 − time UTC / HH:MM
Figure 9. Detected intensities for the beam directionφ=330◦and θ=13◦using a Hexagon group of seven antennas.
imately 0.7◦. Due to the wide beam width of the Hexagons (31◦) the effective width of the two-way radiation pattern is dominated by the transmission pattern of the entire antenna array. Even though the width of the Hexagons could also be enlarged to some extent it appears to be more likely the beam width of the entire antenna array is broadened.
A generally smaller aperture of the antenna array and thus broader beam width as planned can be excluded as the ar-ray has been built with best precision. Furthermore passive experiments observing cosmic radio sources and active ex-periments observing meteor head echoes indicated a better agreement with simulations (see e.g. Renkwitz et al., 2012, 2013; Chau et al., 2014).
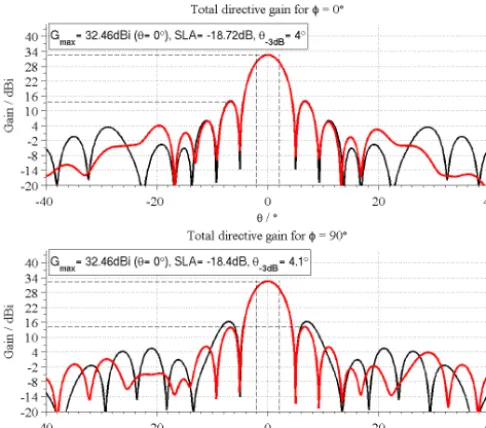
Possible reasons of the observed broadening are: (a) ad-ditional ineffective antennas at the rim of the entire antenna array, (b) unintentional amplitude taper, or (c) imperfect sim-ulation. The outermost antennas of the entire array have not been exceptionally peculiar in neither earlier experiments nor the automatically measured impedances and reflected output power for each experiment run for the considered time. Un-intentional random amplitude taper (±1 dB) and phase vari-ations (±10◦) for the individual antennas have been simu-lated and are shown in Fig. 10. The perfectly phased array MAARSY343 with uniform amplitude has a minimum beam width of 4◦, while for the simulation with random phase and
amplitude variations a broadening of 0.1◦ can be seen in
Figure 10. Comparison of simulations for the ideally phased and uniform amplitude MAARSY343 (black) to the case of random fluctuations of every array element of ±1 dB and ±10◦ for two cross-sections (φ=0◦andφ=90◦).
observations. Finally, we assume a superposition of primar-ily the points (b) and (c) causing the observed beam width broadening of approximately 0.5◦.
4 Conclusions and outlook
In this paper we presented an active experiment to validate the radiation pattern of MAARSY. This actively scanning radar experiment was initially planned to derive background parameters, like PMSE strength and wind components for the trajectory of the rocket’s payload launched during the WADIS campaign. Additionally to these objectives strong backscatter from the payload were detected which facili-tates the comparison to the simulated two-way radiation pat-tern of the radar. During this experiment the payload’s flight could be seen in all 18 scheduled beam directions along the predicted trajectory. This is primarily caused by the pay-load’s size (almost exactly half wave length of the radar) and its cylindrical shape that exhibit a large radar cross-section. Though MAARSY reaches a reasonably good side lobe suppression, the payload’s backscatter could often also be seen in the first side lobe of the radar’s radiation pattern for the entire antenna array and smaller subarrays on recep-tion. The two-way radiation pattern for the combination of the entire antenna array on transmission and various arrays sizes for reception were simulated for the individual points of the payload’s trajectory. These simulations were subse-quently corrected for the varying radar cross-section due to the orientation of the payload and thus the angle of attack.
Doing so, we were able to find very good agreement of the simulated radiation pattern and the observed backscatter in-tensities. Though, we also found a generally enlarged beam width, which could be verified by the use of smaller sub-arrays on reception, seven antennas at the least. Therefore the transmit pattern incorporating the entire antenna array al-ready has to be broadened. The enlarged beam width is most likely caused by the superposition of circularly polarization emitted by approximately 80 % of the antenna array in its center and the still linearly polarized antennas at the rim of the array. Furthermore, with the simulation we could demon-strate that the subarray Anemone F appeared to squint to an extent of maximum 1.5◦ towards zenith during this experi-ment. This is assumed to be caused by a flaw in the receiver phases, which however could not be verified during mainte-nance measures. Overall, we are impressed by the excellent opportunity to validate the radiation pattern by the observa-tion of a sounding rocket, which is of significant benefit to the radar operators. Therefore, we are looking forward to the next equivalent rocket campaign in the proximity of the radar as MAARSY’s antenna array is completely converted to cir-cular polarization since autumn 2013. Such rocket campaign could be used to validate the beam width of MAARSY’s ra-diation pattern for the entirely circularly polarized antenna array. For the first half-year of 2015 a second rocket launch within the WADIS campaign is now planned with an equiv-alent payload. The authors are looking forward to this excel-lent opportunity which may solve some of the uncertainties illustrated here.
Acknowledgements. The authors explicitly acknowledge the kindly provided GPS trajectory by M. Hörschgen-Eggers/DLR-MORABA and the PI of IAP’s sounding rocket group Dr. Boris Strelnikov. The WADIS project was funded by the German Space Agency (DLR) under grant 50 OE 1001. Furthermore, we like to express our grat-itude to the Andøya Space Center for their permanent support for the operation and maintenance of the MAARSY radar. The radar development was supported by the german grant 01 LP 0802A of Bundesministerium für Bildung und Forschung.
Edited by: R. Schuhmann
Reviewed by: two anonymous referees
References
Chau, J. L., Renkwitz, T., Stober, G., and Latteck, R.: MAARSY multiple receiver phase calibration using radio sources, J. Atmos. Sol.-Terr. Phy., doi:10.1016/j.jastp.2013.04.004, 2014.
de Oliveira-Costa, A., Tegmark, M., Gaensler, B. M., Jonas, J., Landecker, T. L., and Reich, P.: A Model of Diffuse Galactic Radio Emission from 10 MHz to 100 GHz, Mon. Not. Roy. Astron. Soc., 338, 247–260, doi:10.1111/j.1365-2966.2008.13376.x, 2008.