1994) 817 NUTRIENT CONCENTRATION RELATIONSHIPS BETWEEN THE
FOURTH PETIOLE AND UPPER-STEM OF POTATO PLANTS' D. T. Westermann 2 , S. M. Bosma, and M. A. Kay
Abstract
Successfully evaluating the nutritional status of a crop during growth and development is dependent upon sampling an identifiable plant part. Consistently sampling a petiole of the same maturity in potatoes
(Solanum
tuberosum
L.) is difficult. We evaluated the nutrient relationships between the upper-stem and the fourth petiole from Russet Burbank plants in field studies having N, P, K, Zn or Mn variables. The upper-stem was obtained by excising the stem below the sixth leaf and removing all leaves and the ter-minal meristem. Petole NO 3-N, P, K, Zn and Mn concentrations were from deficient to sufficient. The NO 3-N, P and K concentrations were similar in the fourth petiole and upper-stem, while the Zn concentration was 40% higher in the upper-stem. Calcium, Mg and Mn concentrations were lower in the upper-stem than in the fourth petiole. Copper and S relationships were not adequately defined. The fourth petiole's NO 3-N, P and K diagnos-tic concentrations now used to monitor plant nutrient status can also be used for upper-stem samples. Zinc diagnostic concentrations should be in-creased, while Ca, Mg and Mn concentrations should be adjusted down-ward in the upper-tem. Additional data are needed to refine the Ca and Mg relationships, and to establish relationships for Cu, S and other essential nutrients. A significant advantage of using the upper-stem is the elimina-tion of the petiole selecelimina-tion problem when sampling.Compendio
La evaluaciOn exitosa de las condiciones de nutriciOn de un cultivo durante su crecimiento y desarrollo depende en tomar la parte correcta de la planta. El muestreo permanente de un peciolo con igual estado de madurez en el cultivo de papa
(Solanum tuberosum
L.), es dificil. Se evaluaron las relaciones entre la parte superior del tallo y el cuarto peciolo de plantas Russet Burbank en estudios de campo que tenian aplicaciones variables de N, P, K, Zn o Mn. La parte superior del tallo fue obtenida seccionando al'Contribution from USDA-ARS, Soil and Water Management Unit, Kimberly, ID 8334L 'Soil Scientist and Biological Science Technicians, respectively. USDA-ARS, 3793N 3600E, Kimberly, ID 83341.
Accepted for publication August 22, 1994.
818
AMERICAN POTATO JOURNAL(Vol. 71
mismo por debajo de la sexta hoja y eliminando todas las hojas y el meristema
terminal. Las concentraciones de NO 3-N, P, K, Zn y Mn estuvieron entre
deficientes y suficientes. Las concentraciones del NO3-N, del P y del K fueron
similares en el cuarto peciolo y en la parte superior del tallo, mientras que la
concentraciOn del Zn fue 40% mds alta en la parte superior del tallo. Las
concentraciones de Ca, Mg y Mn fueron menores en la parte superior del
tallo que en el cuarto peciolo. Las relaciones entre el Cu y el S no fueron
definidas adecuadamente. Las concentraciones de diagnOstico de NO B-N, P
y K en el cuarto peciolo utilizadas ahora para el seguimiento del estado de
nutricinn de las plantas, puede tambien utilizarse para las muestras de la
parte superior del tallo. Las concentraciones de diagnOstico del Zn deben
ser incrementadas, mientras que las de Ca, Mg y Mn deben rebajarse en la
parte superior del tallo. Se requiere de informaciOn adicional para refinar
las relaciones del Ca y del Mg y para establecer las relaciones para el Cu, S y
otros nutrientes esenciales. Una ventaja significativa en el use de la parte
superior del tallo es la eliminaciOn del problema de la selecciOn del peciolo
en el muestreo.
Introduction
Soil and plant chemical analyses are common management tools that
can improve fertilizer use efficiency and crop yields. Soil analyses identify
preplant nutrient availabilities, fertilizer requirements, soil pH and salt
prob-lems. Plant analyses are used to determine the causes of poor plant growth
and effectiveness of preplant fertilization applications. Increasingly, they
are being used to help manage a crop's nutritional status during growth to
achieve high yields and quality, particularly for a high cash value and
inten-sively managed crop like potatoes (Solanum tuberosum L.). Efficient
nutri-ent managemnutri-ent becomes more important if the potnutri-ential environmnutri-ental
impact of a nutrient is also considered.
Accurate sampling techniques, analytical methods and interpretations
based on research results are required for any diagnostic test to be
effec-tive. Many factors must be considered in the diagnostic process, e.g., crop,
variety, plant part sampled, growth stage, field variation, etc. Samples must
represent the whole plant and the sampling area. A specific plant part is
generally used because its nutrient concentration reflects the nutrient
avail-able to the plant from soil and fertilizer sources. The nutrient
concentra-tion in the plant part must also relate to crop growth and yield up to a
"critical concentration", reflecting the nutrient's metabolic relationships
in the plant. It is also desirable that the difference between the deficiency
and adequacy concentrations in the plant part be as large as possible to
help minimize sampling and analytical errors (11).
1994) WESTERMANN et al.: NUTRIENT CONCENTRATION 819 plant parts are acceptable for differentiating between nutrient deficiency and adequacy (5, 6). The fourth petiole of the most recently matured leaf from the growing tip generally satisfies the criteria for use as a diagnostic plant part, particularly for the macro-nutrients. The leaflets are usually stripped off the petiole and discarded during field sampling. They may be left on the petiole but different diagnostic norms must be used. The leaf-lets plus the petiole are sometimes used for evaluating micro-nutrient sta-tus.
It is difficult to only sample the fourth petiole from the growing tip. Often younger or older petioles are selected for analyses. This is not a seri-ous problem if one consistently samples a younger or older petiole, and if a properly calibrated nutrient relationship is available for the particular peti-ole sample mix. However, misleading conclusions and recommendations will occur if the diagnostic norms for the fourth petiole are used to inter-pret the analyses for petioles from different positions or from a mixed sample, and if concentrations depend upon petiole position. Nutrient con-centrations in the plant generally change with plant age. This and the com-plex supply, translocation and utilization relationships in the plant may cause petioles from different positions to have different nutrient concen-trations. Preliminary data indicated that some nutrient concentrations in a portion of the upper-stem were similar to those in the fourth petiole. The objective of this study was to evaluate the nutrient relationships between the upper-stem and fourth petiole of Russet Burbank potato plants.
Methods and Materials
Several irrigated Russet Burbank potato experiments were conducted in southern Idaho and northern Utah during 1987 and 1988. Treatments depended upon location and encompassed N, K, P, Zn or Mn fertilizer applications. All nutrient applications generally increased tuber yields, ex-cept for Mn. Each experiment contained three or four replications. Stan-dard cultural practices were followed when possible in all experiments. Soils at the locations were classified as Aridisols or Mollisols, with textures from silt loam to sandy loam.
820
AMERICAN POTATO JOURNAL(Vol. 71
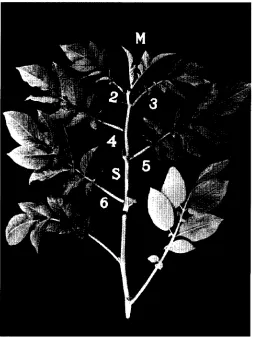
FIG. 1. Identification of plant part for each petiole position and upper-stem sample. (M = terminal meristem; S = upper-stem; 2 - 6 petiole position).
during mid-tuber bulking. All samples were dried at 60 C, ground to pass a
40-mesh screen, and stored until analysis. A subsample from each sample
was extracted and analyzed for NO,-N by a specific-ion electrode (8).
An-other subsample was wet-ashed with a HCL0 4-HNO3 mixture. The digested
solution was analyzed for P colorimetrically (4); K, Ca, Mg, Zn, Cu and Mn
by atomic absorption spectrophotometry; and S turbidimetrically (13). All
analyses are reported on a dry matter basis.
1994)
WESTERMANN et al.: NUTRIENT CONCENTRATION821
TABLE
1.—Effect of petiole position below the meristem on selected nutrient
concentrations where N and P were adequate.'
Petiole position
Nutrient
NO -N P K Zn Mn
(mg kg') (%) (%) (mg kg') (mg kg')
2 13000c 0.29a 8.0c 37.0a 29.2c
3 15100bc 0.24b 9.1b 31.8b 29.8c
4 15700b 0.22c 9.7ab 24.5c 30.0c
5 18200a 0.20d 9.7ab 22.5c 32.8bc
6 19200a 0.19e 9.9ab 19.3d 36.5b
7 19400a 0.17f 10.0a 18.8d 41.0a
C.V., % 14.3 7.8 2.4 5.6 8.3
'Each mean is an average of 20 observations and is different at the 0.05 probability level with Duncan's multiple range test if followed with different letters.
Petiole and upper-stem nutrient analyses were related using linear re-gression procedures on both the research (controlled experiments) and grower data sets. Regression relationships were evaluated for equality of slope and intercepts for each nutrient (9). In addition, petiole and upper-stem data from the growers' fields were evaluated with the studentized t-test. Duncan's multiple range test was used to separate petiole position means.
Results and Discussion
822 AMERICAN POTATO JOURNAL (Vol. 71
5000 10000 15000 20000
Petiole NO3-N, mg kg
30000
25000-
20000-
15000-
10000-
5000-30000 25000
0 I
0 0.05 0.10 0.15 0.20 0.25 0.30 0.35 0.40 0.45 0.50
0.45-
0.40-
0.35-
0.30-
0.25-
0.20-
0.150.10
-
0.05-a:
E
.21 co
FIG. 2. Comparison of fourth petiole and upper-stem NOM-N concentrations. (Dashed line is for a 1:1 relationship; 392 paired samples.)
Petiole P,%
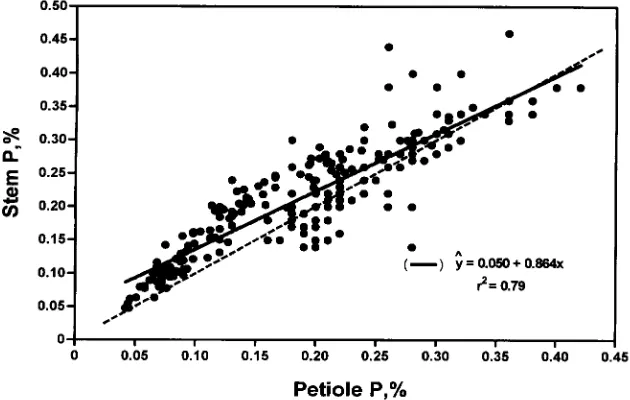
FIG. 3. Comparison of fourth petiole and upper-stem P concentrations. (Dashed line is for a 1:1 relationship; 232 paired samples.)
Petiole vs. Upper-Stem, Research Data
Set—There were significant linear relationships between the fourth petiole and upper-stem for all nutrients using the research data set (Table 2). Coefficients of simple determinationfertil-1994) WESTERIN et al.: NUTRIENT CONCENTRATION 823
Petiole K,%
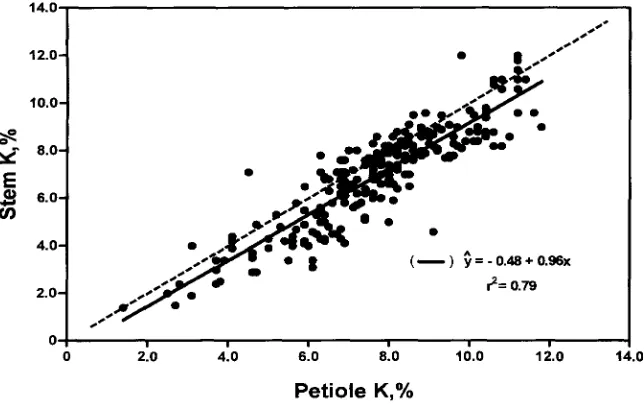
FIG. 4. Comparison of fourth petiole and upper-stem K concentrations. (Dashed line is for a 1:1 relationship; 232 paired samples.)
izer variables had lower coefficients, i.e., Cu and S. Higher coefficients for Ca and Mg probably reflect their inverse relationship (multicollinearity among variables) with K (3).
Concentrations of NO 3-N, P and K in the petiole and upper-stem were similar across all concentrations (Figs. 2, 3 & 4). Regression slopes were near unity for NO 3-N and K (Table 2). The stem contained slightly more P when the petiole had less than about 0.40% P (Fig. 3), however the 90% confidence interval completely enclosed the 1:1 line for P (not shown). The relationships for both NO B-N and P appear to pass through the origin rather than having a positive intercept (Figs. 2 & 3). A multiplicative model (y = axb ) forced the line through the origin for P and had an r 2 of 0.81. Potassium had a negative intercept (Fig. 4), implying that stem K concen-tration was about 0.5% lower than the petiole's.
40
•
e'
e ee
e'e
t
•
./
• .
•
% ••••••
lie
•
•
• jo••••
•
•
mimeo ••••••••
%••• ••••••• •
•• ••••••• •
••• ••• •
•
•• • •
• • •
e ee
d'ee••
••
••
• ••
•
••
•
•
•
• •
•
••
• •
•
•
• •
•
• •
•
•
•
••• • • •
•
•
•• •••
•
• •
A(—) y=
6.21'2 =
•
•
•
o
•
+ 0.48x 0.68
•
10 35-01 _sg30-E
25-E -21)
20-cn
15-824
AMERICAN POTATO JOURNAL(Vol. 71
Y
60-cs)
N
40-
30-0 10 20 30 40 50 60 70
Petiole Zn, mg kg
FIG. 5. Comparison of fourth petiole and upper-stem Zn concentrations. (Dashed line is for a 1:1 relationship; 232 paired samples.)
10 15 20 25 30 35 40 45 50 55 60
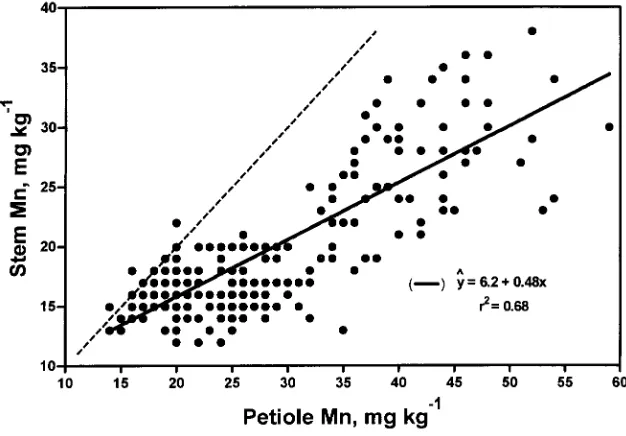
Petiole Mn, mg kg
11994) WESTERMANN et al.: NUTRIENT CONCENTRATION 825 Manganese concentrations in the upper-stem were about 48% of those in the petiole (Fig. 6). The petiole vs. upper-stem Mn relationship had a y-intercept of 6.2 mg kg- 1 Mn. The upper-stem appears a less desirable plant part than the petiole for Mn nutritional monitoring because of its smaller concentration range. Less than 20-30 mg Mn kg in the petiole are consid-ered from Mn deficient plants (2, 12, 14).
A good relationship between petiole and upper-stem was obtained for both Ca and Mg (Table 2). Petiole concentrations varied from 0.65 to 2.2% Ca and from 0.45 to 2.0% Mg. All concentrations found in this study would normally be considered adequate for plant nutrition (12, 14). Both slopes were less than one suggesting that the concentration range in the petiole was greater than that in the upper-stem for both Ca and Mg. The higher concentration of Ca and Mg in the petiole may partially be because of the relative immobility of these ions in the plant, particularly Ca.
Both Cu and S relationships had lower coefficients (r2 ) than the other nutrients (Table 2). All petiole Cu and S concentrations (not shown) were sufficient (12, 14). Part of the variability may be because of surface con-tamination from sprays containing Cu and S applied for early blight, white mold
(Sclerotinia sclerotiorum)
or powdery mildew(Erysiphe cichoracearum)
control.
Petiole vs. Upper-Stem, Grower Data
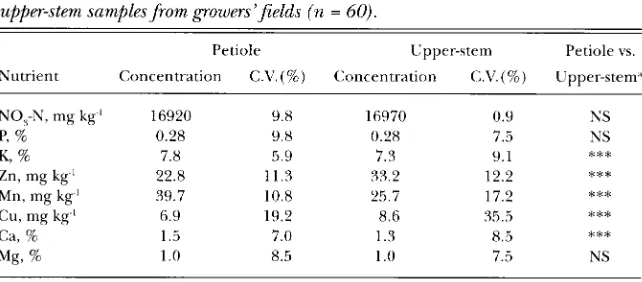
Set —Linear regression equations re-lating petiole and upper-stem nutrient concentrations on the grower data set generally had higher coefficients of simple determination (r 2) than those for the research data set (Table 2). The slope for Zn and the intercepts for P, K, Ca and Zn were significantly (Pr<0.05) different between the two equa-tions (Table 2). The slope difference for Zn was probably not large enough to be of practical consideration, i.e., 1.40 vs. 1.13 (Table 2). Intercept differ-ences may be from analytical errors during sample analysis or surface con-tamination of the samples with nutrients from foliar sprays, soil particles, or disease control sprays. Surface contamination would be more of a prob-lem with the petioles than with upper-stems for the same mass.Petiole and upper-stem means across all samplings from the grower fields were statistically different for K, Zn, Mn, Ca and Cu (Table 3). Differ-ent Zn, Mn and Cu concDiffer-entrations would be expected based on the equa-tions (Table 2). The K concentration difference is of little practical signifi-cance since it is relatively small (Table 3). Coefficients of variation (C.V.) were larger for Mn and Cu in the upper-stems and for NO 3-N in the peti-oles. The larger C.V. for petiole NO B-N may be because some petioles from other positions were included in the sample, although the samples were carefully taken.
826
AMERICAN POTATO JOURNAL(Vol. 71
TABLE
2.-Linear regression equations for research and grower data sets between
fourth petiole (x) and upper-stem (y) for the indicated nutrients, and the
probabil-ity of different intercept or slope parameters between the respective equations. a
Nutrient
Research Field Data Set
Equation r'
Grower Field Data Set
Equation r2
Parameter') Intercept Slope
Pr > F -NO 3-N y = 1547 + 0.94x 0.86' y = 827 + 0.95x 0.92 0.330 0.786
P y = 0.05 + 0.86x 0.79 y = 0.023 + 0.92x 0.93 0.022 0.334
K y =-0.48 + 0.96x 0.79 y -1.27 + 1.10x 0.86 0.038 0.064
Ca y = 0.31 + 0.59x 0.64 y = 0.39 + 0.58x 0.75 0.040 0.965
Mg y = 0.21 + 0.73x 0.77 y = 0.16 + 0.81x 0.90 0.119 0.111
Zn y =-0.2 + 1.40x 0.73 y = 7.3 + 1.13x 0.72 0.038 0.025
Mn y = 6.2 + 0.48x 0.68 y = 8.4 + 0.44x 0.76 0.227 0.243
Cu y = 3.4 + 0.80x 0.32 y = 2.0 + 0.95x 0.21 0.687 0.512
S y 0.17 + 0.52x 0.19 - - -
-All r2 significant at the 0.05 probability level.
bProbability of equation parameters for research and grower data sets being different.
TABLE
3.-Comparison of mean and
C. V.
(coefficient of variation) for petiole and
upper-stem samples from growers' fields (n = 60).
Nutrient
Petiole Concentration C.V.(%)
Upper-stem Concentration C.V.(%)
Petiole vs. Upper-stem'
NO.,-N, mg kg' 16920 9.8 16970 0.9 NS
P, % 0.28 9.8 0.28 7.5 NS
K, % 7.8 5.9 7.3 9.1 ***
Zn, mg kg' 22.8 11.3 33.2 12.2 ***
Mn, mg kg' 39.7 10.8 25.7 17.2 ***
Cu, mg kg' 6.9 19.2 8.6 35.5 ***
Ca, % 1.5 7.0 1.3 8.5 ***
Mg, % 1.0 8.5 1.0 7.5 NS
"NS = nonsignificant; *** = means significantly different at 0.001 probability level.
there will be a tendency to take fewer upper-stems for a sample. However,
the same number of upper-stems and petioles should be taken to adequately
represent a production area. The larger mass of upper-stem sample will
require more drying space and may be more difficult to dry.
nu-1994)
WESTERMANN et al.: NUTRIENT CONCENTRATION827
trient relationships before adopting the upper-stem for other varieties since
nutrient concentration differences among varieties are known (12, 14).
Additional studies may be needed to establish the nutrient relationships if
the stem is excised at different leaf positions. Diurnal and moisture stress
effects on nutrient concentrations in the upper-stem are also unknown.
Before the upper-stem is used to monitor the plant's nutrition status, it will
be necessary to know the relationships between the upper-stem nutrient
concentrations and tuber yields. The petiole vs. upper-stem nutrient
rela-tionships shown in this study suggest that the yield vs. upper-stem nutrient
relationships will probably be acceptable.
This study showed that the petioles below the fourth petiole contained
higher concentrations of NO 3-N, K and Zn, but lower concentrations of P
and Mn. The fourth petiole NO 3-N, P and K diagnostic concentrations now
used for interpreting plant nutrient status can also be used for upper-stem
samples. An upper-stem critical Zn or Mn concentration would be about 28
and 16 mg kg- 1 , respectively, if the fourth petiole critical Zn or Mn
concen-tration was 20 mg kg'. Critical Ca, Mg, Cu or S upper-stem concenconcen-trations
could not be estimated because all this study's concentrations were above
established critical concentrations. The upper-stem plant part was
success-fully used to monitor six commercial potato fields for plant NO 3-N, P and K
status. A significant advantage of the upper-stem is the elimination of
peti-ole selection problems when sampling.
Literature Cited
1. Boawn, L. and G.E. Leggett. 1963. Zinc deficiency of the Russet Burbank potato. Soil Science 95:137-141.
2. Dow, A.I. 1980. Critical nutrient ranges in northwest crops. Western Regional Ext Pub 43, Pullman, WA. 12 p.
3.James, D.W., R.L. Hurst, D.T. Westermann and T.A. Tindall. 1994. Nitrogen and potas-sium fertilization of potatoes: Evaluating nutrient element interactions in petioles with response surfaces. Am Potato J 71:249-265.
4. Kitson, R.E. and M.G. Mellon. 1944. Colorimetric determination of phosphorus as molydivanado phosphoric acid. Ind Eng Chem Anal Ed 16:379-383.
5. Lorenz, O.A. 1944. Studies on potato nutrition: I. The effects of fertilizer treatment on the yield and composition of Kern County potatoes. Am Potato J 21:179-192. 6. Lorenz, O.A. and K.B. Tyler. 1970. Plant and soil analyses prove valuable for potato
grow-ers. Potato Growers of California Reference Book. p. 95-97.
7. Lorenz, O.A., K.B. Tyler and F.S. Fullmer. 1964. p. 226-240. In: Bould, C.A., et al. (eds). Plant analysis and fertilizer problems. Amer Soc Hort Sci, W. F. Humphrey Press, Inc., Geneva, NY
8. Milham, P.J., A.S. Awad, R.E. Paull and J.H. Bull. 1970. Analysis of plant, soils, and water for nitrate using an ion-selective electrode. Analyst 95:751-757.
828
AMERICAN POTATO JOURNAL(Vol. 71
10. Tyler, K.B., O.A. Lorenz and F.S. Fullmer. 1959. Soil and plant analyses as guides in po-tato nutrition. California Agr Exp Sta Bul 781.
11. Ulrich, A. 1948. Plant analysis - methods and interpretations of results. Crops & Soils 1948:157-198.
12. Walworth, J.L. and J.E. Muniz. 1993. A compendium of tissue nutrient concentrations for field-grown potatoes. Am Potato J 70:579-597.
13. Westermann, D.T. 1975. Indexes of sulfur deficiency in alfalfa. II. Plant analysis. Agron J 67:265-268.