O R I G I N A L R E S E A R C H
Open Access
Effects of ferumoxytol on quantitative PET
measurements in simultaneous PET/MR
whole-body imaging: a pilot study in a baboon model
Ronald JH Borra
1,2, Hoon-Sung Cho
3,4, Spencer L Bowen
1, Ulrike Attenberger
5, Grae Arabasz
1, Ciprian Catana
1,
Lee Josephson
3, Bruce R Rosen
1,6, Alexander R Guimaraes
1,7and Jacob M Hooker
1** Correspondence:
[email protected] 1Athinoula A. Martinos Center for
Biomedical Imaging, Massachusetts General Hospital, 149 13th Street, Suite 2301, Charlestown, MA 02129, USA
Full list of author information is available at the end of the article
Abstract
Background:Simultaneous PET/MR imaging depends on MR-derived attenuation maps (mu-maps) for accurate attenuation correction of PET data. Currently, these maps are derived from gradient-echo-based MR sequences, which are sensitive to susceptibility changes. Iron oxide magnetic nanoparticles have been used in the measurement of blood volume, tumor microvasculature, tumor-associated macrophages, and characterizing lymph nodes. Our aim in this study was to assess whether the susceptibility effects associated with iron oxide nanoparticles can potentially affect measured18F-FDG PET standardized uptake values (SUV) through effects on MR-derived attenuation maps. Methods:The study protocol was approved by the Institutional Animal Care and Use Committee. Using a Siemens Biograph mMR PET/MR scanner, we evaluated the effects of increasing concentrations of ferumoxytol and ferumoxytol aggregates on MR-derived mu-maps using an agarose phantom. In addition, we performed a baboon experiment evaluating the effects of a single i.v. ferumoxytol dose (10 mg/kg) on the liver, spleen, and pancreas18F-FDG SUV at baseline (ferumoxytol-naïve), within the first hour and at 1, 3, 5, and 11 weeks.
Results:Phantom experiments showed mu-map artifacts starting at ferumoxytol aggregate concentrations of 10 to 20 mg/kg. Thein vivobaboon data demonstrated a 53% decrease of observed18F-FDG SUV compared to baseline within the first hour in the liver, persisting at least 11 weeks.
Conclusions:A single ferumoxytol dose can affect measured SUV for at least 3 months, which should be taken into account when administrating ferumoxytol in patients needing sequential PET/MR scans.
Advances in knowledge
1. Ferumoxytol aggregates, but not ferumoxytol alone, produce significant artifacts in MR-derived attenuation correction maps at approximate clinical dose levels of 10 mg/kg. 2. When performing simultaneous whole-body18F-FDG PET/MR, a single dose of ferumoxytol can result in observed SUV decreases up to 53%, depending on the amount of ferumoxytol aggregates in the studied tissue.
Implications for patient care
Administration of a single, clinically relevant, dose of ferumoxytol can potentially result in changes in observed SUV for a prolonged period of time in the setting of (Continued on next page)
(Continued from previous page)
simultaneous PET/MR. These potential changes should be considered in particular when administering ferumoxytol to patients with expected future PET/MR studies, as ferumoxytol-induced SUV changes might interfere with therapy assessment.
Keywords:PET; MRI; PET/MR; Multimodal imaging; Ferumoxytol; Attenuation correction
Background
The use of fully integrated PET/MR systems as a clinical imaging modality has in-creased significantly in recent years [1,2]. This novel hybrid technique has many work-flow advantages; however, one of the essential prerequisites for its clinical acceptance is that semi-quantitative PET measures such as standardized uptake values (SUV) are not altered by the endogenous administration of intravenous or oral contrast agents such as gadolinium-based contrast agents (GBCA) or iron oxide-based contrast agents.
In order to obtain quantitative PET information, PET/MR imaging relies on MR in-formation that is processed into an MR-derived attenuation map (mu-map), which in turn can be used for attenuation correction (AC) of PET data [3]. This implies that, be-cause both PET and MRI examinations can be performed simultaneously, there is the potential of MR-related temporal changes (such as injected GBCA) to affect the accur-acy of PET measurements. A recent study evaluated the possible effects of GBCA on PET accuracy in whole-body PET/MR imaging, and no significant effect was found [4]. However, preliminary data on oral iron oxide-based MRCA in the same study did show a significant effect on the quality of MR-based attenuation correction maps.
supplementation are currently ongoing to evaluate the use of ferumoxytol in other patient groups with chronic kidney disease (CKD) with iron deficiency anemia (for example, ClinicalTrials.gov identifiers: NCT01114139, NCT01114217, and NCT01114204) [15].
Ferumoxytol (Feraheme® 30 mg/ml, AMAG Pharmaceuticals) was recently approved by the FDA exclusively for the intravenous treatment of iron deficiency anemia in pa-tients with CDK [16]. The FDA’s decision is apparently based on the improved safety profile (only a single serious adverse event in 750 CDK patients treated with ferumoxy-tol) of the drug compared to other iron compounds used to treat anemia in this par-ticular patient group, such as iron dextran [17,18]. Long-term effects caused by ferumoxytol-derived iron accumulation, in particular in the liver and spleen, on abdom-inal MR data quality have been described in the literature but with very few experi-ments [19-21]. Average-sized patients are administered a single vial of ferumoxytol, which contains 510 mg of elemental iron. Since the human body on average contains around 4 g of iron, a single dose of ferumoxytol adds a substantial amount of iron to the whole-body iron pool in a very short amount of time.
With the advent of PET/MRI technology, it is unknown whether ferumoxytol will have any deleterious effects on quantification with the attenuation correction algo-rithms currently used on PET/MRI platforms. In the case of whole-body PET/MR im-aging, most commonly, a direct segmentation method is used to generate MR-derived mu-maps, which generally do not account for attenuation by bone tissue [22]. In par-ticular settings where delayed uptake of iron oxide-based agents are used, such as lymph node imaging, this is potentially a significant problem because the workflow does not allow for an MR-based attenuation correction map to be obtained prior to the agent’s administration. The purpose of the current study is to quantify the effects of fer-umoxytol on simultaneously obtained quantitative PET/MR data using a phantom and baboon model, in particular possible effects of ferumoxytol over time on observed SUV in multiple abdominal organs. An animal model was chosen for this study because of the need for repeated PET scans within a limited time frame, which would not be pos-sible in human subjects due to the resulting radiation exposure.
We are not aware of any previous studies using ferumoxytol that have addressed this issue. In this study, we use an in vivo model to elucidate potential differences in mu-map artifacts caused by ferumoxytol and ferumoxytol aggregates, as we hypothesize that aggregates cause greater artifacts in gradient-echo-based sequences with in turn larger mu-map artifacts as a result.
Methods PET/MR imaging
All simultaneous PET/MR imaging was performed on a Siemens Biograph mMR sys-tem (Siemens Medical Solutions U.S.A., Inc., Malvern, PA, USA).
Phantom study details
with concanavalin A (Sigma-Aldrich, St. Louis, MO, USA). Large flasks were chosen in order to minimize possible partial volume effects. Ferumoxytol aggregates were pro-duced by adding concanavalin A (Sigma-Aldrich, St. Louis, MO, USA) to ferumoxytol (Feraheme® 30 mg/ml, AMAG Pharmaceuticals, Inc., Lexington, MA, USA). Concanavalin A demonstrates agglutination activity with carbohydrates [23] and formed precipitates with branched polysaccharides [24], which surrounded the bioavailable iron oxide of Feraheme as a protecting layer. Concanavalin A was added to ferumoxytol in a ratio of 30 μM of ConA to 0.7 μg Fe/ml of Feraheme in a buffered (pH 6) solution of 0.15 M NaCl with 1 mM CaCl2and MnCl2. Average measured particle size by laser
dynamic light scattering (DLS) using a Zetasizer (Malvern Instruments, Marlboro, MA, USA) was 17 to 31 nm (from the prescribing information) before and 848 ± 122 nm after addition of concanavalin A. For each phantom pair (ferumoxytol only vs. ferumoxytol aggregates) of a given concentration, identical procedures were followed and similar amounts of iron oxide-containing solution produced, with the only difference the addition of concanavalin A, in order to optimize comparability and to make sure observed effects were due to aggregates only.
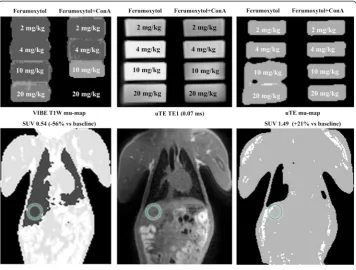
Also, agarose concentration was kept at 1% in all flasks in order not to influence pos-sible differences between concentrations. In order to prevent precipitation of ferumoxy-tol aggregates, all agarose-filled flasks were rotated during the first 60 min while being rapidly cooled in an ice bath. After the agarose had solidified for 24 h, flasks were im-aged using the clinical Siemens Biograph mMR PET/MR system with routinely avail-able sequences. The rationale for the chosen concentrations was to study if tissue ferumoxytol concentrations of a clinical dose of 10 mg/kg (assuming a fully homoge-neous distribution in the body) can potentially influence the obtained MR data. A pic-ture of the phantom and corresponding mu-map is shown in Figure 1.
Animal study details
All procedures in this study complied with the regulations of the Institutional Animal Care and Use Committee of the Massachusetts General Hospital. Baboon studies were performed in the context of other studies performed by our group in order to minimize animal use. A single male baboon (Papio anubis) with a mean weight of 13.35 kg (12.7 kg at baseline and 14 kg at 11 weeks) was used for all imaging studies. The animal was fasted at least 12 h prior to the study, and anesthesia was induced with ketamine (20 mg/kg ketamine with 0.4 mg/kg diazepam or 10 mg/kg ketamine with 0.5 mg/kg xylazene). Endotracheal intubation was performed, and a catheter for radiotracer injec-tion was placed in the antecubital vein. Anesthesia was maintained during the PET/MR scan by isoflurane (0.8% to 1.5%, pure oxygen mixture) without active mechanical ven-tilation. During the scan, physiological parameters (respiratory rate, heart rate, blood pressure, and end-tidal CO2) were monitored continuously. The baboon had not been
in the text and figures to scans acquired after a single administration of ferumoxytol after the baseline scan was performed.
MR imaging-related details
Imaging was performed using the four-channel Body Matrix coil (Siemens Medical Solutions U.S.A., Inc., Malvern, PA, USA) and the built-in spine coil as the receiving coil elements. Gating was performed using respiratory bellows. The following essential scans for PET/MR data analysis and interpretation were obtained:
– Default MR-based attenuation correction (MRAC) scan: T1-weighted (T1W) two-point Dixon 3D volumetric interpolated breath-hold examination (VIBE) sequence with the following parameters: integrated parallel acquisition technique (iPAT) GRAPPA factor 2, repetition time (TR) 3.6 ms, first echo time (TE1) 1.23 ms, second echo time (TE2) 2.46 ms, matrix size 79 × 192, averages 1, field of view (FOV) 50 cm, flip angle (FA) 10°, slice thickness 5.5 mm, and acquisition time (TA) 0:19 min. The resulting in-phase, out-phase, and fat and water images of the same anatomical location were used as input for the proprietary mu-map reconstruction (including lung compartment) on the scanner. This sequence was used prior to every PET scan and at additional time points to assess the effects of ferumoxytol during the time course of a single PET scan. – High-resolution anatomical T1W axial, coronal, and sagittal dual-echo scan with
the following parameters: TR 115 ms, TE1 1.23 ms, TE2 2.46 ms, matrix size 256 × 168, averages 1, FOV 35 cm, phase FOV 65.6%, FA 32°, slice thickness 4 mm, and approximate TA 0:55 min.
– High-resolution fat-suppressed axial anatomical series T2W turbo spin echo (TSE) with the following parameters: iPAT GRAPPA 2, TR 5,264 ms, TE 98 ms, matrix size 488 × 235, averages 2, FOV 18.0 cm, phase FOV 75%, FA 150°, slice thickness 3 mm, and approximate TA 5:46 min. In addition, as a possible alternative for the VIBE-based MRAC, a two-echo ultra-short echo time (uTE) scan was obtained with the following parameters: TR 11.34 ms, TE1 0.07 ms, TE2 2.46 ms, matrix size 192 × 192, averages 2, FOV 30, phase FOV 100%, FA 10°, slice thickness 1.56 mm, and TA 1:35 min.
PET imaging-related details
PET data were acquired after the manual i.v. administration of 162.5 ± 2.4 MBq
18
F-fluoro-2-deoxy-D-glucose (18F-FDG) in a 3-ml solution followed by a 10-ml sa-line flush. Data were obtained dynamically and recorded in list mode format during two (1-, 3-, 5-, and 11-week scans) or three 25-min consecutive PET scans (including the base-line scan in the ferumoxytol-naïve animal), with the first PET scan started at the time of
18
F-FDG injection and the second and third scans started at 30 and 60 min after tracer in-jection. PET data were obtained with an axial FOV of 25.8 cm, transaxial FOV of 59.4 cm, and axial and transaxial resolution of≤4.8 and≤4.7 mm, respectively. Attenuation correc-tion of raw PET data was performed on the scanner console after the scan using the method provided by the manufacturer based on segmentation of anatomical MR images [22] (see MR imaging-related details below). Data of the second PET scan (30 to 55 min) were reconstructed for each of the time points using a 3D-OSEM method and a 4-mm FWHM Gaussian kernel filter.
Data reconstruction, correction, and analysis
A single 1,500-s (25 min) static PET dataset was reconstructed for all 30- to 55-min
18
F-FDG scans for the scans at each time point (baseline, 5 min, 57 min, and 1, 5, and 11 weeks after ferumoxytol injection), and AC was performed using the MRAC scan immediately preceding the acquisition. In addition, for the first visit, the PET data were attenuation corrected with MR-derived mu-maps obtained at 5, 13, 29, 30, 44, and 57 min after the injection of ferumoxytol. Reconstructed and attenuation-corrected PET data and corresponding MR data were exported from the scanner. These files were imported in OsiriX (Osirix Foundation and Pixmeo, Geneva, Switzerland), a software suite equipped with image viewing, fusion, and analysis capabilities [25]. All pixels in PET data were converted to SUV. PET data and corresponding anatomical MR data were automatically fused using Osirix, and fusion quality was visually inspected prior to region of interest (ROI)-based analysis. A visually highly acceptable co-registration of PET/MR datasets was obtained for all measured time points using this method.
co-registered parametric 18F-FDG PET SUV images. In the case of the spleen and pan-creas, an oval ROI (size 0.999 and 0.248 cm2, respectively) was drawn on high-resolution T2W TSE images in the center of the spleen and the corpus area of the pancreas, and then propagated to the PET SUV datasets, similarly to the liver mea-surements. Mean SUV values were recorded for each ROI. Typical location of the liver ROI and effect of incorrect AC on PET SUV are shown in Figure 2.
Results
Phantom imaging
Phantom imaging results are displayed in Figure 1. Because of signal loss due to feru-moxytol aggregates (at 20 mg/kg), the VIBE-based MR-derived mu-map is affected and indicates a different density, although the true density (agarose) is identical. The average observed linear attenuation coefficient (LAC) values with a unit of cm−1(here multiplied by 1,000) are indicated for each flask. No significant artifacts were ob-served at ferumoxytol and ferumoxytol aggregate concentrations up to 10 mg/kg and below (classified as fat, value of 854) with minor differences in mu-map values at 10 mg/kg (which could be partially due to the proximity of the flask to the very high dose 20 mg/kg aggregate flask) with the phantom with 10 mg/kg aggregates being in-correctly classified as soft tissue (value of 1,000). However, very clear differences at 20 mg/kg concentrations for both the ferumoxytol and ferumoxytol aggregate were
observed with the ferumoxytol flask incorrectly classified as a mix between fat and soft tissue (value of 927) and the ferumoxytol aggregate flask incorrectly classified as air (value of 0).
Longitudinal imaging in a baboon before and after i.v. ferumoxytol administration
Mu-maps obtained within the first 5 min of ferumoxytol injection resulted in changes to the mu-map that corresponds to AC PET images with increased SUV. All mu-maps obtained at >13 min demonstrated significant signal loss in the liver, leading to mis-classification of the liver tissue as lung tissue. This is illustrated in Figure 2 with the mu-maps and corresponding AC PET images for time points 5 and 57 min after injec-tion of ferumoxytol. Effects of ferumoxytol at these timepoints on the individual VIBE images are illustrated in Additional file 1. Errors in mu-maps resulted in significant changes in observed SUV, particularly in the liver, both in the acute stage (within 1 h) and at later time points after injection of ferumoxytol. SUV data for the liver, spleen, and pancreas are displayed in Figure 3.
In the case of the liver, in the acute stage, a maximum SUV drop versus baseline was observed at 44 min after injection (0.98 vs. 0.46), reflecting a decrease of 53%. Interest-ingly, after 1 h, the observed SUV stayed fairly constant up to the 11-week time point. A similar trend involving smaller absolute changes was observed in the case of the spleen and pancreas (Figure 3). The biggest change in SUV measured in the spleen area vs. baseline was at the last time point (11 weeks, 77 days), with a decrease of 24% (1.49 vs 1.13) in observed SUV. A similar observation was noted in the case of the pancreas (0.81 vs 0.61, 25% decrease).
Data obtained with the uTE-based sequence in both the ferumoxytol phantom and the baboon are displayed in Figure 4. The uTE sequence allowed for the detection of MR sig-nal in both phantom andin vivoeven in the presence of high tissue iron content, with as a result an improved MR-derived mu-map in tissues with significant iron accumulation.
Discussion
The results of the current study suggest that, depending on the studied organ, a single dose of ferumoxytol can potentially change observed SUV by as much as 53% when using the standard VIBE-based MR-derived mu-maps for PET data attenuation correc-tion. Initially (approximately the first 5 min), during and just after the bolus injection of ferumoxytol, a change in VIBE signal leads to an increased calculated SUV for PET data - the longer term observed effect of ferumoxytol-induced changes in VIBE images,
which persisted for months, and the resulting negative SUV changes in a healthy ba-boon were strongest in the liver and much less predominant in the spleen and pancreas.
To support the difference in early versus late signal changes observed after ferumoxy-tol administration, we compared phantoms prepared with graded concentrations of ei-ther free ferumoxytol or iron aggregates formed from ferumoxytol. Indeed, the highest concentration of free ferumoxytol led to an increase in the derived mu-map value (LAC), whereas the highest concentration of ferumoxytol aggregates dramatically de-creased the mu-map value. These data are consistent with the mechanism proposed for signal differences in the NHP experiments.
Although ferumoxytol is currently not FDA approved as an MR contrast agent, the re-ports in the current literature show that its off-label use has increased significantly over the past years and numerous research studies are currently ongoing to further understand
the benefit of ferumoxytol in cancer and tumor microenvironment imaging. Taking into account the aforementioned increased popularity of the drug, fuelled by its unique ability to assist with non-invasive lymph node staging in cancer imaging, the main reasons why we believe our current findings are of potential (future) clinical importance are twofold:
First, our data strongly suggest that the current method for MR-derived attenuation correction in simultaneous whole-body PET/MR is not optimized to deal with high tis-sue iron concentrations, and therefore, the decision to administer ferumoxytol to a pa-tient (in a research or other setting) should be carefully considered, especially in case future PET/MR scans are considered, for example, for the purpose of treatment evalu-ation. Second, our data suggests that, despite the major acute effects (within hours), the long-term effects of ferumoxytol (several months) are fairly constant over time. This po-tentially provides an opportunity of comparing PET studies with MR-derived AC in the time frame where little (further) change due to tissue iron accumulation can be expected.
Although the findings presented in this manuscript were obtained in a single baboon, we feel that this work points out a highly interesting interaction between the MR and PET modality that warrants further investigation. For example, the findings would need to be reproduced in a larger group, and also possible measures to prevent or reduce the effect altogether, such as (early) minimally invasive chelation therapy, should be explored.
In addition to highlighting the scarce knowledge with regard to the detailed pharma-cokinetics of ferumoxytol in different organs and tissues in vivo, the current work also provides technical perspectives, in particular visualization of the liver using a uTE-based sequence despite high levels of iron, that might aid future methods to obtain artifact-free MR-derived mu-maps. An alternative potentially elegant solution, which was recently proposed by others, might be an optimized combination of both VIBE/ Dixon and uTE MR data of the same anatomical location in order to produce robust and high-quality mu-maps [26]. The injected ferumoxytol dose in the baboon of 10 mg/kg, although on the higher end of a clinical dose for iron replacement therapy and an optimal dose for MR brain CBV studies [12], is likely high for abdominal im-aging, especially in the case of the liver where the blood volume (≈15%) is approxi-mately three times that of the brain (≈5%). This might have exacerbated the effect of ferumoxytol on SUV that we observed.
Conclusions
The use of ferumoxytol, although currently not approved as a routine MR contrast agent, is likely to grow due to its highly interesting vascular, macrophage, and in par-ticular lymph node activity. However, based on data presented in this manuscript, we conclude that in the context of simultaneous PET/MR, improved dose response studies and in particular improved MR-derived AC algorithms are needed prior to its utilization for cancer staging.
Additional file
Additional file 1:Effect of ferumoxytol injection on individual VIBE images and the resulting mu-map.
The effects of ferumoxytol injection on the individual VIBE images (in-phase, out-phase, fat and water) are different at 5 min than at 57 min after injection, which in turn results in different mu-maps.
Competing interests
Authors’contributions
Imaging studies were performed by RJHB and GA, where ferumoxytol aggregate synthesis and phantom production were performed and planned by RJHB, HSC, and LJ. Study design and data analysis (performed by RJHB) received significant input from UA, SLB, CC, and BRR. ARG and JMH conceived the study, participated in its design and coordination, and helped to draft the manuscript. All authors read and approved the final manuscript.
Acknowledgements
The authors want to thank Misha Riley for her expert assistance in creating the phantoms and Shirley Hsu, Helen Deng, and Joseph Mandeville for helpful discussions and assistance related to NHP imaging.
Funding
This research was carried out in whole or in part at the Athinoula A. Martinos Center for Biomedical Imaging at the Massachusetts General Hospital, using resources provided by the Center for Functional Neuroimaging Technologies, P41EB015896, a P41 Biotechnology Resource Grant supported by the National Institute of Biomedical Imaging and Bioengineering (NIBIB), National Institutes of Health. This work also involved the use of instrumentation supported by the NIH Shared Instrumentation Grant Program and/or High-End Instrumentation Grant Program, specifically grant numbers S10RR023452, S10RR022976, and S10RR019933. Further funding was provided by the Sigrid Juselius Foundation, the Instrumentation Research Foundation, the Finnish Medical Foundation, the Paulo Foundation, and the Academy of Finland (130557, 270352). This research was conducted within the nuclear medicine training program supported by US DOE grant DE-SC0008430.
Author details
1Athinoula A. Martinos Center for Biomedical Imaging, Massachusetts General Hospital, 149 13th Street, Suite 2301,
Charlestown, MA 02129, USA.2Medical Imaging Centre of Southwest Finland, Department of Diagnostic Radiology, University of Turku and Turku University Hospital, Turku, Finland.3Center for Advanced Medical Imaging Sciences, Massachusetts General Hospital, Charlestown, MA, USA.4School of Materials Science and Engineering, Chonnam National University, Gwangju, South Korea.5Institute of Clinical Radiology and Nuclear Medicine, University Medical Center Mannheim, Heidelberg University, Mannheim, Germany.6Department of Meridian & Acupuncture, Collaborating Center for Traditional Medicine, East-West Medical Research Institute and School of Korean Medicine, Kyung Hee Uni-versity, Seoul, South Korea.7Division of Abdominal Imaging, Department of Radiology, Massachusetts General Hospital, Harvard Medical School, Boston, MA, USA.
Received: 24 September 2014 Accepted: 4 February 2015
References
1. Catana C, Guimaraes AR, Rosen BR. PET and MR imaging: the odd couple or a match made in heaven? J Nuclear Med Off Publ Soc Nuclear Med. 2013;54:815–24. doi:10.2967/jnumed.112.112771.
2. Drzezga A, Souvatzoglou M, Eiber M, Beer AJ, Furst S, Martinez-Moller A, et al. First clinical experience with integrated whole-body PET/MR: comparison to PET/CT in patients with oncologic diagnoses. J Nuclear Med Off Publ Soc Nuclear Med. 2012;53:845–55. doi:10.2967/jnumed.111.098608.
3. Hofmann M, Pichler B, Scholkopf B, Beyer T. Towards quantitative PET/MRI: a review of MR-based attenuation correction techniques. Eur J Nucl Med Mol Imaging. 2009;36 Suppl 1:S93–104. doi:10.1007/s00259-008-1007-7. 4. Lois C, Bezrukov I, Schmidt H, Schwenzer N, Werner MK, Kupferschlager J, et al. Effect of MR contrast agents on
quantitative accuracy of PET in combined whole-body PET/MR imaging. Eur J Nucl Med Mol Imaging. 2012;39:1756–66. doi:10.1007/s00259-012-2190-0.
5. McCormack PL. Ferumoxytol: in iron deficiency anaemia in adults with chronic kidney disease. Drugs. 2012;72:2013–22. doi:10.2165/11209880-000000000-00000.
6. Weinstein JS, Varallyay CG, Dosa E, Gahramanov S, Hamilton B, Rooney WD, et al. Superparamagnetic iron oxide nanoparticles: diagnostic magnetic resonance imaging and potential therapeutic applications in neurooncology and central nervous system inflammatory pathologies, a review. J Cerebral Blood Flow Metab Off J Int Soc Cerebral Blood Flow Metab. 2010;30:15–35. doi:10.1038/jcbfm.2009.192.
7. Herborn CU, Vogt FM, Lauenstein TC, Dirsch O, Corot C, Robert P, et al. Magnetic resonance imaging of experimental atherosclerotic plaque: comparison of two ultrasmall superparamagnetic particles of iron oxide. J Magnetic Reson Image JMRI. 2006;24:388–93. doi:10.1002/jmri.20649.
8. Hyodo F, Chandramouli GV, Matsumoto S, Matsumoto K, Mitchell JB, Krishna MC, et al. Estimation of tumor microvessel density by MRI using a blood pool contrast agent. Int J Oncol. 2009;35:797–804.
9. Guimaraes AR, Rakhlin E, Weissleder R, Thayer SP. Magnetic resonance imaging monitors physiological changes with antihedgehog therapy in pancreatic adenocarcinoma xenograft model. Pancreas. 2008;37:440–4. doi:10.1097/MPA.0b013e31817c5113.
10. Choi SH, Moon WK. Contrast-enhanced MR imaging of lymph nodes in cancer patients. Korean J Radiol Off J Korean Radiol Soc. 2010;11:383–94. doi:10.3348/kjr.2010.11.4.383.
11. Farrell BT, Hamilton BE, Dosa E, Rimely E, Nasseri M, Gahramanov S, et al. Using iron oxide nanoparticles to diagnose CNS inflammatory diseases and PCNSL. Neurology. 2013. doi:10.1212/WNL.0b013e31829bfd8f 12. Varallyay CG, Nesbit E, Fu R, Gahramanov S, Moloney B, Earl E, et al. High-resolution steady-state cerebral blood
volume maps in patients with central nervous system neoplasms using ferumoxytol, a superparamagnetic iron oxide nanoparticle. J Cerebral Blood Flow Metab Off J Int Soc Cerebral Blood Flow Metab. 2013;33:780–6. doi:10.1038/jcbfm.2013.36.
MR imaging with ferumoxytol versus gadoteridol and correlation with survival. Radiology. 2013;266:842–52. doi:10.1148/radiol.12111472.
14. Gunn AJ, Seethamraju RT, Hedgire S, Elmi A, Daniels GH, Harisinghani MG. Imaging behavior of the normal adrenal on ferumoxytol-enhanced MRI: preliminary findings. AJR Am J Roentgenol. 2013;201:117–21. doi:10.2214/AJR.12.9357.
15. Goldberg ND. Iron deficiency anemia in patients with inflammatory bowel disease. Clin Exp Gastroenterol. 2013;6:61–70. doi:10.2147/CEG.S43493.
16. Lu M, Cohen MH, Rieves D, Pazdur R. FDA report: Ferumoxytol for intravenous iron therapy in adult patients with chronic kidney disease. Am J Hematol. 2010;85:315–9. doi:10.1002/ajh.21656.
17. Singh A, Patel T, Hertel J, Bernardo M, Kausz A, Brenner L. Safety of ferumoxytol in patients with anemia and CKD. Am Jo Kidney Dis Off J National Kidney Foundation. 2008;52:907–15. doi:10.1053/j.ajkd.2008.08.001.
18. Auerbach M. Ferumoxytol as a new, safer, easier-to-administer intravenous iron: yes or no? Am J Kidney Dis Off J National Kidney Foundation. 2008;52:826–9. doi:10.1053/j.ajkd.2008.09.006.
19. McCullough BJ, Kolokythas O, Maki JH, Green DE. Ferumoxytol in clinical practice: implications for MRI. J Magnetic Reson Image JMRI. 2013;37:1476–9. doi:10.1002/jmri.23879.
20. Storey P, Lim RP, Chandarana H, Rosenkrantz AB, Kim D, Stoffel DR, et al. MRI assessment of hepatic iron clearance rates after USPIO administration in healthy adults. Investig Radiol. 2012;47:717–24. doi:10.1097/
RLI.0b013e31826dc151.
21. Schieda N. Parenteral ferumoxytol interaction with magnetic resonance imaging: a case report, review of the literature and advisory warning. Insights into imaging. 2013. doi:10.1007/s13244-013-0262-8
22. Wagenknecht G, Kaiser HJ, Mottaghy FM, Herzog H. MRI for attenuation correction in PET: methods and challenges. MAGMA. 2013;26:99–113. doi:10.1007/s10334-012-0353-4.
23. Sumner JB, Howell SF. Identification of hemagglutinin of jack bean with concanavalin A. J Bacteriol. 1936;32:227–37. 24. Goldstein IJ, Hollerman CE, Smith EE. Protein-carbohydrate interaction. II. Inhibition studies on the interaction of
concanavalin a with polysaccharides*. Biochemistry (Mosc). 1965;4:876–83. doi:10.1021/bi00881a013.
25. Rosset A, Spadola L, Ratib O. OsiriX: an open-source software for navigating in multidimensional DICOM images. J Digit Imaging. 2004;17:205–16. doi:10.1007/s10278-004-1014-6.
26. Berker Y, Franke J, Salomon A, Palmowski M, Donker HC, Temur Y, et al. MRI-based attenuation correction for hybrid PET/MRI systems: a 4-class tissue segmentation technique using a combined ultrashort-echo-time/Dixon MRI sequence. J Nuclear Med Off Publ Soc Nuclear Med. 2012;53:796–804. doi:10.2967/jnumed.111.092577.
Submit your manuscript to a
journal and benefi t from:
7Convenient online submission
7Rigorous peer review
7Immediate publication on acceptance
7Open access: articles freely available online
7High visibility within the fi eld
7Retaining the copyright to your article