Adaptation of batch experiment data to the design of anaerobic
continuous digesters
Asinyetogha H. Igoni
(Department of Agricultural and Environmental Engineering, Faculty of Engineering, Rivers State University of Science and Technology, Nigeria)
Abstract: The design of a continuously stirred tank reactor (CSTR) for the processing of municipal solid waste (MSW) to produce biogas required an investigation of the kinetic parameters of the substrate relevant to the determination of reactor dimensions. The determination of these parameters is usually complicated with an experimental CSTR set-up. Therefore, it is preferred to use a batch-scale experimentation to determine the parameters. However, because of the differences between the batch and continuous processing, the batch experimentation parameters cannot be directly applied to the design of the CSTR. Some previous researchers had made a comparative evaluation of the batch and continuous processing systems, and developed a procedure for adapting batch experimentation data to the design of continuous reactors. In this study, laboratory scale batch digesters were used to determine the kinetic parameters of MSW, with the said procedure, they were adapted to the design of a CSTR for the digestion of MSW in the production of biogas. This paper presents a successful application of batch experimentation data on MSW to the design of a CSTR for MSW in Port Harcourt metropolis, Nigeria.
Keywords: batch experiment data, anaerobic continuous digester, biogas production, municipal solid waste
Citation: Asinyetogha H. Igoni. 2016. Adaptation of batch experiment data to the design of anaerobic continuous digesters. Agricultural Engineering International: CIGR Journal, 18 (2):378-387.
1 Introduction
1The anaerobic digestion of Municipal solid Waste (MSW) for the production of biogas refers to the breakdown of the organic components of the waste by obligate anaerobes during methanogensis. The decomposition process is somewhat complex, as it involves several stages. Reynolds and Richards (1996) identified three different stages as i) liquefaction of solids; ii) digestion of soluble solids; and iii) gas production. It is generally acclaimed (Wong, 1982) that in biological processes, the theoretical basis for the kinetics of bacterial growth, decay and substrate utilization reactions derives from an understanding of autocatalytic reactions
Received date: 2015-05-01 Accepted date: 2016-05-16 *Corresponding author: Asinyetogha H. Igoni, Department of Agricultural and Environmental Engineering, Faculty of Engineering, Rivers State University of Science and Technology, P. M. B. 5080, Port Harcourt, Nigeria. E-mail: [email protected]; Tel: +234(0)802-312-3471
firstly characterized by Michaelis-Menten (1913) in enzyme-catalysed fermentation reactions. These were later elaborated in the form of continuous growth in pure culture microbial systems by Monod (1949) and Novick and Szilard (1950).
Levenspiel (1999) said it is easy to interpret the result of the experimental batch reactor.
The considerations are also in relation to the thermodynamics of the biochemical process, which are useful in establishing the relative variations of steady state concentrations of reactants and products from equilibrium, as Gennis (2013) said that biological systems are always out of equilibrium and better considered to be in steady state. This is because in the steady state condition, substrates are introduced into the system at a predetermined rate and the products are produced. In this regard, the interrelationship between biochemical kinetics and thermodynamics of enzyme-catalysed reactions has been expressly provided by Haldane relations (Purich and Allison, 1999), which show the apparent equilibrium constant in terms of kinetic parameters in the steady state rate equilibrium.
As a result of the relative ease with which experimental data are obtained from the batch processing, it became expedient to establish a relationship between the batch and continuous reactors in order to determine the possibility of adapting the batch experimentation data to the design of continuous reactors. Bailey and Ollis (1986) presented a comparative review of batch and continuous processes in terms of biomass production, substrate utilization and product yield. They stated that it is possible to make preliminary quantitative design estimates for continuous processes using batch-reaction information.
In the evaluation of the performances of batch and continuous reactors in the generation of biogas from municipal solid waste under anaerobic conditions, Igoni (2006) used the results of a batch experimentation of the anaerobic digestion of municipal solid waste in the design and estimation of values for the continuous digester. This paper presents the adaptation of batch experimentation data in the design of a continuous digester for the processing of municipal solid waste for biogas generation.
2
Methodology
2.1 Relationship between batch and continuous biological reactors
In relating batch experimental data to the design of continuous digesters, Bailey and Ollis (1986) made an implicit assumption that there is a connection between batch kinetics and the kinetics of continuous reaction processes. They established a qualitative relationship between batch and continuous processing times. According to their theory, if tb and tc represent respectively the batch and continuous holding times required to convert the substrate at an initial cell concentration Co into a final concentration Cf, then;
(1)
and
(2)
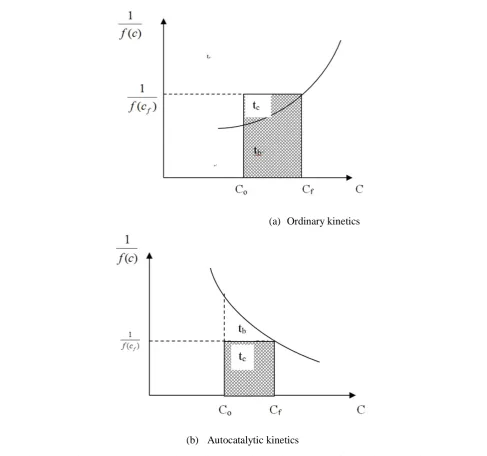
These equations are better interpreted geometrically for both ordinary and autocatalytic kinetics. Ordinary kinetics involves mainly non-biological materials where f(C) is a decreasing function of „C‟. This means that, an increase in cell concentration in ordinary kinetics will lead to a decreased rate in its formation, which is its rate of growth, while in autocatalytic kinetics, the reverse is the case. In autocatalytic reactions, like cell growth, f(C) increases with „C‟. Autocatalytic processes involve
biological materials, like MSW in Port Harcourt metropolis, Nigeria, in which the kinetics of growth is directly proportional to the concentration, as presented by Igoni et al. (2006).
Geometrically, a plot of ( )against C is used to
depict the holding times for the processes. Figure (1a) is a schematic representation of this plot, where tb is the area under the curve, from Co to Cf, and tc is the area of the
rectangle with sides of length Cf – Co and ( ).
f o C C bC
f
dC
t
)
(
)
(
f o f cC
f
C
C
F
V
These representations are made for both ordinary and autocatalytic kinetics, where it is evident that while tb is less than tc in ordinary kinetics, it is greater in autocatalytic kinetics. However, a quantitative relationship is based on the assumption that the fermentation can be described by only one variable, like cell concentration, if for the batch system
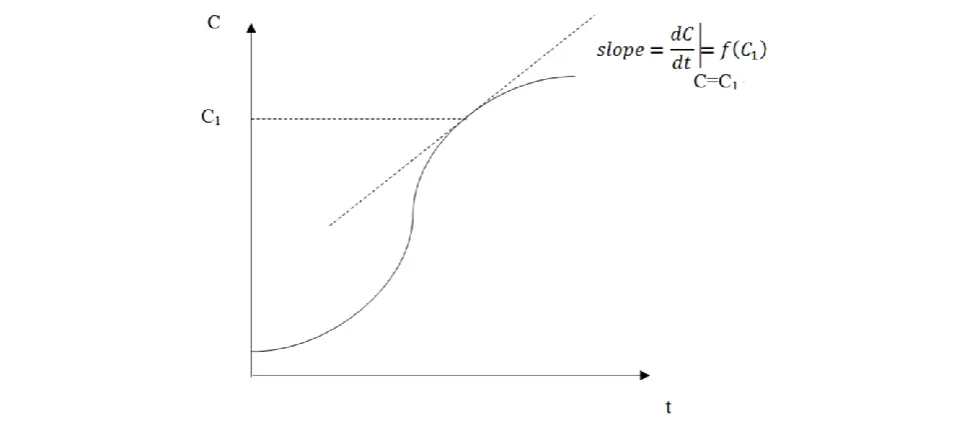
(3)
The slope of the batch concentration-time curve at any given concentration will give the value of f(C) at that particular concentration C, as shown in Figure 2.
(a) Ordinary kinetics
(b) Autocatalytic kinetics
Figure 1(a &b) Graphical representations of mean residence time Adopted from Bailey and Ollis (1986); Levenspiel (1999).
Consequently, from the reduced batch data a plot of f(C) against „C‟ can be generated thus in Figure 3:
If for the continuous system,
f(C*) = D (C* - Co) (4)
then the steady-state concentration (C*) can be determined by drawing a straight line representing the right hand side of the equation, with slope, D, through the „C‟ axis at C = Co. The intercept of this straight line
with the f(C) plot gives the continuous processing effluent concentration. In its reverse form, the dilution rate required to achieve a known concentration can also be determined.
Generally, although there are clear limitations to the use of batch experimentation data to design continuous processing systems, Bailey and Ollis (1986) insisted that batch data are useful in a qualitative sense for choosing a processing configuration for a continuous reactor. They also said that preliminary quantitative design estimates based on batch reaction information can be made for continuous processes.
Figure 2 Determination of f(C) from batch data Adopted from Bailey and Ollis (1986)
2.2 Reactor experimentation
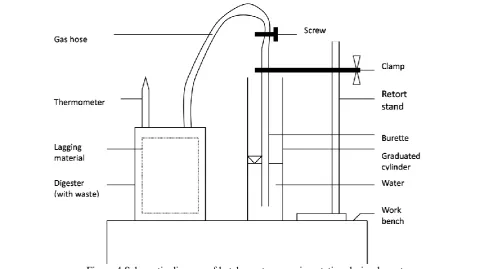
To investigate the kinetics of municipal solid waste, five batch-wise anaerobic digesters each of which is 5
liters volume were set up for this experiment. The schematic diagram of the experimental design layout for a single batch reactor set-up is shown in Figure 4.
The digesters were improvised with large cans because of the limitation of the unavailability of model digesters, but deriving substantial impetus from Hobson et al. (1981), who said “with a batch digester a smaller experimental system may be suitable as the digester has only to be loaded once and may not even need to be stirred. One or two litres could be big enough”. The
containers were properly lagged with wool material of about 25 mm thickness, to minimize the interaction between the temperatures inside and outside of the digesters.
Two perforations were made on the cover of the digester through which the gas hose and thermometer were fitted. The hose extending from the digester top was connected to the tail of a burette, which in turn was then partly immersed in water in a graduated cylinder. The waste materials were processed (shredded and mashed), and the digesters were then loaded with 2 kg of organic MSW, which was diluted to a 26.7% total solids (TS)
concentration after metals, glass and other non-biodegradable materials had been removed.
The properties of MSW relevant to its anaerobic biodegradation was investigated and presented by Igoni et al. (2007). The TS concentration was determined by adopting the procedure for the determination of TS outlined in 2540 G of Standard Methods for the Examination of Water and Waste Water (APHA, 1995); and the moisture content was determined by the oven– drying method.
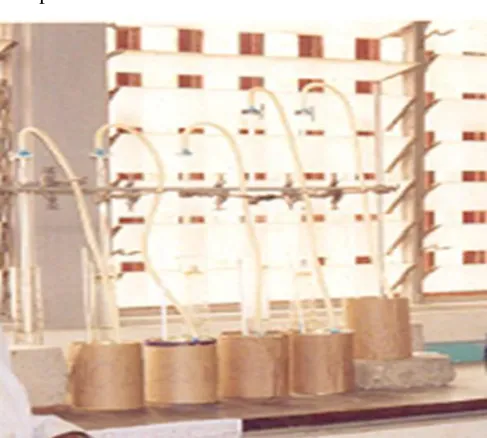
for determining soil organic matter (Walkley and Black, 1934), and the nitrogen was determined with the usual macro-Kjedahl method. The thermometer, was passed into the headspace of the digester, and measured the temperature of the headspace inside of the digester. The ambient temperature was measured from maximum and minimum thermometers at the same time. These temperature measurements were taken at 0800 hours and 1400 hours, and aimed at determining temperature variation within and outside the digester, to ensure proper digester insulation with respect to digester construction materials. After these initial measurements from the waste replications, the digesters were made airtight with glue and other adhesives, and the set-up allowed running. Each of the digesters was dismantled at intervals of 5 days, which gave the experimentation a total lifespan of 25 days. At each dismantling, substrate (COD) and microbial (MLVSS) concentration measurements were repeated. The full view of the reactor experimentation
set-up is shown in Plate 1.
Plate 1 Full view of digesters experimental set-up
3
Results and discussion
The results from the batch experimentation for the anaerobic digestion of the municipal solid waste and the data subsequently deduced from them are Tables 1-3.
Table 1 Experimental batch digesters' data
Digester No.
Duration of digestion, t (days)
Initial MSW concentration, So
(mg/L)
Effluent MSW concentration, Se (mg/L)
Initial microbial concentration, Xo
(mg/L)
Effluent microbial concentration, Xe
(mg/L)
- 0 462.12 - 32.05 -
1 5 462.12 328.77 32.05 114.31 2 10 462.12 78.71 32.05 206.45 3 15 462.12 26.49 32.05 137.45 4 20 462.12 13.19 32.05 127.89 5 25 462.12 5.43 32.05 12.87
Table 2 Reduced data from batch experimentation for the determination of process kinetic parameters
Digester No.
Duration of digestion, t (days)
_
𝑋 𝑋 𝑡 -In (Se/So) So – Se So - Se/Xt In (So/Se)/Xt
- 0 - 0 0 - - -
1 5 73.18 365.9 0.340 133.35 0.364 0.00093 2 10 119.25 1192.5 1.770 383.41 0.322 0.00148 3 15 84.75 1271.3 2.859 435.63 0.343 0.00225 4 20 79.97 1599.4 3.556 448.93 0.281 0.00222 5 25 22.46 561.5 4.444 456.69 0.813 0.00791
𝑋 = average cell mass concentration during the biochemical reaction - that is 𝑋 = ½(Xo + Xt), where Xo and Xt
are the cell mass concentrations at the respective times t = 0 and t = t (Reynolds and Richard, 1996)
Table 3 Reduced data from batch experimentation for determination of CSTR parameters
Rate of MSW utilization,
dS/ dt, mg/l/day
Specific rate of MSW utilization,
U, day-1 1/U
Rate of growth of microbes,
dX
/dt,
mg/L/day
Mean cell residence time,
, days
1
/
1
/Se
0 0 0 0 - - -
With the method of Bailey and Ollis (1986) in use of batch experimentation data for the design of a CSTR, which results are presented in Table 3, and the procedure for the determination of kinetic parameters outlined by Viessman and Hammer (1999), the curves in Figures 5 to 7 are obtained. Notably the negative growth rate of microbes of -0.77 in the last row of the fourth column of Table 3 is indicative of a declining growth rate of the microbes during the endogenous phase of the microbial growth. So, with a maximum growth rate of microbes of 17.44 mg/L/day obtained with declining substrate utilization, it confirms the postulation of Reynolds and Richards (1996) that substrate kinetics is founded on the premise that as organisms grow, substrates are consumed; so that the rate of decrease in substrate concentration is proportional to the rate of increase of the concentration of the organism. At the point of the reduction in the growth rate of microbes, there will not be any further digestion of the MSW, since no biomass will grow as a result of consumption of the substrate. This further corroborates the view of Hobson et al. (1981) when they defined a critical or washout dilution rate as a point in the processing when the rate of growth of microbes and substrate utilization are at their highest possible values. At this critical point there would be a need to inoculate the system with fresh microbial charge or recycle system effluent in order to enhance microbial activity. So, clearly the design of a CSTR based on the reduced data in Table 3 will result in continuous processing times much lower than that for a corresponding batch reactor. This also supports the theory about the relationship between batch and continuous processing times for autocatalytic processes (Hobson et al, 1981).
The critical or washout dilution rate is attained under steady state conditions when the rates of substrate utilization and microbial growth do not change with time
(i.e.
0
dt
S
d
dt
X
d
). Therefore, a non-zero cell
population can only be maintained at steady state. Deriving from Monod kinetics, the defining relationship
between the substrate and microbial concentrations at steady state are expressed in equations (5) and (6).
X
k
X
S
K
S
U
dt
S
d
d S
max (5)or
X
k
X
S
K
S
Y
dt
S
d
d S
[
]
1
max (6)Figure 5 is a plot of
U
I
against
Se
1
obtained by the
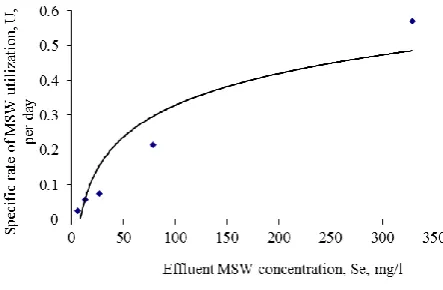
linearization of the steady state Equation (5). From the solution of the Equation of Figure 5 using the Microsoft chart editor, and Figure 6, which presents the direct relationship between U and Se, it is possible to determine and verify the half saturation constant Ks.
Figure 5 Plot for the determination of „k‟ and „Ks‟
Figure 6 Plot for verification of half saturation constant, Ks, value
From Figure 5,
1
204
.
6
2
.
6189
e
From where, intercept of curve =
k
1
(day) and slope =
k
Ks
(mg l-1 day-1) are determined
Therefore,
k
1
= 2.6189 or k = 0.382 day-1
Since
k
Ks
= 204.6
Ks = 204.6 x k = 204.6 x 0.382 = 78.16 mg/l =0.0782 kg/m3
These values of k = 0.382 day-1 and Ks = 78.16 mg/L, particularly in relation to the influent substrate (MSW) and microbial concentrations, suggest that the digesting microbes require a much longer time to regenerate, and indeed sluggish in their performance. This is a corroboration of the earlier deductions made from Table 3. This indication is understandable because the experimental investigation did not incorporate an inoculation of the digester feed with seed biomass to prime the process but rather depended on a self-generation of biomass and subsequent regeneration. This accounts for why Figure 7 displayed a sluggish growth of microbes between 0 and 5 days before an eventual accelerated growth up to day 10.
Figure 7 Growth of microorganisms with time of digestion
This observation would further suggest that actual or practical digesters for MSW would require an inoculation
of the feed stream with microbes, or perhaps an operating system with cell recycle. The indication here is that the MSW on its own does not possess and/or generate sufficient microorganism for its effective and efficient degradation; and therefore would require an external aid. This aid could be in the form of inoculating or mixing the MSW with other organic waste products that are easily degradable or introducing fresh bacteria into it or recycling the sludge liquor from an already digested MSW.
From Figure 8, the growth yield of microbes (Y) is obtained as the slope of the curve and the intercept as the lyses coefficient (kd).
Figure 8 Plot for the determination of Y and kd
slope =
4708
.
0
368
.
0
Y
Y = 0.3293
This value of the growth yield coefficient gives the impression that more cells are formed per unit of the MSW degraded. This is indeed traceable to the use of the mixed liquor volatile suspended solids (MLVSS) as an index for the assessment of the mass of biomass.
The specific rate of growth of microorganisms, max, is determined using the expression in Equation (7) for the computation of the maximum rate of substrate utilization per unit of mass of cells produced, k, thus:
(7)
max = 0.3293 x 0.382 = 0.126 day -1
Continuous reactor experimental set-up for the determination of reactor design parameters is usually very complicated and expensive. On the other hand, the simplicity of the batch reactor experimental set-up pre-disposes it to be used frequently for all such reactor experimentations. This is because effective relationships have been established between the batch and continuous processing systems, considering the kinetics of the processes. The fundamental difference between the batch and continuous systems is in their flow regimes. In the CSTR, substrate and microbial concentrations are completely dependent on the flow rate; but, at steady state, it is possible to assume an equilibration of system parameters in both batch and continuous systems, especially in the rate of change of substrate and microbial concentrations. This relationship has engendered the development of a method to adapt data obtained from batch reactor experimentations to the design of continuous processing systems. So, it is now possible to apply the results of batch experimentation to continuous processing. This method was successfully used in obtaining data for the design of a continuously stirred tank reactor for anaerobic digestion of MSW in Port Harcourt, Nigeria for the production of biogas.
References
American Public Health Association (APHA). 1995. Standard Methods for the Examination of Water and Wastewater, 19th Edition; Greenberg A. E. (Ed). Byrd Springfield, Washington D. C. 1100pp.
Bailey, J. E., and D. F. Ollis. 1986. Biochemical Engineering Fundamentals; McGraw-Hill Book Publishers, New York, 753pp.
Gennis, R. B. 2013. Foundations and applications of physical biochemistry.
http://www.sci.ccny.cuny.edu/~gunner/Pages-422/PDF/u nt/Gennis-3-thermo-bio-rxn.pdf
Hobson, P. N., S. Bousfield, and R. Summers. 1981. Methane production from agricultural and domestic wastes, Applied Science Publishers Ltd., London. 269pp. Igoni, A. H. 2006. “Design of anaerobic bioreactors for the
simulation of biogas production from municipal solid
waste”. PhD. Thesis of the Rivers State University of Science and Technology, Nigeria. 261pp.
Igoni, A. H., M. F. N. Abowei, M. J. Ayotamuno, and C. L. Eze. 2006. “Biokinetics of anaerobic digestion of municipal solid waste”. Newviews Engineering Analysis and Modelling, 1(1): 98-112.
Igoni, A. H., M. J. Ayotamuno, S. T. Ogaji, and S. D. Probert. 2007. “Municipal solid waste in Port Harcourt, Nigeria”. Applied Energy 84(6), 664-670
Levenspiel, O. 1999. Chemical Reaction Engineering, (3rd Edition). John Wiley and Sons, Inc; New York. 668pp.
Michaelis, L. and M. L. Menten. 1913. Biochem, 49, 333.
Monod, J. 1949: “The Growth of Bacterial Cultures”, Annual Review of Microbiology, Vol 111.
Novick, A. and L. Szilard. 1950. “Experiments with the Chemostat on Spontaneous Mutations of Bacteria”. Proceedings of National Academy of Science,USA. 708-719.
Purich, D. L., and R. D. Allison. 1999. Handbook of Biochemical Kinetics: A Guide to Dynamic Processes in the Molecular Life Sciences. Academic Press. 788pp.
Reynolds, T. D. and P. A. Richards. 1996. Units Operations and Processes in Environmental Engineering. Second Edition, PWS Publishing Company, Boston. 798p.
Viessman, W. (Jr) and M. J. Hammer. 1993. Water Supply and Pollution Control. Harper Collins College Publishers New York, 513-679.
Walkley, A. and I. A. Black. 1934. An examination of the Degtjareff method for determining soil organic matter and a proposed modification of the Chromic Acid Titration Method. Soil Science. 37(1): 29-38
Wong, K. K. 1982. “Biological kinetics of gas production from the anaerobic digestion of palm oil mill effluent”. Non-Conventional Energy Sources. ACIF Series - Vol. 3, Furlan, G. et al (Eds). Proceedings of the First Latin American School and Third International Symposium. 543-561.
Nomenclature
tb - Batch holding time, days
tc - Continuous holding time, days
So - Initial concentration of substrate (MSW), mg/l
Se - Final/Effluent substrate concentration, mg/l
S - Substrate concentration at any time,t, mg/l V - Volume of digester, m3
F - Volumetric flow rate of feed and effluent streams, m3/day
t - Duration of digestion (batch experimentation), days Co, Xo - Initial microbial concentration, mg/l
Cf, Xe - Final/Effluent microbial concentration, mg/l
C, X - Microbial concentration at any time, t, mg/l ϑ - Mean cell residence time, days
U - Specific rate of substrate utilization, day-1 kd - Lyses (Endogenous decay) coefficient, day-1
μmax - Maximum growth rate of micro-organisms, day-1
Y - Yield coefficient
Ks - Half saturation constant, mg/l
k - Maximum rate of substrate utilization, day-1 COD - Chemical Oxygen Demand, mg O2/l
TS - Total Solids, %
MLVSS- Mixed Liquor Volatile Suspended solids, % MSW - Municipal Solid Waste
CSTR - Continuous Stirred Tank Reactor COD - Chemical Oxygen Demand, mg O2/l
TS - Total Solids, %
MLVSS- Mixed Liquor Volatile Suspended solids, % MSW - Municipal Solid Waste