Please cite this article as: M. Sadat Rezaee, A. Haeri, S. Noori, Automotive Vendor's Performance Evaluation and Improvement Plan Presentation by Using Data Envelopment Analysis, International Journal of Engineering (IJE), IJE TRANSACTIONS B: Applications Vol. 31, No. 2, (February 2018) 374-381
International Journal of Engineering
J o u r n a l H o m e p a g e : w w w . i j e . i rAutomotive Vendor's Performance Evaluation and Improvement Plan Presentation by
Using a Data Envelopment Analysis
M. Sadat Rezaee, A. Haeri*, S. Noori
School of Industrial Engineering, Iran University of Science & Technology, Tehran, Iran
P A P E R I N F O
Paper history:
Received 09 July 2017
Received in revised form 10 September 2017 Accepted 12 October 2017
Keywords:
Data Envelopment Analysis Efficiency Score Decision Making Units The Dual DEA Model Improvement Plan Automotive Industry
A B S T R A C T
Vendors play a key role in their company's success, so having a vendor's performance evaluation system in order to identify strengths, areas of improvement and profitability in any company is essential. In this paper, a data envelopment analysis (DEA), which is a technique to evaluate the performance of decision-making units (DMUs), is first studied. Then, the efficiency scores of 66 automotive vendors based on the DEA based on the CCR model are calculated using Lingo software. Then, based on the efficiency scores of each vendor, an improvement plan with the help of the dual DEA model is presented to increase the efficiency scores of inefficient vendors. Finally, it will be clear that each inefficient vendor for improving the inefficiency should focus on which of the factors.
doi: 10.5829/ije.2018.31.02b.23
1. INTRODUCTION1
Nowadays, the performance evaluation in organizations is the most important processes and management tools for improving existing status. The performance evaluation of vendors is a crucial subject for managing an efficient company. In addition, managers have an interest in identifying the most efficient vendor. ISO 9001 is a QMS (quality management system) standard that is widely adopted by many companies, including an automotive industry. It is based on eight quality management principles, namely customer focus, engagement of people, process approach, system approach to management, continual improvement, factual approach to decision making, and mutually beneficial supplier relationship. The standard describes the requirements of a QMS that needs to be implemented completely. However, many of the ISO 9001 certified companies are incapable to meet the standard’s requirements properly. Thus, this paper aims to propose a hybrid approach including the data
*Corresponding Author’s Email: [email protected](A. Haeri)
envelope analysis (DEA) and QMS that can be used to evaluate the performance of automotive vendor’s in meeting standard’s requirements. An improvement plan is then presented to increase the efficiency of inefficient DMUs. The proposed approach of this paper is expected to identify strength and weakness points in the performance of automotive vendors in terms of quality. Furthermore, it will illustrate the areas of improvement. Yadav and Goel [1] presented a quality improvement plan for the customer satisfaction in an automotive industry to improve the vehicle quality, achieve higher customer satisfaction (CS), improve business effectiveness, and develop higher-quality products with fewer resources in less time. The suggested framework follows steps: identify and prioritize improvement opportunities, set attribute-level CS targets, establish attribute-level objective metric (measurable) targets, cascade top-level targets to lower-level elements (components) and optimize component-level design.
in an automotive company. This methodology was useful at the improved product cost, functionality and quality accomplishment and in accordance with customer needs. Heuvel et al. [3] used the Six Sigma approach and ISO 9001: 2000 with each other to help resolve some of the problems at Red Cross Hospital. The results included shortening the length of stay of COPD patients, reducing errors in invoices from temp agencies, revision of the terms of payment, reducing the number of mistakes in invoices, rooming-in in the children’s department and reducing the number of patients on intravenous antibiotics. Thompson et al. [4] by using the DEA method analyzed the efficiency of 14 integrated oil companies for the years 1980-1991. The inputs of the DEA models were total costs incurred, proved crude oil and natural gas reserves at previous year-end, and the outputs were additions made to crude oil, natural gas reserves by exploration, crude oil and natural gas production for sale from its respective proved reserves. They found that of the 168 DMUs were evaluated, 118 DMUs were efficient and 50 were inefficient. For this purpose, they used an assurance region (AR) method. At the end, they suggested the dual DEA model for improving the inefficient DMUs.
Nepal et al. [5] used a fuzzy AHP (analytic hierarchy process) approach to prioritization of customer satisfaction attributes in target planning for automotive product development. Aggogeri and Gentili [6] used the Six Sigma methodology to increase the performance level of industrial processes and systems in the automotive industry. They indicated that Six Sigma can give an important solution for those companies that want to achieve customer satisfaction by considering the continuous improvement of the processes. Rezaee and Ghanbarpour [7] developed the DEA method to multi-group state to evaluate 59 Iranian manufacturing industries. The inputs of the DEA models were energy resources such as the amount of fossil fuel, water and electricity consumption and a non-energy resource such as the number of employees. Outcomes of this paper indicated that the efficiency scores and energy consumption performance are greatly changed when each industry is assessed in its own group. Torabi and Shokr [8] used a common weight data envelopment analysis (CWDEA) model in a material selection problem including both quantitative and qualitative criteria in an effective manner. Their proposed model is not able to produce a full ranking. Sadjadi and Bayati [9] extended a generalized network DEA models to evaluate the efficiency of two-tier supplier considering cooperative and non-cooperative strategies. Wu et al. [10] proposed a cross-efficiency evaluation approach based on Pareto improvement, which could improve the cross-efficiencies of the DMUs.
Lijo et al. [11] considered the combination of life cycle assessment (LCA) and DEA methodologies to
identify efficient operational plants and propose improvement measures for the inefficient ones. Kourtit et al. [12] used a DEA synthesis to present a comprehensive efficiency improvement strategy for 39 world cities. Yousefi et al. [13] used a new network goal programming DEA (GP-DEA) model to present improvement solutions for all efficient and inefficient units based on experts’ opinions. He et al. [14] used ideal points to improve the interval efficiencies in the DEA for inefficient DMUs. In addition, decision making for the performance evaluation and improvement is a critical conecpt in different discplines, such as its applications in quality [15], supply chain coordination [16] and pharmaceutical supply chain [17]. In previous research, different approaches are used to present an improvement plan especially in the automotive industry. While in this study, the dual DEA model is used to present the improvement plan with a focus on increasing the output factors and decreasing the input factors.
2.DATA ENVELOPMENT ANALYSIS (DEA)
The data envelopment analysis is a mathematical programming technique for evaluating the performance of decision making units (DMUs) by supposing multiple inputs and outputs. The DEA method was developed by Charnes, Cooper and Rhodes (CCR) in 1978 as shown below:
(1)
s.t.
(2)
(3)
(4)
(5)
𝑢𝑟 : weight of the r-th output
𝑣𝑖 : weight of the i-th input
o : index of a DMU that is under study , 𝑜 ∈ {1,2, … , 𝑛} 𝑦𝑟𝑜: amount of the r-th output
𝑥𝑖𝑜 : amount of the i-th input
𝑥𝑖𝑗 : amount of the i-th input for the j-th unit
𝑦𝑟𝑗 : amount of the r-th output for the j-th unit
For each DMU model (1) should run to attain the efficiency.
sr r ry u Max
1
m
i i ix V 1
1
s
r
m
i ij i rj
ry vx j n
u
1 1
1 0 ,...,
0
r u
0
i
3. DUAL DEA MODEL
The following dual model is considered to present the improvement plan for increasing the efficiency scores of DMUs that are less than one and inefficient.
Min θ (6)
s.t.
θ𝑥. – Xλ + Pπ ≥ 0 (7)
Yλ + Qτ ≥ y. (8)
λ ≥ 0 (9)
π ≥ 0 (10)
τ ≥ 0 (11)
𝑠
− and𝑠
+ are slack variables of two constraints of theabove model.
𝑠−= θ𝑥
. – Xλ + Pπ (12)
𝑠+= −y. + Yλ + Qτ (13)
The dual DEA model is run for each DMU. If (𝑠−∗= 0, 𝑠+∗= 0, 𝜃∗= 1), the DMU will be efficient. If 𝜃∗≤ 1,
the DMU will be inefficient.
Two steps are suggested to present the improvement plan for each inefficient DMU:
Step 1: First, the dual DEA model should be solved. Step 2: In the second step, the following model is suggested. The objective function of this model is the summation of slack variables of two constraints of the dual DEA model.
𝜃
∗ in the following model is the optimal objective function of the dual DEA model that is obtained in the first step.Min 𝑠−∗+ 𝑠+∗ (14)
s.t.
𝑠−∗= 𝜃∗𝑥
.– Xλ + Pπ (15)
𝑠+∗= −y. + Yλ + Qτ (16)
λ ≥ 0 (17)
π ≥ 0 (18)
τ ≥ 0 (19)
𝑠−∗≥ 0 (20)
𝑠+∗≥ 0 (21)
The above model is run for each inefficient DMU to reach the vector of slack variables. Improvement for input and output factors of inefficient DMUs are considered as follows:
Input factors' vector should be decreased by the value of
𝑠
− vector. Output factors' vector should be increased by the value of
𝑠
+ vector.Amin and Toloo [18] presented a polynomial algorithm to calculate the Epsilon for DEA models: (m = the numbers of inputs, s = the numbers of outputs, n = the numbers of DMUs)
M = 1/max {1𝑚𝑋𝑗∶ 𝑗 = 1, … , 𝑛} (22)
N = min {(1𝑚𝑋𝑗)/(1𝑠𝑌𝑗) ∶ 𝑗 = 1, …,n} (23)
Epsilon: min {M,MN} (24)
4.RESEARCH METHOD
The proposed approach of this paper in terms of quality and through the DEA includes the following five steps:
1. Establishing the relationship between quality measures and performance evaluation measures. 2. Collecting the data related to input and output
factors. For investigating the proposed approach, the data of 66 automotive vendors are considered. 3. Running the DEA (CCR) model to calculate the
efficiency scores of each DMU.
The efficiency scores of each vendor based on the DEA (CCR) are calculated using Lingo software 4. Presenting the improvement plan to increase the
efficiency scores of inefficient DMUs. To present the improvement plan, the dual DEA model is considered.
5. Analyzing the results of improvement.
5. CASE STUDY
In this study, some performance evaluation measures of a Turkish automotive company that manufactures both passenger car and light commercial vehicle have been collected below [19]:
Input Factors:
X1: number of branch offices.
X2: total number of exhibiting vehicles (including branch offices)
X3: total number of test vehicles
X4: total number of selling advisers
X5: total number of employees of vendors
Figure 1. Proposed approach
X7: number of advertisement broadcasting by multi-media
Output Factors:
Y1: number of the sold vehicles
Y2: average satisfaction value for all vendors determined by the whole customers
Y3: service endorsement of vendors after selling (in Turkish Lira (TL))
Y4: credit endorsement loaned by means of financial founding for customers (in TL)
Y5: vendor's selling endorsement on the spare parts (in TL)
The relationship between performance evaluation measures and quality measures is then investigated. Table 1 indicates the classification the input and output factors of DEA model according to their relationship with the requirements of ISO 9001:2015 and quality management principles.
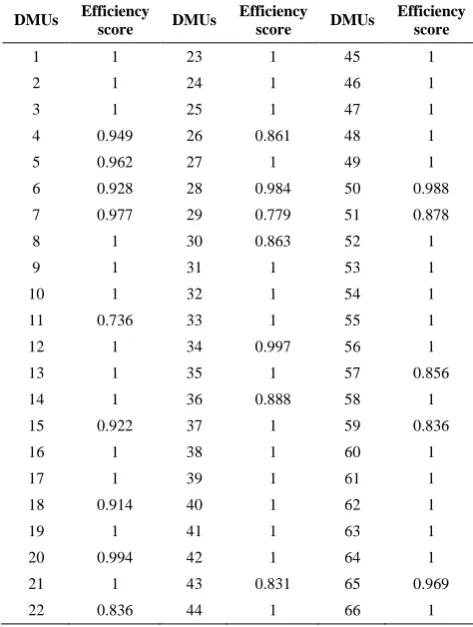
In this section by using the DEA and data of 66 automotive vendors (DMUs) according to Toloo and Ertay [19], the efficiency scores of each vendor based on the DEA (CCR) are calculated. As can be seen in Table 2, the efficiency scores of 45 vendors are 1. It means that basic DEA model cannot prioritize DMUs correctly. So, in this paper, a modified version of the DEA (i.e., augmented DEA) is used to increase the discrimination power of the DEA to prioritize DMUs correctly. According to this method, two virtual DMUs which are supposed are added.
TABLE 1. Relationship between inputs and outputs factors and the requirements of ISO 9001:2015 and quality management principles
Quality management
principles
ISO 9001:2015 Factors
_____________ Clause 7.1.3 of ISO 9001:2015.
Infrastructure
X1
_____________ Clause 7.1.3. Infrastructure
X2
_____________ Clause 7.1. Resources (Physical
resources)
X3
engagement of people
Clause 7.1.2. People
X4
engagement of people
Clause 7.1.2. People
X5
_____________ Clause 7.1.3. Infrastructure
X6
_____________ _____________
X7
_____________ Clause 8.5.1. Control of
production and service provision
Y1
customer focus Clause 9.1.2. Customer
satisfaction
Y2
_____________ Clause 8.5.5. Post-delivery
activities
Y3
_____________ Clause 8.5. Production and
service provision
Y4
_____________ Clause 8.5.5. Post-delivery
activities
Y5
TABLE 2. Efficiency scores of 66 automotive vendors based on the DEA model (CCR)
DMUs Efficiency
score DMUs
Efficiency
score DMUs
Efficiency score
1 1 23 1 45 1
2 1 24 1 46 1
3 1 25 1 47 1
4 0.949 26 0.861 48 1 5 0.962 27 1 49 1 6 0.928 28 0.984 50 0.988 7 0.977 29 0.779 51 0.878 8 1 30 0.863 52 1
9 1 31 1 53 1
10 1 32 1 54 1
11 0.736 33 1 55 1 12 1 34 0.997 56 1 13 1 35 1 57 0.856 14 1 36 0.888 58 1 15 0.922 37 1 59 0.836
16 1 38 1 60 1
17 1 39 1 61 1
18 0.914 40 1 62 1
19 1 41 1 63 1
They have the best and the worst efficiency scores. DMU67 with the maximum output and the minimum input in each column has the highest level of performance. It means that maximum outputs are achieved from minimum inputs. DMU68 with the maximum input and the minimum output in each column has the lowest level of the performance.
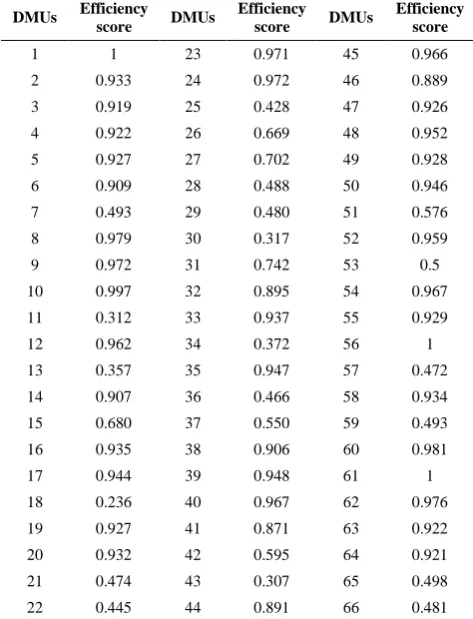
Now again according to the data of 66 vendors and two virtual DMUs, the efficiency scores of each vendor based on the DEA model (CCR) are calculated by using Lingo software.
According to Table 3, the efficiency scores of D01, D56 and D61 are equal to one. Therefore, they are efficient in utilizing inputs to achieve outputs but the efficiency scores of the rest of the units are less than one. It means that they are inefficient in utilizing inputs to achieve outputs. So for increasing their efficiency scores, an improvement plan is presented. For this purpose two steps of dual model are applied to improve the inefficient units.
Tables 4 and 5 indicate the suggested improvements for output and input factors of some automotive vendors that need more improvement.The corresponding improved cells are shaded with gray color and include decreasing input factors (represented by a negative sign) and increasing of output factors (positive sign).
TABLE 3. Total efficiency scores based on the DEA
DMUs Efficiency score DMUs Efficiency score DMUs Efficiency score
1 1 23 0.971 45 0.966 2 0.933 24 0.972 46 0.889 3 0.919 25 0.428 47 0.926 4 0.922 26 0.669 48 0.952 5 0.927 27 0.702 49 0.928 6 0.909 28 0.488 50 0.946 7 0.493 29 0.480 51 0.576 8 0.979 30 0.317 52 0.959 9 0.972 31 0.742 53 0.5 10 0.997 32 0.895 54 0.967 11 0.312 33 0.937 55 0.929 12 0.962 34 0.372 56 1 13 0.357 35 0.947 57 0.472 14 0.907 36 0.466 58 0.934 15 0.680 37 0.550 59 0.493 16 0.935 38 0.906 60 0.981 17 0.944 39 0.948 61 1 18 0.236 40 0.967 62 0.976 19 0.927 41 0.871 63 0.922 20 0.932 42 0.595 64 0.921 21 0.474 43 0.307 65 0.498 22 0.445 44 0.891 66 0.481
TABLE 4. Suggested improvements for the input factors of
some automotive vendors
X7 X6 X5 X4 X3 X2 X1 D M U s -32.77 -17.22 -27.22 -4.44 -15 -3.89 0 4 0 -71 0 -18 0 0 -3 18 -261 -79 -26.98 0 -7 -10.52 0 19 0 -23.33 0 0 -0.91 -30 0 20 0 0 0 -9 -6 -11 -1 29 -175 0 -106 0 -24 -22 0 30 -44.45 0 -21.89 -1.56 -7 -27 -5 34 0 -26 0 0 0 0 -1 42 0 -27.79 -62 -5.28 0 -7.25 0 48 -11.41 -67 -0.69 -19 -3.93 -21 0 52 0 -57 -29.87 -19 0 0 0 55
TABLE 5. Suggested improvements for the output factors of
some automotive vendors
Y3 Y2 Y1 DMUs +2199649 . +22.145 +302.35 4 +95722020 +3999.11 +39521.10 18 +6134230 +75.31 +3671.36 19 +6533307 +124.34 +2641.09 20 +631973100 +68790.84 +534132.1 29 +7780618000 +365916.0 +2959872 30 +23166530 +230.02 +17244.57 34 +2025846000 +45074.25 +601466.1 42 +15846090 +224.79 +8197.67 48 +20541300 +397.09 +12913.85 52 +35021860 +578.4 +16359.41 55
Suggested improvements shown in Tables 4 and 5 with gray color are categorized in two groups:
decreasing input factors,
increasing output factors.
endorsement of vendors after selling, credit endorsement loaned by means of financial founding for customers and vendor's selling endorsement on the spare parts, should be increased by the value of
𝑠
+.6. DISCUSSION
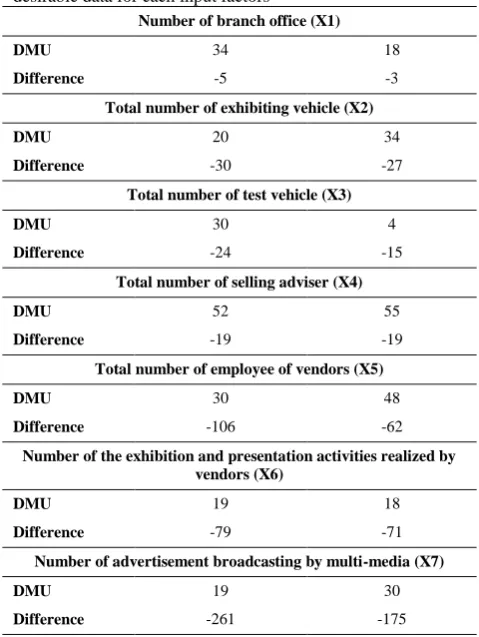
In this section, the performance improvement of automotive vendors are discussed. For this purpose, the difference between the improved data (desirable data) and available data are calculated separately for each input and output factors. Then, the obtained results for each factor are ranked from minimum to maximum. Next for each factor is analyzed that DMUs should focus more in order to reach desirable status and how much the scores of each inefficient DMU for each factors should be increased to reach efficient scores.
In order to improve the efficiency of inefficient DMUs, input factors should be decreased by the value of
𝑠
−. Therefore, as shown in Table 6, DMUs which should focus more on the X1 (number of branch offices), first is DMU 34, which should be decreased by the value of five branches in order to reach the improved data.DMU, which should focus more on the X2 (total number of exhibiting vehicle), first is DMU 20, which should be decreased by the value of 30 exhibiting vehicles in order to reach improved data.
DMU, which should focus more on the X3 (total number of test vehicle), first is DMU 30, which should be decreased by the value of 24 test vehicles, in order to reach the improved data.
DMU, which should focus more on the X4 (total number of selling adviser), first is DMU 52, which should be decreased by the value of 19 selling advisers in order to reach the improved data.
DMUs which should focus more on the X5 (total number of employee of vendors), first is DMU 30, which should be decreased by the value of 106 employee of vendors, in order to reach improved data.
DMUs which should focus more on the X6 (number of the exhibition and presentation activities realized by vendors), first is DMU 19, which should be decreased by the value of 79, in order to reach improved data.
DMUs which should focus more on the X7 (number of advertisement broadcasting by multi-media), first is DMU 19, which should be decreased by the value of 261 in order to reach the improved data.
In order to improve the efficiency of inefficient DMUs, output factors should be increased by the value of
𝑠
+. As shown in Table 7, DMU, which should focus more on the Y1 (number of the sold vehicles), first is DMU 30, which should obtain 2959872 score to reach the desirable data.TABLE 6. Ranking the difference between available and
desirable data for each input factors
Number of branch office (X1)
18 34
DMU
-3 -5
Difference
Total number of exhibiting vehicle (X2)
34 20
DMU
-27 -30
Difference
Total number of test vehicle (X3)
4 30
DMU
-15 -24
Difference
Total number of selling adviser (X4)
55 52
DMU
-19 -19
Difference
Total number of employee of vendors (X5)
48 30
DMU
-62 -106
Difference
Number of the exhibition and presentation activities realized by vendors (X6)
18 19
DMU
-71 -79
Difference
Number of advertisement broadcasting by multi-media (X7)
30 19
DMU
-175 -261
Difference
TABLE 7. Ranking the difference between available and
desirable data for each output factors
Number of the sold vehicles (Y1)
30 42
DMU
2959872 601466
Difference
Average satisfaction value for all vendors determined by the whole customers (Y2)
30 29
DMU
365916 68790.84
Difference
Service endorsement of vendors after selling (in Turkish Lira) (Y3)
30 42
DMU
7780618000 2025846000
Difference
Credit endorsement loaned by means of financial founding for customers (in TL) (Y4)
30 42
DMU
7418704000 1730413000
Difference
Vendor's selling endorsement on the spare parts (in TL) (Y5)
30 42
DMU
5544085000 3030531000
DMU, which should focus more on the Y2 (average satisfaction value for all vendors determined by the whole customers), first is DMU 30, which should obtain 365916 score to reach the desirable data.
DMU, which should focus more on the Y3 (Service endorsement of vendors after selling (in Turkish Lira)), first is DMU 30, which should obtain 7780618000 score to reach the desirable data.
DMU, which should focus more on the Y4 (credit endorsement loaned by means of financial founding for customers (in TL)), first is DMU 30, which should obtain 7418704000 score to reach the desirable data.
DMU, which should focus more on the Y5 (vendor's selling endorsement on the spare parts (in TL)), first is DMU 30, which should obtain 5544085000 score to reach the desirable data.
7. CONCLUSION
In this study, DEA technique was used to evaluate the efficiency scores of 66 automotive vendors. Then by using the dual DEA model, improvement plans were suggested to increase the efficiency scores of inefficient vendors. The results showed that which DMUs should focus more for each input and output factor in order to reach the desirable data. For example, for input factors, the unit which should focus more on the XI was DMU 34; the unit which should focus more on the X2 was DMU 20, the unit which should focus more on the X3 was DMU 30, the unit which should focus more on the X4 was DMU 52, the unit which should focus more on the X5 was DMU 30, the unit which should focus more on the X6 was DMU 19 and the unit which should focus more on the X7 was DMU 19. Also for all output factors the unit which should focus more, was DMU 30. Main contributions of this research are as follows:
To present an improvement plan to increase the level of measures related to quality and changing the organizations to efficient DMUs.
To identify strength and weakness points in the performance of automotive vendors in terms of quality.
To analyze the relationships between the performance evaluation measures with the requirements of ISO 9001:2015 and quality management principles
The developed framework in this study provides an opportunity for organizations and the consulting companies to have a comprehensive evaluation based on the combination of quality management standards and DEA technique. In addition results of this study can assist all ISO 9001 certified company managers and the consulting companies that service in the field of Organizational quality for measuring and improving their QMS.
8. REFERENCES
1. Yadav, O.P. and Goel, P.S., "Customer satisfaction driven quality improvement target planning for product development in automotive industry", International Journal of Production Economics, Vol. 113, No. 2, (2008), 997-1011.
2. Ibusuki, U. and Kaminski, P.C., "Product development process with focus on value engineering and target-costing: A case study in an automotive company", International Journal of Production Economics, Vol. 105, No. 2, (2007), 459-474. 3. Heuvel, J., Does, R. and Bisgaard, S., "Dutch hospital
implements six sigma", in Six Sigma Forum Magazine. Vol. 4, No. Issue, (2005), 11-14.
4. Thompson, R.G., Dharmapala, P., Rothenberg, L.J. and Thrall, R.M., "Dea/ar efficiency and profitability of 14 major oil companies in us exploration and production", Computers & Operations Research, Vol. 23, No. 4, (1996), 357-373. 5. Nepal, B., Yadav, O.P. and Murat, A., "A fuzzy-ahp approach to
prioritization of cs attributes in target planning for automotive product development", Expert Systems with Applications, Vol. 37, No. 10, (2010), 6775-6786.
6. Aggogeri, F. and Gentili, E., "Six sigma methodology: An effective tool for quality management", International Journal of Manufacturing Technology and Management, Vol. 14, No. 3-4, (2008), 289-298.
7. Rezaee, M.J. and Ghanbarpour, T., "Energy resources consumption performance in iranian manufacturing industries by using cost/revenue efficiency model", International Journal of Engineering- TRANSACTIONS C: Aspects, Vol. 29, No. 9, (2016), 1282-1291.
8. Torabi, S. and Shokr, I., "A common weight data envelopment analysis approach for material selection", International Journal of Engineering-Transactions C: Aspects, Vol. 28, No. 6, (2015), 913-921.
9. Sadjadi, S. and Bayati, M.F., "Two-tier supplier base efficiency evaluation via network dea: A game theory approach",
International Journal of Engineering-Transactions A: Basics, Vol. 29, No. 7, (2016), 931-938.
10. Wu, J., Chu, J., Sun, J. and Zhu, Q., "Dea cross-efficiency evaluation based on pareto improvement", European Journal of Operational Research, Vol. 248, No. 2, (2016), 571-579. 11. Lijó, L., Lorenzo-Toja, Y., González-García, S., Bacenetti, J.,
Negri, M. and Moreira, M.T., "Eco-efficiency assessment of farm-scaled biogas plants", Bioresource Technology, Vol. 237, No., (2017), 146-155.
12. Kourtit, K., Suzuki, S. and Nijkamp, P., "Tracing high-sustainability performers among world cities-design and application of a multi-temporal data envelopment analysis",
Habitat International, Vol. 68, No., (2017), 43-54.
13. Yousefi, S., Soltani, R., Saen, R.F. and Pishvaee, M.S., "A robust fuzzy possibilistic programming for a new network gp-dea model to evaluate sustainable supply chains", Journal of Cleaner Production, Vol. 166, No., (2017), 537-549.
14. He, F., Xu, X., Chen, R. and Zhu, L., "Interval efficiency improvement in dea by using ideal points", Measurement, Vol. 87, No., (2016), 138-145.
15. Motlagh, S.M.H., Behzadian, M., Ignatius, J., Goh, M., Sepehri, M.M. and Hua, T.K., "Fuzzy promethee gdss for technical requirements ranking in hoq", The International Journal of Advanced Manufacturing Technology, Vol. 76, No. 9-12, (2015), 1993-2002.
perspective", International Journal of Production Economics, Vol. 184, No., (2017), 107-121.
17. Nematollahi, M., Hosseini-Motlagh, S.-M. and Heydari, J., "Economic and social collaborative decision-making on visit interval and service level in a two-echelon pharmaceutical supply chain", Journal of Cleaner Production, Vol. 142, No., (2017), 3956-3969.
18. Amin, G.R. and Toloo, M., "A polynomial-time algorithm for finding ε in dea models", Computers & operations research, Vol. 31, No. 5, (2004), 803-805.
19. Toloo, M. and Ertay, T., "The most cost efficient automotive vendor with price uncertainty: A new dea approach",
Measurement, Vol. 52, No., (2014), 135-144.
Automotive Vendor's Performance Evaluation and Improvement Plan Presentation by
Using a Data Envelopment Analysis
M. Sadat Rezaee, A. Haeri, S. Noori
School of Industrial Engineering, Iran University of Science & Technology, Tehran, Iran
P A P E R I N F O
Paper history:
Received 09 July 2017
Received in revised form 10 September 2017 Accepted 12 October 2017
Keywords:
Data Envelopment Analysis Efficiency Score Decision Making Units The Dual DEA Model Improvement Plan Automotive Industry
ديكچ ه
هب ناگدنشورف درکلمع یبایزرا متسیس کی نتشاد نیاربانب دنراد دوخ تکرش تیقفوم رد یدیلک شقن ناگدنشورف هک اجنآ زا
هزوح ،توق طاقن تخانش روظنم زا .دشابیم یرورض یتکرش ره رد یروآدوس داجیا و دوبهب دنمزاین یاه
ادتبا هلاقم نیا رد ورنیا
هداد یششوپ لیلحت کینکت اه
(
DEA
) میمصت یاهدحاو درکلمع یبایزرا یارب بسانم شور کی هک هدنریگ
( DMUs )
،تسا
دریگیم رارق یسررب دروم ییاراک تازایتما سپس و
66 لدم ساسا رب ،وردوخ هدنشورف
DEA
(
CCR
رازفا مرن رد )
Lingo
هبساحم وت اب رخآ رد .دوشیم ناگود لدم طسوت دوبهب همانرب ،هدنشورف ره یارب هدش بسک ییاراک تازایتما هب هج
DEA
هب
یم هئارا اراکان ناگدنشورف ییاراک تازایتما شیازفا روظنم یم صخشم نینچمه و دوش
روظنم هب اراکان هدنشورف ره هک دوش
.دنک زکرمت اهرایعم زا کی مادک یور رتشیب دیاب ییاراکان دوبهب