Effect of Remote Back-Up Protection System Failure on the
Optimum Routine Test Time Interval of Power System
Protection
Y. Damchi* and J. Sadeh* (C.A.)
Abstract: Appropriate operation of protection system is one of the effective factors to have a desirable reliability in power systems, which vitally needs routine test of protection system. Precise determination of Optimum Routine Test Time Interval (ORTTI) plays a vital role in predicting the maintenance costs of protection system. In the most previous studies, ORTTI has been determined while remote back-up protection system was considered fully reliable. This assumption is not exactly correct since remote back-up protection system may operate incorrectly or fail to operate, the same as the primary protection system. Therefore, in order to determine the ORTTI, an extended Markov model is proposed in this paper considering failure probability for remote back-up protection system. In the proposed Markov model of the protection systems, monitoring facility is taken into account. Moreover, it is assumed that the primary and back-up protection systems are maintained simultaneously. Results show that the effect of remote back-up protection system failures on the reliability indices and optimum routine test intervals of protection system is considerable.
Keywords: Markov Model, Monitoring, Primary and Remote Back-up Protection Systems, Reliability, Routine Test Time Interval.
1 Introduction1
Nowadays, with the power systems expansion and the growing demand for electrical energy, power system protection has vital role in maintaining high degree service reliability to consumers, since power system failures have undesirable effects on social welfare and the economy of each country [1]. One of the main causes of cascading outages in power system is protection system failure [2, 3]. In a study performed by North American Electrical Reliability Council (NERC), it has been shown that protection systems are involved in about 75% of major disturbances. The New York City blackout on July 1977 and Southern Idaho system instability on December 1995 are examples for this claim in which the main was the inappropriate operation of protection systems [4]. Appropriate operation of protection system can be effective in decreasing such events. Therefore, performing the routine test is necessary to maximize the availability and minimize the
Iranian Journal of Electrical & Electronic Engineering, 2013. Paper first received 17 Apr. 2013 and in revised form 20 Oct. 2013. * The Authors are with the Department of Electrical Engineering, Faculty of Engineering, Ferdowsi University of Mashhad, Mashhad, Iran.
E-mails: [email protected] and [email protected].
risk of mal-operation of protection system [5]. Modern digital protection systems are usually equipped with self-checking and monitoring facilities to detect protection system failures; while in electromagnetic and static protection systems, routine test is the only way to detect such failures. Self-checking and monitoring facilities can considerably improve the reliability of protection systems and hence, the routine test time interval can be increased [6, 7].
Different papers have focused on determining the ORTTI of protection system. In [8], ORTTI of protection system has been determined without considering self-checking and monitoring facilities, when back-up protection system was considered perfectly reliable. As an improvement in [5], the self-checking facility has been considered to determine the optimum routine test interval considering perfect operation for back-up protection system. Furthermore, the effect of digital and old protection systems on ORTTI has been analyzed. Reliability analysis of transmission line protection system and determination of ORTTI have been done in [9], considering redundancy in protection system while failure probability for back-up protection system was not considered. Variations of maintenance cost in respect to
maintenance frequency have been analyzed in [10] considering the effect of primary and back-up protection systems. In [11], ORTTI has been determined for several configurations of over-current relays, while just self-checking facility was taken into account in protection system. It is assumed that back-up protection has perfect operation. Estimation of the ORTTI and comparing abnormal unavailability index for several pilot protection configurations have been performed in [12] using Markov model and event tree methods. It was supposed that there is no failure probability for back-up protection, and protection systems are only equipped with self-checking facility. Markov model has been proposed by [6] for reliability analysis of the protection system of transmission line considering self-checking and monitoring facilities while the back-up protection was assumed to be perfectly reliable. The optimum self-checking test time interval has been determined at specific routine test time interval for different self-checking effectiveness. In [7], the ORTTI and optimum self-checking interval has been estimated using Markov model for protection system of a power transformer. In this paper, protection systems are equipped with both self-checking and monitoring facilities, while back-up protection has been assumed to have appropriate operation to isolate the component from the faulted area when primary protection is failed. An index has been defined in [1], namely the annual average economic losses, to determine the ORTTI in protection system using semi-Markov process. Reliability analysis is also performed without considering failure probability for back-up protection system and it is assumed that there is only self-checking facility in protection system. In [13], a Markov model has been proposed to estimate ORTTI considering monitoring facility and failure probability for back-up protection system. It is supposed that routine test for primary and back-up protection systems has been performed sequential. In [14], ORTTI for protective relay have been determined by considering the cost of routine test, losses due to incorrect operation and mal- operation of protective relay.
Precise determination of routine test time interval has a significant role on predicting maintenance cost of protection system and decreasing of the damages which can be caused by protection system failure. Protection system reliability reduces if this test performs sooner or later than the optimum routine test time interval. Furthermore, maintenance cost increases if routine test performs sooner than the ORTTI. On the other hand, maintenance cost decreases if routine test performs later than the optimum time of this test. However, protection system reliability decreases in this condition that can leads to inappropriate operation of protection system. This operation can be imposed large costs such as load curtailment cost, repair cost and etc to electrical companies. Generally, this cost is significantly more than maintenance cost. In the previous studies it was assumed that remote backup protection is fully reliable.
In real power system, this assumption is not exactly correct since remote backup protection system may mal-operate or fail to mal-operate, just the same as the primary protection system. Therefore, in this paper an extended Markov model is proposed to determine ORTTI of protection system considering failure probability for remote back-up protection system. In the proposed method, monitoring facility for primary and remote back-up protection systems is taken into account. Furthermore, it is assumed that routine test for both primary and remote back-up protection systems can be performed simultaneously. In this study, the effect of monitoring test effectiveness and failure rate of remote back-up protection system on the reliability indices and ORTTI are investigated. The presented results show that the effect of remote back-up protection system failures on the reliability indices and ORTTI is significant.
2 Proposed Method
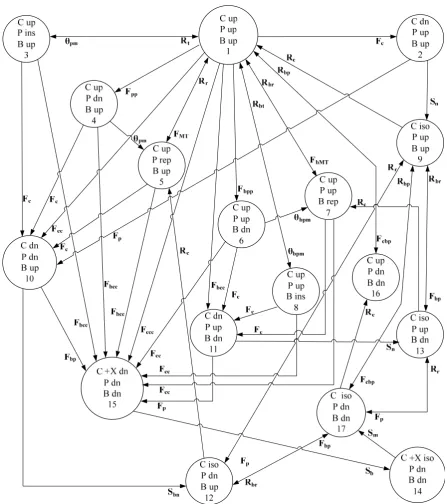
Several methods have been developed for reliability analysis such as event tree, fault tree and Markov model. For example, in [5-14] and [15] Markov models have been proposed for reliability analysis of power system protection and power transformer, respectively. In this paper, Markov model is used to perform reliability analysis. Therefore, a Markov model for transmission line protection system is proposed to determine the ORTTI considering failure probability for remote back-up protection system. The proposed Markov model consists of 17 states which, is shown in Fig. 1. The following assumptions are taken into account in the proposed Markov model:
• Both primary and remote back-up protection systems are taken out of service to be inspected.
• An inspection or fault must occur in order to detect a protection system failure.
• The time required to test a protection system is equal to the time required to repair or replace a failed protection system.
• Inspection of protection system always detects failures and does not cause failures.
In Fig. 1, C, X, P and B are protected component, additional component connected to C, primary protection system and remote back-up protection system, respectively. Furthermore, in this figure, up, dn, iso, ins and rep are energized component, failed component, isolated component, component under inspection and component under repair, respectively.
The states of the proposed Markov model are explained as follows:
In state 1, protected component and protection systems are in normal condition. This means that protected component is energized and protection systems operate appropriately if they are called upon. When, a fault occurs on the line, the model transfers
Fig. 1Proposed extended Markov model of protected component and protection system.
from state 1 to state 2. In this state, protected component is isolated by the operation of the primary protection system and the model transfers from state 2 to state 9. In state 9, faulted line is repaired and reenergized, and then model comes back to state 1. Primary and remote back-up protection systems are under routine test in states 3 and 8, respectively. The model goes from state 1 to state 5 when primary protection system failure is detected by monitoring test. If remote back-up protection system failure is detected by monitoring test, the model goes
from state 1 to state 7. When, protection system failures are not detected by monitoring test, the model transfers from state 1 to states 4 and 6 for primary and remote back-up protection systems, respectively. If a simultaneous failure occurs for the primary protection system and protected component, the system enters to state 10 directly from state 1. By proper operation of remote back-up protection system, state 10 transfers to state 12. The model goes to state 13 by the appropriate operation of primary protection system through state 11
on conditions that remote back-up protection system and protected component are failed. If remote back-up protection system in state 10 and primary protection system in state 11 are failed, the model transfers to state 15. The proposed model moves into state 15 through state 1 if the protected component and the primary and remote back-up protection system failures occur simultaneously. In state 15, protected and additional components are isolated by second backup protection system and model enters state 14. Then the model transfers to state 17 by manual isolation of additional component. The model moves into state 16 from state 17 when protected component is repaired. Then by repairing primary and remote back-up protection systems, the model comes back to state 1.
The most parameters which are used in the proposed Markov model in Fig. 1 are defined in “Nomenclature” part of the paper. However, FMT, FbMT, Fpp and Fbpp are
related to the defined parameters as follows:
) MT 1 ( F F MT F F ) MT 1 ( F F MT F F b bp bpp b bp bMT p p pp p p MT − × = × = − × = × = (1)
In this study, in order to perform the reliability analysis and to determine ORTTI, a five-state reliability model is considered for protection system that is shown in Fig. 2 [6].
The states shown in Fig. 2 are explained as follows: • State I: Protection systems are ready and no fault is
occurred. Probability of this state is defined as availability of protection system.
• State II: Fault is occurred and protection systems operate successfully to clear it. Probability of this state is demonstrated as dependability of protection system.
• State III: No fault is occurred but protection systems are not ready to operate. Probability of this state is illustrated as unavailability of protection system. • State IV: Protection systems are not ready to operate
while fault is occurred. Probability of this state is defined as abnormal unavailability of protection system.
• State V: Protection systems operate when not required. High probability of this state shows that protection system has low security.
ORTTI is determined based on maximizing each of desirable reliability indices (availability and dependability indices) and also minimizing each of undesirable reliability indices (unavailability, abnormal unavailability and operation when not required indices) are minimum.
To calculate the reliability indices, the state probabilities in Markov model in Fig. 1 should be calculated. State probabilities (pi) are calculated using
Eq. (3) where S is transitional matrix that is defined by
O per ati on W hen No t Required
Fig. 2 Reliability model for protection systems [6].
Eq. (2) and p is the vector of the state probabilities [16]. In Eq. (2), aij is transition rate from state i to state j.
Eq. (2) shows that the summation of the elements in each row of the transitional matrix must be equal to one.
⎪⎩ ⎪ ⎨ ⎧ − = ≠ = =
∑
≠i j , j ij ii ij ij a 1 S i j a S S (2) p=Spp= [p1, p2, p3, ………, p15, p16, p17] (3) Equation system in Eq. (3) is linearly dependent; therefore, an additional equation is required to calculate the state probabilities. This equation is obtained based on this fact that the summation of the state probabilities must be equal to one, i.e.:
1 p 17 1 i i =
∑
= (4)
According to Markov model shown in Fig. 1, the previous defined reliability indices are calculated using Eq. (5): 17 15 14 16 8 7 6 5 4 3 13 12 11 10 9 2 1 p ) V ( P p p ) IV ( P p p p p p p p ) III ( P p p p p p p ) II ( P p ) I ( P = + = + + + + + + = + + + + + = = (5)
As mentioned above, ORTTI is occurred at the point in which each of the desirable reliability indices (P(I) andP(II)) are maximized or each of undesirable reliability indices (P(III), P(IV) and P(V)) are minimized. Probability of proposed Markov states depends on the transition rates of primary and remote backup protections. Therefore, considering failure probability for remote backup protection affects these probabilities and results in changing ORTTI, maximum of desirable reliability indices and minimum of undesirable reliability indices. In the proposed method, at first, desirable and undesirable reliability indices are calculated using Eq. (5) as a function of RTTI based on the proposed Markov model. Then, the enumeration
method [17] is used to find ORTTI. In this method, reliability indices are calculated for the intervals of ∆RTTI, which is an arbitrary numbers (in this paper ∆RTTI has been considered 1(hour)) and then the maximum of desirable reliability indices values or the minimum of undesirable reliability indices is chosen as ORTTI.
3 Simulation Results
In order to analyze the reliability of component/protection systems and determining the ORTTI, various cases are considered and these studies are performed using proposed extended Markov model in the previous section. Most of transition rates which are used in the simulations are taken from [5]. These data can be found in Appendix. It is worth noting that some required transition rates are not found in [5], so we select these transition rates as arbitrary respect to transition rate values in [5]. These transition rates are Rbp, Fbcc, Fbp, Fccc and Sb.
3.1 Basic Situation
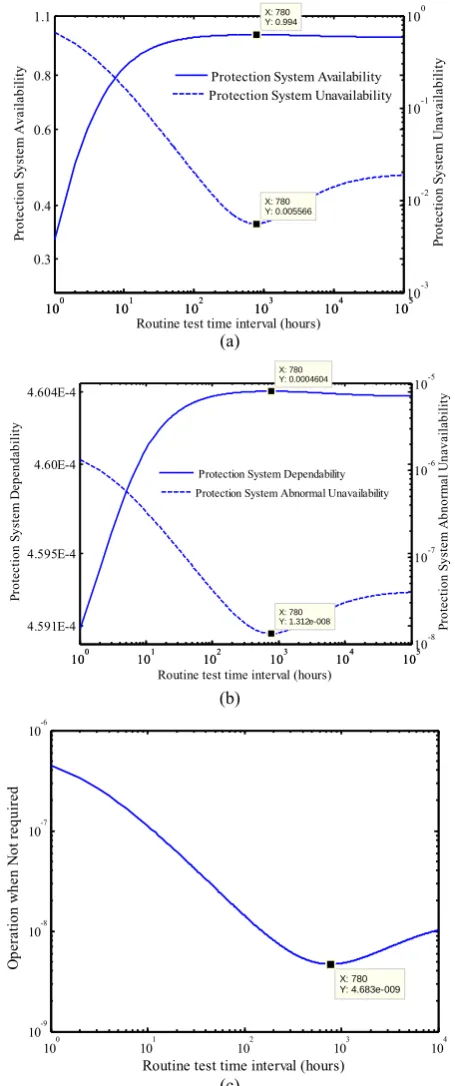
In this study, one case is defined as basic situation for comparing the influence of remote back-up protection system on ORTTI and reliability indices. In this situation, it is assumed that there is no monitoring facility in primary and remote back-up protection systems. Moreover, MTBF for primary and remote back-up protection systems are assumed to be 50 (years) and the number of faults on the protected component has been considered to be equal 2 (faults per year). Simulation results are shown in Fig. 3.
Regarding to Fig. 3, it can be seen that the ORTTI in protection system is equal to 780 (hours) where availability and dependability indices are in their maximum values that are equal to 0.9939739 and 4.6040423×10⁻⁴, respectively. Furthermore, the
unavailability, abnormal unavailability and operation when not required probability indices are in their minimum values in ORTTI (780 hours) that are equal to 0.0055657, 1.3115819×10⁻⁸ and 4.6829101×10⁻⁹,
respectively. This figure shows that in long routine test time interval, availability and dependability indices are greater than their values in short routine test time interval while unavailability, abnormal unavailability and operation when not required probability indices are less than their values in short routine test time interval. The reason for these results is that protection system is out of service more frequently when routine test time interval is short.
3.2 Effect of Considering Monitoring Facility for Remote Back-Up Protection System on the ORTTI To investigate the effect of remote back-up protection system monitoring facility effectiveness on the ORTTI, the protection system reliability indices are determined for different values of monitoring test effectiveness and other parameters are assumed to be similar to the basic
situation ones. In this investigation, values 0, 90%, 95% and 100% are assumed for primary protection system monitoring test effectiveness while remote back-up protection system monitoring test effectiveness changes from 0 to 100% for each primary protection system monitoring test effectiveness. Results of simulations are shown in Fig. 4 and Table 1.
100 101 102 103 104 105
0.3 0.4 0.6 0.8
1.1 X: 780
Y: 0.994
Pr
ot
ect
ion S
ys
tem
A
vai
la
bi
li
ty
Routine test time interval (hours)
100 101 102 103 104 105
10-3 10-2 10-1 100
X: 780 Y: 0.005566
Pr
ot
ec
tio
n S
ys
te
m
U
na
va
ila
bility
Protection System Unavailability Protection System Availability
(a)
100 101 102 103 104 105
4.591E-4 4.595E-4 4.60E-4 4.604E-4
X: 780 Y: 0.0004604
Pr
ot
ec
tio
n S
ys
te
m
D
ep
en
da
bility
Routine test time interval (hours)
100 101 102 103 104 10105
-8 10-7 10-6 10-5
X: 780
Y: 1.312e-008 Prot
ec
ti
on S
ys
te
m
A
bnor
m
al
U
na
vai
la
bilit
y
Protection System Abnormal Unavailability Protection System Dependability
(b)
100 101 102 103 104
10-9 10-8 10-7 10-6
X: 780 Y: 4.683e-009
Routine test time interval (hours)
O
perat
io
n w
hen
N
ot req
uir
ed
(c)
Fig. 3 Protection/component system reliability indices for basic situation.
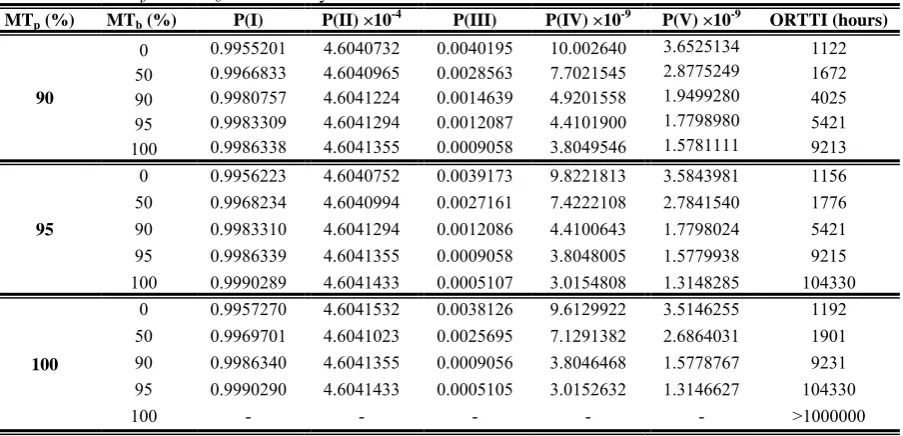
Table 1 Effect of MTp and MTb on reliability indices and ORTTI.
MTp (%) MTb (%) P(I) P(II) ×10-4 P(III) P(IV) ×10-9 P(V) ×10-9 ORTTI (hours)
90
0 0.9955201 4.6040732 0.0040195 10.002640 3.6525134 1122
50 0.9966833 4.6040965 0.0028563 7.7021545 2.8775249 1672
90 0.9980757 4.6041224 0.0014639 4.9201558 1.9499280 4025
95 0.9983309 4.6041294 0.0012087 4.4101900 1.7798980 5421
100 0.9986338 4.6041355 0.0009058 3.8049546 1.5781111 9213
95
0 0.9956223 4.6040752 0.0039173 9.8221813 3.5843981 1156
50 0.9968234 4.6040994 0.0027161 7.4222108 2.7841540 1776
90 0.9983310 4.6041294 0.0012086 4.4100643 1.7798024 5421
95 0.9986339 4.6041355 0.0009058 3.8048005 1.5779938 9215
100 0.9990289 4.6041433 0.0005107 3.0154808 1.3148285 104330
100
0 0.9957270 4.6041532 0.0038126 9.6129922 3.5146255 1192
50 0.9969701 4.6041023 0.0025695 7.1291382 2.6864031 1901
90 0.9986340 4.6041355 0.0009056 3.8046468 1.5778767 9231
95 0.9990290 4.6041433 0.0005105 3.0152632 1.3146627 104330
100 - - - >1000000
Based on the presented results in Fig. 4 and Table 1, it can be concluded that ORTTI of protection system and desirable reliability indices are increased by increasing remote back-up protection system monitoring test effectiveness in a certain value of primary protection system monitoring test effectiveness. Furthermore undesirable reliability indices are decreased in this condition. For example, if monitoring test effectiveness index of primary protection system is assumed to be 90%, increasing of remote back-up protection system monitoring test effectiveness from 0% to 100%, leads to an increase in the ORTTI from 1122 (hours) to 9213 (hours), i.e. 8.21 times. Furthermore, unavailability, abnormal unavailability and operation when not required probability indices decrease to 77.47%, 61.96% and 56.79%, respectively. Availability and dependability indices will also increase but this increase is not significant in comparison with the decrease of undesirable reliability indices.
Moreover, according to the presented results in Table 1, the increase of the ORTTI and the improvement of the reliability indices while remote back-up protection system monitoring test effectiveness varies from 0 to 100% are greater when the primary protection system monitoring test effectiveness is higher. For example, ORTTI increases 1.35 times if monitoring test effectiveness of primary protection system is considered to be equal 90% and monitoring test effectiveness of remote back-up protection system is increased from 90% to 95%. Another case is when monitoring test effectiveness of primary protection system is assumed to be 95% and monitoring test effectiveness of remote back-up protection system is varied from 90% to 95%, ORTTI is 1.7 times of the previous case.
Furthermore, if monitoring test effectiveness of primary and remote back-up protection systems is equal to 100%, ORTTI will be equal to infinite. This means that protection systems do not require routine test because all of protection system failures is detected by monitoring test.
3.3 Effect of Remote Back-Up Protection System Failure Rate on the ORTTI
To analyze the effect of remote back-up protection failure rate on the ORTTI, reliability analysis has been performed considering different MTBF values for remote back-up protection system. In this analysis,
102 103 104 105
0.90 0.92 0.94 0.96 0.98 1
Routine test time interval (hours)
P
ro
te
ctio
n S
ys
te
m
A
va
ila
bilit
y
MTp=0% MTb=0% MTp=90% MTb=0% MTp=90% MTb=50% MTp=90% MTb=90% MTp=100% MTb=100%
Fig. 4 Protection system availability with respect RTTI for
different values of monitoring test effectiveness.
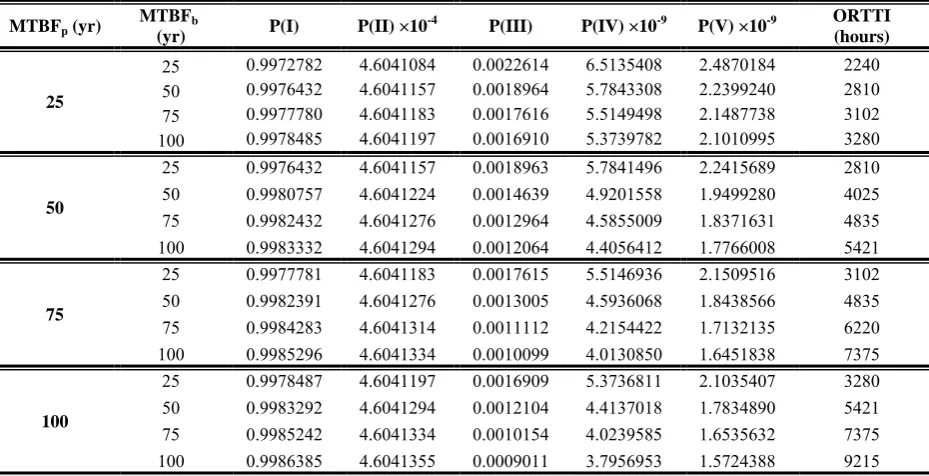
Table 2Effect of MTBFp and MTBFb on reliability indices and ORTTI.
MTBFp (yr)
MTBFb
(yr) P(I) P(II) ×10
-4
P(III) P(IV) ×10-9 P(V) ×10-9 ORTTI
(hours)
25
25 0.9972782 4.6041084 0.0022614 6.5135408 2.4870184 2240
50 0.9976432 4.6041157 0.0018964 5.7843308 2.2399240 2810
75 0.9977780 4.6041183 0.0017616 5.5149498 2.1487738 3102
100 0.9978485 4.6041197 0.0016910 5.3739782 2.1010995 3280
50
25 0.9976432 4.6041157 0.0018963 5.7841496 2.2415689 2810
50 0.9980757 4.6041224 0.0014639 4.9201558 1.9499280 4025
75 0.9982432 4.6041276 0.0012964 4.5855009 1.8371631 4835
100 0.9983332 4.6041294 0.0012064 4.4056412 1.7766008 5421
75
25 0.9977781 4.6041183 0.0017615 5.5146936 2.1509516 3102
50 0.9982391 4.6041276 0.0013005 4.5936068 1.8438566 4835
75 0.9984283 4.6041314 0.0011112 4.2154422 1.7132135 6220
100 0.9985296 4.6041334 0.0010099 4.0130850 1.6451838 7375
100
25 0.9978487 4.6041197 0.0016909 5.3736811 2.1035407 3280
50 0.9983292 4.6041294 0.0012104 4.4137018 1.7834890 5421
75 0.9985242 4.6041334 0.0010154 4.0239585 1.6535632 7375
100 0.9986385 4.6041355 0.0009011 3.7956953 1.5724388 9215
monitoring test effectiveness of primary and remote back-up protection system is assumed to be 90% and other parameters are similar to the basic situation ones. Primary protection system MTBF is also considered to be equal 25, 50, and 75 and 100 (years) and for each one, remote back-up protection system MTBF increase from 25 (years) to 100 (years) with step of 25 (years). The obtained results are presented in Table 2. Results in Fig. 5 illustrate variations of reliability indices with respect to routine test time interval and MTBF of 50 (years) for primary protection system and by changing MTBF of remote back-up protection.
The presented results in Fig. 5 and Table 2, indicate that ORTTI for protection system increases 1.46 times by increasing MTBF for remote back-up protection system from 25 (years) to 100 (years) when MTBF of 25 (years) is considered for primary protection system. In this situation, unavailability, abnormal unavailability and operation when not required probability indices decrease to 25.22%, 17.5% and 15.51%, respectively. It is noticeable that availability and dependability indices increase but this increase is not considerable in comparison with the decrease of undesirable reliability indices.
Regarding to Table 2, although the ORTTI becomes longer as remote back-up protection system MTBF increases, the increment of this time interval also depends on the primary protection system MTBF. For example, the ORTTI increases 2.38 times (i.e. from 3102 (hours) to 7375 (hours)) considering MTBF of 75 (years) for primary protection system while the increment of this interval time is equal to 2.81 times (i.e. from 3280 (hours) to 9215 (hours)) when MTBF of 100 (years) is assumed for primary protection system. In
both mentioned cases, remote back-up protection system MTBF increases from 25 to 100 (years).
According to Tables 1 and 2, it can be seen that sensitivity of ORTTI to variations of remote back-up protection system monitoring test effectiveness is more than its sensitivity to remote back-up protection system MTBF. Therefore, this result emphasizes that in order to increase the ORTTI, considering monitoring facility is more effective than improving MTBF in protection system.
Furthermore, the effect of monitoring test effectiveness of protection systems along with variation of remote back-up protection system failure rate is investigated on the ORTTI. Results are shown in Table 3.
100 101 102 103 104 105
10-3 10-2 10-1 100
Routine test time interval (hours)
P
ro
te
ctio
n S
ys
te
m
U
na
va
il
ab
ili
ty
MTBF for Back-up=25 (years) MTBF for Back-up=50 (years) MTBF for Back-up=75 (years) MTBF for Back-up=100 (years)
Fig. 5 Protection system unavailability with respect to RTTI
for different values of MTBFb.
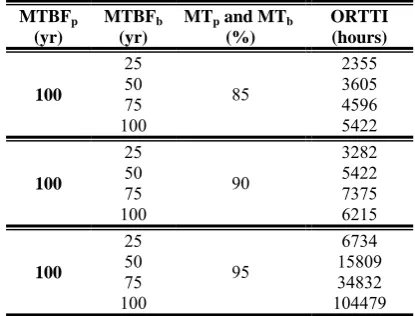
Table 3 Variation of ORTTI with respect to increase of
MTBFb and increase of MTp and MTb.
MTBFp
(yr)
MTBFb
(yr)
MTp and MTb
(%)
ORTTI (hours)
100
25
85
2355
50 3605
75 4596
100 5422
100
25
90
3282
50 5422
75 7375
100 6215
100
25
95
6734
50 15809
75 34832
100 104479
The presented results in Table 3 show that by increasing monitoring test effectivenesses of primary and remote back-up protection systems and MTBF of remote back-up protection system, ORTTI will increase. For example, by increasing of remote back-up protection system MTBF from 25 to 100 (years), ORTTI becomes 2.3 times in monitoring test effectiveness to be equal to 85% for protection systems, while the increment of this time becomes 15.51 times considering monitoring test effectiveness to be equal to 95%.
4 Conclusion
In this paper, an extended Markov model for protection system is proposed to determine reliability indices and ORTTI considering failure probability for remote back-up protection and monitoring facility. Moreover, variation of ORTTI in protection system is analyzed taking into account the different values for remote back-up protection system monitoring test effectiveness and the mean time between failures. Presented results indicate that ORTTI will increase by increasing monitoring test effectiveness and remote back-up protection system MTBF, while these parameters are assumed constant for primary protection system. As a result, by increasing remote back-up protection system monitoring test effectiveness from 0 to 100% and considering monitoring test effectiveness to be equal to 90% for primary protection system, the ORTTI increases 8.21 times. Furthermore, if remote back-up protection system MTBF changes from 25 to 100 (years) while primary protection system MTBF is assumed to be 50 (years), the ORTTI is increased 1.46 times in monitoring test effectiveness to be equal to 90% for primary and remote back-up protection systems. Based on the obtained results, it is strongly recommended to consider the remote back-up protection system failure probability in determining the ORTTI in protection system.
Nomenclature
Fc Protected component failure rate;
Fp andFbp Primary and remote back-up protection
system failure rates respectively, (reciprocal of protection system Mean Time Between Failures (MTBF));
FMT and FbMT Primary and remote back-up protection system failure rates, which are detected by monitoring test, respectively;
Fpp and Fbpp Primary and remote back-up protection system failure rates, which are not detected by monitoring test, respectively;
Fcc Common-causes failure rate of protected
component and primary protection system;
Fbc Common-causes failure rate of protected
component and remote back-up protection system;
Fccc Common-causes failure rate of protected
component, primary and remote back-up protection systems;
MTp and MTb Monitoring test effectiveness index (MT) of primary and remote back-up protection systems, respectively;
Rc Protected component repair rate;
Rt and Rbt Primary and remote back-up system inspection rates, respectively;
Rr and Rbr Primary and remote back-up protection system repair rates, respectively;
Rbp Primary and remote back-up protection
systems repair rate simultaneously;
Sn and Sbn Normal tripping operations of primary and remote back-up protection systems, respectively, (reciprocal of fault clearing time of primary and remote back-up protection systems);
Sb Normal tripping operations of second
remote back-up protection system (reciprocal of fault clearing time of second remote back-up protection system);
Sm Manual switching rate;
θpm and θbpm Reciprocal of primary and remote back-up protection systems routine test time interval (RTTIp and RTTIb), respectively.
Appendix
Case study data for reliability analysis: Rc=0.5 (repairs per hour)
1 (test per hour) =
Rt
1 (test per hour) =
Rbt
0.5 (repairs per hour) =
Rr
0.5 (repairs per hour) =
Rbr
0.5 (repairs per hour) =
Rbp
10-6(failures per hour)
= Fcc
10-6(failures per hour)
= Fbcc
10-6 (failures per hour)
= Fbp
10-9 (failures per hour)
= Fccc
43200 (operations per hour) =
Sn
21600 (operations per hour) =
Sbn
14400 (operations per hour) =
Sb
0.5 (operations per hour) =
Sm
References
[1] L. Wang, G. Wang and Z. Sun, “Determination of the optimum routine maintenance intervals for protective systems”, IEEE Power Engineering Society General Meeting, pp. 1-5, Jul. 2009. [2] K. Mazlum and H. A. Abyaneh, “Relay
coordination and protection failure effects on reliability indices in an interconnected sub-transmission system”, Electric Power Systems Research, Vol. 79, No. 7, pp. 1011-1017, Jul. 2009.
[3] X. Yu and C. Singh, “A Practical approach for integrated power system vulnerability analysis with protection failures”, IEEE Transactions on Power Systems, Vol. 19, No. 4, pp. 1811-1820, Nov. 2004.
[4] X. Yu and C. Singh, “Power system reliability analysis considering protection failures”, IEEE Power Engineering Society Summer Meeting, pp. 963-968, Jul. 2002.
[5] J. J. Kumm, M. S. Weber, D. Hou and E. O. Schweitzer, “Predicting the optimum routine test interval for protection relays”, IEEE Transactions on Power Delivery, Vol. 10, No. 2, pp. 659-665, Apr. 1995.
[6] R. Billinton, M. Fotuhi-Firuzabad and T. S. Sidhu, “Determination of the optimum routine test and self-checking intervals in protective relaying using a reliability model”, IEEE Transactions on Power System, Vol. 17, No. 3, pp. 663-669, Aug. 2002.
[7] H. Seyedi, M. Fotuhi-Firuzabad and M. Sanaye-Pasand, “An extended Markov model to determine the reliability of protective system”, IEEE Power India Conference, pp. 1-5, Apr. 2006.
[8] P. M. Anderson and S. K. Agarwal, “An improved model for protective system reliability”, IEEE Transactions on Reliability, Vol. 41, No. 3, pp. 422-426, Sep. 1992.
[9] P. M. Anderson, G. M. Chintaluri, S. M. Magbuhat and R. F. Ghajar, “An improved reliability model for redundant protective systems Markov models”, IEEE Transactions on Power Systems, Vol. 12, No. 2, pp. 573-578, May 1997. [10] S. T. J. A. Vermeulen, H. Rijanto and F. A. D.
Schouten, “Modeling the influence of preventive maintenance on protection system reliability performance”, IEEE Transactions on Power Delivery, Vol. 13, No. 4, pp. 1027-1032, Oct. 1998.
[11] K. Kangvansaichol, P. Pittayapat and B. Eua-arporn, “Routine test interval decision for protective systems based on probabilistic approach”, IEEE Power System Technology Conference,pp. 977-988, Aug. 2000.
[12] K. Kangvansaichol, P. Pittayapat and B. Eua-arporn, “Optimal routine test intervals for pilot protection schemes using probabilistic methods”, IEE Power System Protection Conference, pp. 254-257, Apr. 2001.
[13] Y. Damchi and J. Sadeh, “Considering failure probability for back-up relay in determination of the optimum routine test interval in protective system using Markov model”, IEEE Power Engineering Society General Meeting, pp. 1-5, Jul. 2009.
[14] H. Etemadi and M. Fotuhi-Firuzabad, “Design and routine test optimization of modern protection systems with reliability and economic constraints”, IEEE Transactions on Power Delivery, Vol. 27, No. 1, pp. 271-278, Jan. 2012. [15] M. Sefidgaran, M. Mirzaie and A. Ebrahimzadeh,
“Reliability model of power transformer with ONAN cooling”, Iranian Journal of Electrical & Electronic Engineering, Vol. 6, No. 2, pp. 103-109, Jun. 2008.
[16] R. Billinton and R. N. Allan, Reliability Evaluation of Engineering Systems, New-York: Plenum Press, 1984.
[17] J. S. Arora, Introduction to Optimum Design, Elsevier Academic Press, Boston, 2004.
Yaser Damchi was born in Babol, Iran
in 1983. He received the B.Sc. and M.Sc. degree in Electrical Power Engineering from Zanjan University, Zanjan Iran and Ferdowsi University of Mashhad, Mashhad, Iran in 2006 and 2010, respectively. He is currently pursuing the Ph.D. degree in Electrical Power Engineering at Ferdowsi University of Mashhad, Mashhad, Iran. His research interests are power system protection and reliability.
Javad Sadeh was born in Mashhad,
Iran in 1968. He received the B.Sc. and M.Sc. with honor both in Electrical Engineering from Ferdowsi University of Mashhad, Mashhad, Iran in 1990 and 1994, respectively and obtained his Ph.D. in Electrical Engineering from Sharif University of Technology, Tehran, Iran with the collaboration of the electrical engineering laboratory of the Institute National Polytechnique de Grenoble (INPG), France in 2001. Currently, he is an associated professor at the Ferdowsi University of Mashhad, Mashhad, Iran. His research interests are power system protection, dynamics and operation.
![Fig. 2 Reliability model for protection systems [6].](https://thumb-us.123doks.com/thumbv2/123dok_us/212772.2015677/4.595.313.536.83.241/fig-reliability-model-protection-systems.webp)