International Journal of Computer Techniques – Volume 4 Issue 4, July – August 2017
ISSN: 2394-2231
http://www.ijctjournal.org
Page 96Adapted Collaborative Filtering for Web Service Recommendation
Using QOS Prediction Method
1Ms. Sangeetha A,
2Mrs. Abarna N.
1M.Phil Research Scholar, PG & Research Department of Computer Science & Information Technology Arcot Sri
Mahalakshmi Women’s College, Villapakkam, Tamil Nadu, India
2Assitant Professor, PG & Research Department of Computer Science & Information Technology Arcot Sri
Mahalakshmi Women’s College, Villapakkam , Tamil Nadu, India.
---
************************
---Abstract:
Collaborative Filtering (CF) is widely employed for making Web service recommendation. CF-based Web service recommendation aims to predict missing QoS (Quality-of-Service) values of Web services. Although several CF-based Webs service QoS prediction methods have been proposed in recent years, the performance still needs significant improvement. Firstly, existing QoS prediction methods seldom consider personalized influence of users and services when measuring the similarity between users and between services. Secondly, Web service QoS factors, such as response time and throughput, usually depends on the locations of Web services and users. However, existing Web service QoS prediction methods seldom took this observation into consideration. In this paper, we propose a location-aware personalized CF method for Web service recommendation. The proposed method leverages both locations of users and Web services when selecting similar neighbors for the target user or service. The method also includes an enhanced similarity measurement for users and Web services, by taking into account the personalized influence of them. To evaluate the performance of our proposed method, we conduct a set of comprehensive experiments using a real-world Web service dataset. The experimental results indicate that our approach improves the QoS prediction accuracy and computational efficiency significantly, compared to previous CF-based methods
Keywords—location based service, CF method, Qos prediction method, CF based web service.
---
************************
--- I. INTRODUCTIONThe thesis is based on the sole interest of the author for location-based matters. Twenty years ago, it was not possible for an outsider in a foreign country or city to quickly locate an ATM, get some cash and rush to a McDonald's restaurant to grab a nice lunch without the need to ask the locale for direction or running back and forth aimlessly[2]. However, nowadays, a foreigner can confidently locate himself and get to his desired places in short time, all thanks to the development of location-based
services. Mobile communication systems were
originally created in order to serve communication purposes. However, with the recent demand from users to have data and transaction services implemented within their own mobile devices, mobile communication service providers have been investing great a amount of resources into creating location sensitive service platforms. Such services use voice or text sequences as input and return geographical information or recommendations [3].
In order to create valuable outputs, location-based services require properly functional recommender systems to pick up the most suitable information among vast amount of available data. Basically, a typical
recommender system combines knowledge about
customers ( personal preferences, buying habits...) service items (prices, features...) and the interaction between customers and the location-based service platforms (ratings, likes, dislikes) to recommend services that users are likely to find attractive.
However, location-based services are not free of problems. Since they deal with a large amount of data and some of the data is very valuable and sensitive, location-based services have become favorite targets of hackers and data thieves who are skillful and willing enough to get themselves any piece data they want. In location-based services, knowing a user's information usually means knowing that customer's location and whereabouts, which means jeopardizing the user's privacy and security[1]. The knowledge intended to help provide customers with better choices now, having fallen into the wrong hands, becomes an effective weapon against the customers and the service providers themselves. In order to protect their customers' data from intruders, location-based service providers must know what threats they are dealing with and design systems and mechanisms that are able to protect their customers' information and privacy. Of the available location-based service currently, the social
ISSN: 2394-2231
network named Foursquare has proved itself to be one of the most successful participants of the location playground[10]. Foursquare has been able to see through the market value of location data and therefore identified the right sector of location-based service to do business with and has managed to, to some considerable extend, satisfy and attract users with timely and pleasant services as well as resolve nuisances and threats that would occur. Foursquare will be introduced in this thesis alongside theories as examples [11].
Motivation
In fact, countless people have been using location based products for a long time yet not being aware of the true nature of what they are using. To some extents, this lack of knowledge is dangerous because, since people have no clear idea about several aspects of the services they are using, they are exposed to location information security breaches, which may result in disastrous outcome privacy, reputation or even physical
well-naive users. In the thesis, an entire chapter is dedicated to studying data security threats of LBSs. This means a considerable amount of clear, simple yet refined knowledge of LBS security that could be easily understood by any average citizen who wants to know and try to protect himself while using LBSs[6]. In addition, the thesis also includes a large section of business-related matters of LBSs. In other words, anybody starting a business ca consider the thesis a reliable source of reference to get some idea about what does it mean to do LBS business[11]. Finally, the thesis will come in handy for people who are considering using the foursquare social network. The thesis utilizes the feature characteristics of Foursquare as the basis to compare, contrast and explain several aspects of LBS, meaning that multiple important points to be considered when deciding whether or not to join Four square are included in or can be answered using information provided in the
2231
http://www.ijctjournal.org
network named Foursquare has proved itself to be one ofthe most successful participants of the location-based . Foursquare has been able to see through ket value of location data and therefore identified based service to do business with and has managed to, to some considerable extend, satisfy and attract users with timely and pleasant services threats that would occur. Foursquare will be introduced in this thesis alongside
In fact, countless people have been using location-based products for a long time yet not being aware of the
re using. To some extents, this lack of knowledge is dangerous because, since people have no clear idea about several aspects of the services they are using, they are exposed to location information security breaches, which may result in disastrous outcomes to the -being of the naive users. In the thesis, an entire chapter is dedicated to studying data security threats of LBSs. This means a considerable amount of clear, simple yet refined at could be easily understood by any average citizen who wants to know and try to . In addition, the thesis related matters of LBSs. In other words, anybody starting a business can consider the thesis a reliable source of reference to get some idea about what does it mean to do LBS . Finally, the thesis will come in handy for people who are considering using the foursquare social network. The thesis utilizes the features and characteristics of Foursquare as the basis to compare, contrast and explain several aspects of LBS, meaning that multiple important points to be considered when deciding whether or not to join Four square are included in or can rmation provided in the paper[10] .
Fig1.1: Structure of Research
Existing system
QoS is usually defined as a set of non
properties, such as response time, throughput, reliability, and so on. Due to the paramount importance of QoS in building successful service-oriented applications, QoS based Web service discovery and selection has garnered much attention from both academia and industry
prefers to select a Web service with the best QoS performance, provided that a set of Web
candidates satisfying his/her functional requirements are discovered. In reality, however, it is neither easy nor practical for a user to acquire the QoS for all Web service candidates, due to the following reasons: Web service Qos is highly depend on both users’ and Web services’
Proposed system
Here proposed an enhanced measurement for computing QoS similarity between different users and between different services. The measurement takes into account the personalized deviation of Web services’ Q and users’ QoS experiences, in order to improve the accuracy of similarity computation. Based on the above enhanced similarity measurement, we proposed a location-aware CF-based Web service QoS prediction method for service recommendation
We conducted a set of comprehensive
experiments employing a real-world Web service dataset, which demonstrated that the proposed Web service QoS prediction method significantly outperforms previous well-known methods [2]. We also incorporate the locations of both Web services and users into similar neighbor selection, for both Web services and users. Comprehensive experiments conducted on a real Web service dataset indicate that our method significantly
outperforms previous CF-based Web service
recommendation methods.
System Architecture
Page 97
of Research
QoS is usually defined as a set of non-functional properties, such as response time, throughput, reliability, and so on. Due to the paramount importance of QoS in oriented applications, QoS-based Web service discovery and selection has garnered much attention from both academia and industry. a user prefers to select a Web service with the best QoS performance, provided that a set of Web service candidates satisfying his/her functional requirements are discovered. In reality, however, it is neither easy nor practical for a user to acquire the QoS for all Web service lowing reasons: Web service Qos on both users’ and Web services’
proposed an enhanced measurement for computing QoS similarity between different users and between different services. The measurement takes into account the personalized deviation of Web services’ QoS and users’ QoS experiences, in order to improve the accuracy of similarity computation. Based on the above enhanced similarity measurement, we proposed a based Web service QoS prediction recommendation [12].
We conducted a set of comprehensive
world Web service dataset, which demonstrated that the proposed Web service QoS prediction method significantly outperforms previous . We also incorporate the of both Web services and users into similar neighbor selection, for both Web services and users. Comprehensive experiments conducted on a real Web service dataset indicate that our method significantly
International Journal of Computer Techniques – Volume 4 Issue 4, July – August 2017
ISSN: 2394-2231
http://www.ijctjournal.org
Page 98Fig 1.2. System Architecture
II. RELATED WORK
Literature review is done by collecting information from published sources such as books, news articles, reports, presentations from the libraries or recommended by professors and other electronic sources available across the internet. Data obtained using this method are analyzed, refined and presented across chapters 3 through 5, which introduce the most important topics involving the development of location-based services, including the very concept of location-based service itself. In chapter 6, literature review based data participate in developing the chapter content and structure but only as supporting platforms.
III. PREVIOUS IMPLEMENTATIONS
3.1Empirical data collection
Secondly, empirical data is collected through personal interviews. No other information about the interviewees, except their ideas is provided in the thesis so as to protect the privacy of the interviewees. Interviews are mainly done between the thesis author and location-based service users and experts. To be specific, the thesis author has chosen sixteen users and two former employees of the social network Foursquare for interview.
The reason for interviewing users is that empirical data is most usually applied in chapter 6 where a customer-oriented study is conducted [1][9]. This means those customers' points of view matters most for the development of the chapter. However, interviewees are not randomly selected. Only people who are personally known by the author to have spent a considerable amount of time using location-based services and who have exclusive original experience with such services are invited for interview so as to keep the interview results in high quality and reliability[5][3]. In addition, idea exchanges and interviews with some former employees of the social network Foursquare also provide valuable, deep
and practical information and experience in the development of location-based services. Interview based data is noted, analyzed, refined and then combined with Theoretical data from literature reviews to test whether such theoretical data is correct and applicable or they are mere unreasonable theories.
Fig : 3.1Research framework
IV. SYSTEM IMPLEMETNATION
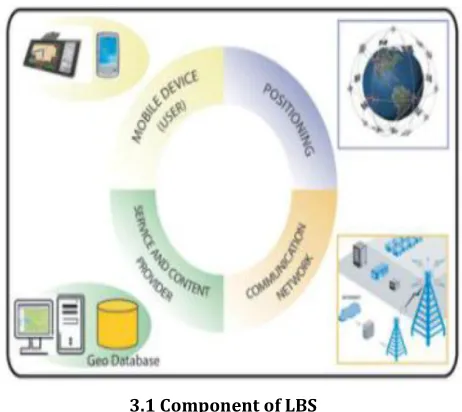
4.1Location based services infrastructure
In order for a LBS to function properly, the combination of the below components is required:
3.1 Component of LBS
ISSN: 2394-2231
http://www.ijctjournal.org
Page 99 mobile phones, PDAs, laptops, GPS devices or publicinformation stations.
Communication networks: The wireless network plays a vital role in connecting users (through mobile devices) and the LBS providers. The user's requests are sent via the communication network into the Internet then to the LBS provider and vice versa.
Positioning systems: Positioning systems gather and input user's location information into the requests sent to LBS providers. For cases in which the user wants to search for a route, his position will be required to calculate the way to his desired location. When the user demands technical or medical care, his location information will help the (technical/medical) service providers to provide better and quicker services.
Service and content Providers: LBS providers distribute the software and services that are able to process the user's query and weaved responses to the user. Content providers (map agencies, yellow pages) store and distribute geographic data that can be requested by the users or the LBS providers.
4.2 Data collection in LBS
In LBS, location data is collected using different positioning systems; each of the systems provides different aspects and characteristics of spatial data. However, there are basic requirements and general components that make up a positioning system.
Coordinate systems allow LBS data providers to assign different locations with different, unique "address" for the sake of effective and easy geographical identification process. To present locations on a flat space, the choice most often falls the famous Latitude and Longitude model. However, depending on different task requirements and data aspects, other forms of coordinate systems are created and widely used: the Cartesian coordinates, the Shape of the Earth and Universal Polar Stereographic...
Scope: This can be defined as the meaning of the coordinates given. In practice, it would be better if location data services give users names such as "University of..." or "KFC" than showing coordinate numbers.
Coverage: The extent of geographical areas to which the positioning system is able to reach. The coverage is especially related to the scope of the system. However, there are numerous cases in which the coverage level of a system is smaller in area than what is defined by the scope.
Precision: Users and service providers using geographic data must be aware of the fact that the ability of a positioning system to accurately pin-point a location often varies depending on reasons other than the system mechanism. Among the factors that can lead to an inaccurate calculation are environmental conditions (temperature, heat, wind speed...). In short, customers of location data must be ready to often face (from minor to serious) accuracy problems when querying information
about locations that usually experience environmental turbulences
4.3 Cellular network-based positioning Collaboration filtering algorithm
Int [] randoms = we.getRandomUsers (original); Int [] lines = new Int [randoms.length];
Int [] columns = new int [randoms.length]; Arrays.sort(randoms);
Int counter = 0; for
(
Int d : randoms){ lines[counter] = d/100; columns[counter] = d%100;
counter++; }
we.getRandomList(lines, columns, original, sheetData); In the above getRandomList will generate 500 random numbers from that random numbers which rating is to be picked up by using the division with 30 (number of users). For example, if one of the random numbers is 307, the user will be 10 th user (307 / 30 = 10) where 10 is dividend and item will be 7 (307 % 30 = 7) where 7 will be remainder. Here ‘lines’ represents the users and ‘columns’ represents the items. Lines[i] and columns[k] together will represents ith user’s rating on k item. The last line we.getRandomList(lines, columns, original, sheetData);) is responsible for populating randomly picked 500 ratings from ‘original’ list to ‘sheetData’
NBSSimblanceRow[] nbsSimilarRows = null; NBSSimblanceRow oNBSSimblanceRow = null; ArrayList<NBSSimblanceRow[]> listSimblances = new
ArrayList<NBSSimblanceRow[]>(); For (Int i=0; i<30; i++)
{
nbsSimilarRows = new NBSSimblanceRow[30];
For ( int j=0; j<30; j++) {
oNBSSimblanceRow = new NBSSimblanceRow();
nbsSimilarRows[j] = oNBSSimblanceRow; }
listSimblances.add(nbsSimilarRows); }
International Journal of Computer Techniques – Volume 4 Issue 4, July – August 2017
ISSN: 2394-2231
http://www.ijctjournal.org
Page 100 In the above line of code, initialize arraylist which holdsthe semblances is performed. then ‘listSimblances’ will contain 30 entries in which each entry will contain 30 NBSSimblanceRow objects which are responsible for holding the row number and its semblance with current row. i.e, if 30 users are taken, then semblance list for the 1st row (user) will contain 30 NBSSimblanceRow objects (including the self) each one containing its row number
and its semblance with the 1st row.
we.populateRows(listSimblances,sheetData); In the above line of code, the semblances values are calculated and then populate in ‘listSimblances’
for(int i=0; i<30; i++) {
nbsSimilarRows = listSimblances.get(i);
Arrays.sort(nbsSimilarRows, we. New
MyComparator()); }
In the above lines, we are sorting the obtained semblances.
List sheetData1 = ((List) ((ArrayList)
sheetData).clone());
Hashtable table = new Hashtable (); for( int i=4; i<30; i=i+4)
{
List s3 = we.populatePredictUJ(s heetData1, listSimblances, i);
List s4 = new ArrayList ();
Double mae = we.getMAE(sheetData, original, s3);
BigDecimal z1 = new
BigDecimal(mae).setScale(2,BigDecimal.ROUND_ HALF_UP);
mae = z1.doubleValue();
System.out.println(" For neighbourset size -- " + i +" MAE is " + mae);
table.put( new Double(i), mae) ; }
The second challenge arose when we used weighted sum to calculate the rating for test user-movie pairs. Since we were storing only 50 similar movies for each movie, and for each target movie, we only consider the similar movies that the active user has seen, it was often the case with the Movielens dataset that there weren't many such movies for many of the users. This resulted in bad predictions overall for large test sets. Because this was due to the sparsity of the dataset itself, we couldn't come up with a straightforward solution to this problem.
Neighborhood-based approach
Most collaborative filtering systems apply the so
called neighborhood-based technique. In the
neighborhood-based approach a number of users is selected based on their similarity to the active user. A prediction for the active user is made by calculating a weighted average of the ratings of the selected users.
To illustrate how a collaborative filtering system makes recommendations consider the example in movie
ratings table below. This shows the ratings of five movies by five people. A “+” indicates that the person liked the movie and a “-“ indicates that the person did not like the movie. To predict if Ken would like the movie “Fargo”, Ken’s ratings are compared to the ratings of the others. In this case the ratings of Ken and Mike are identical and because Mike liked Fargo, one might predict that Ken likes the movie as well.
Movie ratings
Instead of just relying on the most similar person, a prediction is normally based on the weighted average of the recommendations of several people. The weight given to a person’s ratings is determined by the correlation between that person and the person for whom to make a prediction. As a measure of correlation the Pearson correlation coefficient can be used. In this example a positive rating has the value 1 while a negative rating has the value –1, but in other cases a rating could also be a continuous number. The ratings of person X and Y of the item k are written as xk and yk, while x and y are the mean values of their ratings. The correlation between X and Yis then given by:
R(x,y)
=
∈! √ , ∋
In this formula k is an element of all the items that both X and Y have rated. A prediction for the rating of person X of the item i based on the ratings of people who have rated item i is computed as follows:
P(xi) =∑x(yi-r(x,y)/n
Where Y consists of all the n people who have rated item i. Note that a negative correlation can also be used as a weight. For example, because Amy and Jef have a negative correlation and Amy did not like “Farg” could be used as an indication that Jef will enjoy “Fargo”. The Pearson correlation coefficient is used by several collaborative filtering systems including. GroupLens, a system that filters articles on Usenet, was the first to incorporate a neighborhood-based algorithm. In GroupLens a prediction is made by computing the weighted average of deviations from the neighbor’s mean:
P(x
i) =
= +
∈ ,! ,
ISSN: 2394-2231
similar to the normal Pearson measure but uses the mean value of possible rating values (in this case the average is 4) instead of the mean values of the ratings of person and Y.
Fig 4.1 : Rating Martix format
Pearson correlation coefficient for movie ratings
• Assuming is Every one of the names have seen any of the above movie
• Let 1 denote see Let 0 denote not seen
Fig 4.2: Correlation between two products
T(a, b) =
Na = Number of customer who Bought Product A!
Nb = Number of customer who Bought Product B!
0! 1! 1! 1!
1! 0! 1! 1!
0! 1! 0! 0!
1! 0! 1! 1!
1! 1! 1! 1!
1! 0! 1! 1!
1! 0! 0! 0!
1! 1! 1! 0!
1! 1! 0! 1!
Alice!
Bob!
John!
Jane!
Bill!
Steve!
Larry!
Don!
Jack!
1! 1/3 –
0.33!
5/8 – 0.625!
5/8 – 0.625!
1/ 3 – 0.33! 1!
3/ 8 – 0.375!
3/ 8 – 0.375!
5/ 8 – 0.625!
3/8 – 0.375! 1!
5/7– 0.714!
5/ 8 – 0.625!
3/8 – 0.375!
5/7 – 0.714! 1!
2231
http://www.ijctjournal.org
ormal Pearson measure but uses the meanvalues (in this case the average is of the mean values of the ratings of person X
Pearson correlation coefficient for movie ratings
is Every one of the names have seen
Let 0 denote not seen
Correlation between two products
= Number of customer who Bought Product A!
= Number of customer who Bought Product B!
Nc = Number of customer who Both Product A and Product B!
Fig 4.3: Similarities between products
C( a, b )= ∗
Selecting Neighborhoods
Many collaborative filtering systems have to be able to handle a large number of users. Making a prediction based on the ratings of thousands of people has serious implications for run-time performance. Therefore, when the number of users reaches a certain amount a selection of the best neighbors has to be made techniques, correlation-thresholding and best
can be used to determine which neighbors to select. The first technique selects only those neighbors whose correlation is greater than a given threshold. The second technique selects the best n neighbors with the highest correlation.
1! 0.507!
0.507! 1!
0.772! 0.707!
0.772! 0.707!
Page 101 = Number of customer who Both Product A and Product
Similarities between products
√
Many collaborative filtering systems have to be handle a large number of users. Making a prediction based on the ratings of thousands of people has time performance. Therefore, when the number of users reaches a certain amount a selection of the best neighbors has to be made. Two thresholding and best-n-neighbor, be used to determine which neighbors to select. The first technique selects only those neighbors whose correlation is greater than a given threshold. The second neighbors with the highest
0.772! 0.772!
0.707! 0.707!
1! 0.833!
International Journal of Computer Techniques – Volume 4 Issue 4, July – August 2017
ISSN: 2394-2231
http://www.ijctjournal.org
Page 102Fig 4.4: Flowchart for finding best n neighbors
V
RESULT AND DISCUSSION
The methodology followed for conducting the study includes the specification of research design, sample design, questionnaire design and data collection used for analyzing the collected data.
Research design: The research design used for this study is of the descriptive type. Descriptive research studies are those studies which are concerned with describing the characteristics of a particular individual or a group.
Sample size: The sample size consisting of 45 respondents were selected for the study.
Sampling design: Since it is difficult to contact the entire population, sampling technique was adopted. The employees were interviewed using convenience sampling techniques.
Questionnaire design: Questionnaire was designed in consultation with the experts in such a manner that it would facilitate the respondents to reveal maximum information.
Data collection: The primary data was collected by using questionnaires. The questionnaire has 28 questions excluding marital status, age, factor prompted to join reliance. A five point scale was used such as strongly disagree, disagree, neutral, agree and strongly agree.
Limitations of the study
The limitations of the study are as follows: • The size of the sample was only 45.
• Some of the respondents were not responding to some of the questions posted.
• Due to the time constraint the research was not carried out to the desired level.
Fig 5.1: Pie Chart result for Job Profile
Fig 5.2: Pie Chart result for Manager
Fig5.3 : Pie Chart result for Compensation
Conclusion
A personalized location - aware collaborative
filtering method for QoS - based Web service
ISSN: 2394-2231
http://www.ijctjournal.org
Page 103 future work also includes the study of QoS characteristic. Weplan to investigate the distribution of response time and the correlation between different QoS properties such as response time and reliability.
REFERENCES:
1. Y. Zhang and Y. Fang, „„A Fine-Grained Reputation System forReliable Service Selection in Peer-to-Peer Networks,‟‟ IEEE Trans. Parallel Distrib. Syst., vol. 18, no. 8, pp. 1134-1145, Aug. 2007.
2. Z. Zheng, X. Wu, Y. Zhang, M.R. Lyu, and J. Wang, „„QoS Ranking Prediction for Cloud Services,‟‟ IEEE Trans. Parallel Distrib. Syst., vol. 24, no. 6, pp. 1213-1222, June 2013.
3. B. Mehta, C. Niederee, A. Stewart, C. Muscogiuri,
and E.J.Neuhold, “An Architecture for
Recommendation Based Service Mediation,” Semantics of a Networked World, vol. 3226, pp. 250-262, 2004.
4.
Jianxun Liu, Mingdong Tang, Member, IEEE, Zibin Zheng, Member, IEEE, Xiaoqing (Frank) Liu, Member, IEEE, Saixia Lyu, “Location-Aware and Personalized Collaborative Filtering for Web Service Recommendation”, Ieee Transactions On Services Computing, 2015.5. M. P. Papazoglou and D. Georgakopoulos, “Service-Oriented computing,” Communications of the ACM, 2003, pp. 46(10):24–28.
6. G. Kang, J. Liu, M. Tang, X.F. Liu, and K. K. Fletcher, “Web Service Selection for Resolving Conflicting Service Requests,” in Proc. 9th International
Conference on Web Services,Washington, DC, USA, July, 2011, pp. 387-394.
7. Herlocker, J.L.,Konstan, J.A.,Borchers, A.,Riedl, J.:Analgorithmic framework for performing collaborative filtering. In: Proceedings of the 22nd International ACM SIGIR Conference on Research and Development in Information Retrieval (SIGIR’99), pp. 230–237 (1999).
8. Hofmann, T.: Collaborative filtering via gaussian probabilistic latent semantic analysis. In: Proceedings of the 26th International ACM SIGIR Conference on Research and Development in Information Retrieval (SIGIR’03), pp. 259–266 (2003).
9. Hofmann, T.: Latent semantic models for collaborative filtering. ACM Trans. Inf. Syst. 22(1), 89–115 (2004).
10. Hwang, S., Lim, E., Lee, C., Chen, C.: Dynamic web service selection for reliable web service composition. IEEE Trans. Serv. Comput. 1(2), 104–116 (2008).
11. Jin, R., Chai, J.Y., Si, L.: An automatic weighting scheme for collaborative filtering. In: Proceedings of the 27th International ACM SIGIR Conference on Research and Development in Information Retrieval (SIGIR’04), pp. 337–344 (2004).
12. Kang, G.,Liu, J.,Tang, M.,Liu,X., Cao, B.,Xu,Y.:AWSR:activeweb service recommendation based on usage history. In: Proceedings of the 19th International Conference on Web Services (ICWS’12), pp. 186–193 (2012).
13. Karta, K.: An investigation on personalized collaborative filtering for web service selection. Honours Programme thesis, University of Western Australia, Brisbane (2005).
14. Linden, G., Smith, B., York, J.: Amazon.com recommendations: Item-to-item collaborative filtering. IEEE Internet Comput. 7(1), 76–80 (2003).
15. Lo,W.,Yin, J.,Deng, S., Li,Y.,Wu, Z.:
Collaborativeweb serviceQoS prediction with locationbased regularization. In: Proceedings of the 19th International Conference on Web Services (ICWS’12), pp. 464–471 (2012).
16. Ma, H., King, I., Lyu, M.R.: Effective missing data prediction for collaborative filtering. In: Proceedings of the 30th International ACM SIGIR Conference on Research and Development in Information Retrieval (SIGIR’07), pp. 39–46 (2007).