RESEARCH ARTICLE
OPEN ACCESS
Assessment of Different Structures for Predicting
Bone Age using Statistical Appearance Models
Steve A. Adeshina,
1∗Timothy F. Cootes
2∗and Judith E.. Adams
3∗1Department of Computer Engineering,Nile University of Nigeria, Abuja,
E-mail: [email protected]
2&3Center for Imaging Sciences, The University of Manchester, U.K
Abstract—We compare the utility of models of different structures in the hand for predicting skeletal maturity in young people. Bone age assessment is important for diagnosing and monitoring growth disorders. Statistical models of bone shape and appearance have been shown to be useful for estimating skeletal maturity. In this work we investigate the effect of the choice of region to model on the prediction performance. By analysing the performance on a dataset of 170 digitized radiographs of normal children we show that improvements in accuracy can be achieved by using models of the joint complexes and bones constructed by automatic registration, compared to ones built from manual annotation. We also investigate how sets of joint complexes and bones can best be combined to estimate overall skeletal age. Our results show that the best predictions are obtained from 13 RUS complexes and their combination into eight bone complexes. The mean absolute prediction errors of 0.80 (13 joint complexes) , 0.81(eight bone complexes) years for females and 0.93, 0.94 years for males respectively, demonstrates that similar results are obtained whether we use many local models of individual joints, or a smaller number of models of groups of bones.
Index Terms—Bone Age assessment, Statistical Appearance Models, Groupwise Registration.
F
1
I
NTRODUCTIONA widely used method of estimating skele-tal maturity is to examine the bones and joints of the non-dominant hand in a radio-graph. A significant difference between the bone age and the actual age of a child is an indication of growth abnormalities. The main methods used in clinical practice are those of Greulich and Pyle(GP) [5] and Tanner and Whitehouse(TW2/3) [12]. The GP method in-volves comparing the whole image with an atlas, while the TW2 method involves scoring each of a number of different bone complexes - it is less subjective but significantly slower. Both methods are subject to inter- and intra-observer variability. While there is no contro-versy as to points where growth occurs, there
Manuscript received September 28, 2017; revised October 15, 2017.
is a difference of opinion as to coverage areas and specific bones to observe while estimat-ing skeletal maturity. The GP method observes 28 growth points while the TW3 observes 13 growth points.
skeletal maturity. There are a range of possible choices of models, from using single models of the whole hand, to averaging the predic-tions of local models of individual joints and bones. This paper investigates the effect of the choice of region to model on the prediction performance. The most closely related work to that presented here is that of Thodberg et al.[14], who showed how Active Appearance Models [3], [13] can be used to locate the bones of the hand and how the parameters of the associated appearance models can be combined with other texture measures to predict skeletal age. Whereas Thodberg et al. used models of the individual bones, we build local appearance models of the regions around the bones and joints and compare with models of individual bones containing the complexes. We perform a set of systematic experiments to investigate which structures are most significant for pre-diction of skeletal age.
In our approach we manually annotated a set of points on the bones in a set of digitized ra-diographs of children’s hands. We constructed shape and appearance models of each of 20 joints and bone complexes. We also construct combined bone models of bones using equiv-alent combination bones and complexes. The parameters of the resulting models were used in a linear regressor to predict the chronological age of the child. The best results were obtained by averaging over 13 bone complexes and 8 equivalent bones. The result of the average of seven Carpal bones was also compared with that of a single model of the seven bones. In the following we describe the key components of the work and present quantitative results.
2
R
ELATEDW
ORK3
M
ETHODS3.1 Data Set
We have access to a database of radiographs of the non-dominant hand of normally developing children. The children were enrolled on a bone ageing study at the University of Manchester. Their ages ranged between 5 years and 20 years. In the following work we used a subset
of 170 (87 male and 83 female) digitized radio-graphs of normal children.
3.2 Construction of Statistical Appearance Models
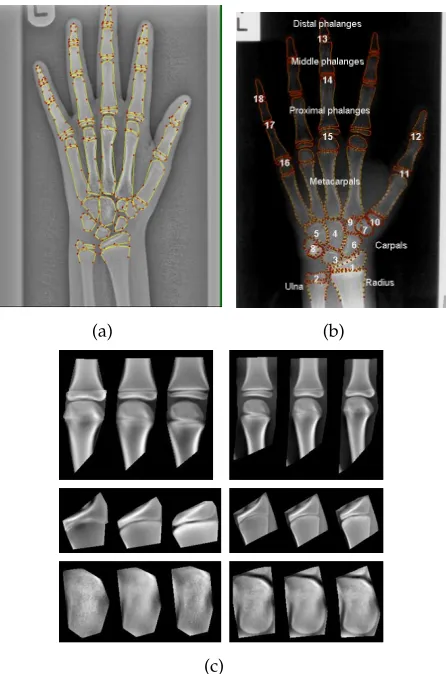
Statistical appearance models [3], [4] were gen-erated by combining a model of shape varia-tion with a model of texture variavaria-tion. Each radiograph was manually annotated with 330 points around important structures (Figure 1a). Statistical models of shape and texture (intensi-ties in the reference frame) were constructed by applying Principal Component Analysis (PCA) to the resulting annotations, leading to linear models of the form
x= ¯x+Psbs g= ¯g+Pgbg (1)
where x¯ is the mean shape, g¯ is the mean texture,Ps,Pgare the main modes of shape and
texture variation and bs,bg are the shape and
texture model parameter vectors. Combining the shape and texture models gives a combined appearance model of the form
x= ¯x+Qsc g = ¯g+Qgc (2)
whereQs,Qgare matrices describing the modes
of variation derived from the training set andc
is a combined vector of appearance parameters controlling both shape and texture.
3.3 Groupwise registration
(a) (b)
(c)
Fig. 1. (a) Radiograph with manually annotated points. (b) Bone Age growth points based on TW method. RUS bones: Ra-dius(1), Ulna(2), Metacarpal I, III, V, Proximal phalanges I, III, V (10,15,16) , Middle phalanges III, V (14,17), Distal phalanges I, III, V (12,13,18);Carpal bones:Capitate(4), Hamate(5), Trique-tral(8), Lunate(3), Scaphoid (6), Trapezium(7) and Trapezoid(9). (c) The first mode appearance variation of models from three joint complexes (Metacarpal III, Radius and Capitate) from man-ual markup(left) and after automatic registration (right).
Models of shape, texture and appearance were then constructed from the resulting points. We built a set of models of 7 local carpal models and a combined one, 13 RUS local model and 8 combined bone models of bones and growth complexes known to be important in estimating bone age [12] – see Figure 1b. Figure 2 shows examples of modes of variation of the appear-ance models for four of the local models and the mode of variation of the bone model that combines them. The figure also shows separate and combined models for Carpal bones.
a b c
d e f
g h i
j k l
l m n
Fig. 2. The first mode appearance variation of models from five joint complexes with their corresponding combined bone model (a)Metacarpal1 (b)Proximal Phalanges 1 (c)combined bone model (mc-ppha1) (d)Metacarpal3 (e) proximal phalanges 3 (f) combined bone model (mc-ppha3) (g) Middle phalanges3 (h) distal phalanges3 (i)combined bone model (mp-dpha3). (j) Proximal phalanges1 (k) distal phalanges 1 (l) combined bone model (ph-dpha1) (m)Capitate (n) Lunate (o) Combined Carpal Model
3.4 Estimation of skeletal maturity
Given the appearance models we can com-pute shape, texture and appearance parameter vectors for each structure on each image. We performed experiments that showed that ap-pearance parameters correlate with age better than either shape or texture parameters alone. We use classical linear regression of the form:
A=wTp+A0 (3)
where A is the predicted age, w is a vector of weights,pis the parameter vector andA0 is the
intercept constant. In the following we describe experiments comparing the performance of dif-ferent models and combinations of models.
4
E
XPERIMENTSpoints (Figure 1a). Shape, texture and appear-ance models were built based on the results of the (manually initialised) automatic registra-tion. Images of males and females were pooled to create the models.
For each model we computed the shape, texture and appearance c parameters for every image. We then evaluated the utility of linear age prediction models using a Leave-One-Out (LOO) paradigm. We trained linear regressors to predict age on all but one image, then tested the prediction on the left-out image. Since male and female children are known to develop at different rates, different regressor models were used for the male and the female sets. We evaluated performance using the mean abso-lute error between prediction and chronological age. This is a more robust measure than using the RMS error, which is prone to corruption by outliers.
We performed initial experiments based on established growth complex considering the 13 RUS bone complexes and 20 Bone complexes. Table 1 compares the average performance of single local appearance models build with and without automatic registration for 20 growth complexes. It demonstrates that overall the reg-istration improves the quality of the predic-tions.
Female Male Models from manual markup 1.47±0.08 1.26±0.07
Automatic registration 1.35±0.08 1.20±0.04
TABLE 1
Average performance of single bone complex models, with and without automatic registration (Mean absolute error in years).
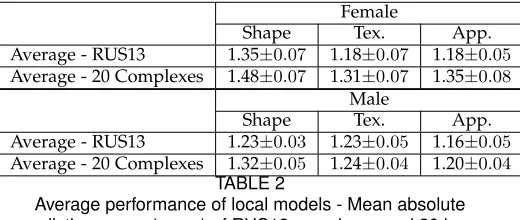
Table 2 shows the prediction errors for the average performance of single local models, Overall this shows that the predictions based on appearance parameters give the best perfor-mance, though the improvement is not clearly significant with this size of dataset. The texture parameters in female show a marginally better performance, this may be due to the large num-ber of older female children in our dataset. We intend to further explore the possibilities from texture parameters in future.
We performed experiments comparing a single model of all carpals bones with the
pre-Female
Shape Tex. App. Average - RUS13 1.35±0.07 1.18±0.07 1.18±0.05
Average - 20 Complexes 1.48±0.07 1.31±0.07 1.35±0.08
Male
Shape Tex. App. Average - RUS13 1.23±0.03 1.23±0.05 1.16±0.05
Average - 20 Complexes 1.32±0.05 1.24±0.04 1.20±0.04
TABLE 2
Average performance of local models - Mean absolute predictions error (years) of RUS13 complexes and 20 bone
complexes.
diction based on the average of that from each individual carpal bone model. See row 5 of Figure 2 for the image of the models. Table 4 (rows 2 and 3) shows the resulting prediction errors. The difference between the individual bones average mean absolute errors is not sig-nificant. However the errors are comparatively high. This justifies the exclusion of carpal bones from skeletal maturity estimation in line with recent medical studies [12].
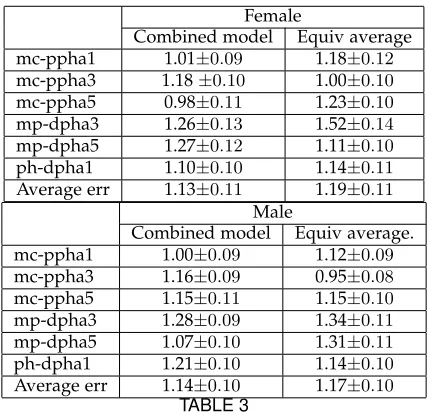
We performed further experiments to pare the performance of individual bone com-plexes (joints) with combined model of bones which combine two or more complexes. We use the 13 RUS bone complexes shown in Figure 1b. Proximal joints were combined within the 13 RUS Complexes to give a total of eight models. Eight examples of RUS 13 bone com-plexes and how they are constituted into four bone models are shown in Figure 2 (first 4 rows). Additional combinations of complexes not shown are metacarpal5 + proximal pha-langes5 (mc-ppha5) and middle phalanges 5 + distal phalanges 5 (mp-dpha5). Six combined bone models plus Radius and Ulna are com-pared with the 13 RUS complexes. The mean absolute errors of the combined bone models versus the average error of the two equivalent complexes are shown in Table 3 (rows 6 and 7). The results show that the combined bone models are slightly more effective than the in-dividual based models, but the difference is not statistically significant.
Overall age prediction can be improved by averaging the ages estimated from each local bone model over the set (Aµ= 1nPNi=1Ai, where
Female
Combined model Equiv average mc-ppha1 1.01±0.09 1.18±0.12
mc-ppha3 1.18±0.10 1.00±0.10
mc-ppha5 0.98±0.11 1.23±0.10
mp-dpha3 1.26±0.13 1.52±0.14
mp-dpha5 1.27±0.12 1.11±0.10
ph-dpha1 1.10±0.10 1.14±0.11
Average err 1.13±0.11 1.19±0.11
Male
Combined model Equiv average. mc-ppha1 1.00±0.09 1.12±0.09
mc-ppha3 1.16±0.09 0.95±0.08
mc-ppha5 1.15±0.11 1.15±0.10
mp-dpha3 1.28±0.09 1.34±0.11
mp-dpha5 1.07±0.10 1.31±0.11
ph-dpha1 1.21±0.10 1.14±0.10
Average err 1.14±0.10 1.17±0.10
TABLE 3
Average performance of local models - Mean absolute predictions error (years) of RUS13 complexes and 20 bone
complexes.
computed the average from predictions of eight combine bone models versus 13 RUS complexes and results are shown in Table 4 (rows 4 and 5).
Female Male 20 local models (RUS + Carpals) 0.92±0.09 0.92±0.07
Individual Carpal bones’ model 1.30±0.10 1.00±0.08
Combined carpal model (not av) 1.32±0.14 1.16±0.09
Combined bone models 0.81±0.08 0.94±0.08
13 RUS local models 0.80±0.09 0.93±0.08
TABLE 4
Mean absolute predictions error (years) using average predictions of constituent bone models.
5
D
ISCUSSION ANDC
ONCLUSIONSThis work confirms earlier work [14] that good predictions of chronological age can be made using simple linear predictors based on the parameters of appearance models of bones and joint complexes of the hand. The mean absolute prediction errors of 0.80, 0.81 years for males and 0.93, 0.94 years for females are encour-aging. The average of predictions from Table 4 shows a small difference between between the 8 combined models and the 13 RUS joint complexes. The results of a combined Carpals’ model versus average of single Carpal models shown in Table 4 also shows a small difference. This suggests that it may not matter whether
a combined bone models or single complex models are used. The mean absolute prediction errors correspond to root mean square errors of about 1.1 and 1.2 years. Thodberg et al. [14] describe a system based on appearance models of the bones, which achieves an RMS error of 0.87 years between predicted age and chrono-logical age on a large dataset, using a set of linear predictors for each bone (one for each of several age ranges). We are currently ex-tending our dataset, and will explore whether non-linear models and multiple predictors can further improve our results.
Steve A. AdeshinaDr Steve A Adeshina is with the Nile Uni-versity of Nigeria, Abuja Nigera.
Judith E. AdamsProf Judith Adams is with Centre for Imaging Sciences, The University of Manchester, Manchester, UK.
R
EFERENCES[1] L. Bocchi, F. Ferrara, I. Nicoletti, and G. Valli. An artificial neural network architecture for skeletal age assessment. In Proc. 2003 International Conference on Image Processing, volume 1, pages 1077–1080, Sept. 2003.
[2] T. Cootes, C. Twining, V.Petrovi´c, R.Schestowitz, and C. Taylor. Groupwise construction of appearance mod-els using piece-wise affine deformations. In 16th British Machine Vision Conference, volume 2, pages 879–888, 2005. [3] T. F. Cootes, G. J. Edwards, and C. J. Taylor. Active
appearance models. IEEE Transactions on Pattern Analysis and Machine Intelligence, 23(6):681–685, 2001.
[4] T. F. Cootes, C. J. Taylor, D. Cooper, and J. Graham. Active shape models - their training and application. Computer Vision and Image Understanding, 61(1):38–59, Jan. 1995. [5] W. W. Greulich and S. I. Pyle. Radiographic Atlas of Skeletal
Development of Hand Wrist. Palo Alto, CA: Stanford Univ. Press, 1971.
[6] T. S. Levitt, M. W. Hedgcock, D. N. Vosky, and V. M. Shadle. Model-based prediction of phalanx radiograph boundaries. InProc. SPIE Medical Imaging, volume 1898, pages 670–678, 1993.
[7] S. Mahmoodi, B. S. Sharif, E. G. Chester, J. P. Owen, and R. Lee. Skeletal growth estimation using radiographic image processing and analysis. IEEE Transactions on Infor-mation Technology in Biomedicine, 4(4):292 – 297, Dec. 2000. [8] D. J. Michael and A. C. Nelson. Handx: a model-based
system for automatic segmentation of bones from digital hand radiographs. IEEE Transactions on Medical Imaging, 8(1):64–69, 1989.
[9] M. Niemeijera, B. van Ginnekena, C. Maasa, F. Beek, and M. Viergevera. Assessing the skeletal age from a hand radiograph: automating the tanner-whitehouse method. InProceedings of SPIE – Volume 5032, pages 1197–1205, May 2003.
[10] E. Pietka, A. Gertych, S. Pospiech, F. Cao, H. K. Huang, and V. Gilsanz. Computer-assisted bone age assessment: image preprocessing and epiphyseal/metaphyseal roi ex-traction. IEEE Transactions on Medical Imaging, 20(8):715– 729, 2001.
[11] D. Rueckert, A. Frangi, and J. Schnabel. Automatic con-struction of 3D statistical deformation models using non-rigid registration. InMICCAI, pages 77–84, 2001.
[12] J. M. Tanner, R. H. Whitehouse, W. A. Marshall, M. R. Healy, and H. Goldstein. Skeletal Maturity and Prediction of Adult Height (TW2 Method). New York, NY: Academic, 1965.
[13] H. Thodberg. Hands-on experience with active appear-ance models. InSPIE Medical Imaging, Feb. 2002.
[14] H. Thodberg, S. Kreiborg, A. Juul, and K. Pedersen. The bonexpert method for automated determination of skeletal maturity. Medical Imaging, IEEE Transactions on, 1(1309):52–66, 2009.
[15] A. Tristan-Vega and J. Arribas. A radius and ulna tw3 bone age assessment system. Biomedical Engineering, IEEE Transactions on, 55(5):1463–1476, 2008.