12
Experimental Study on Potentiality and Pace
Analysis of Urban Road
Ankur Narwal
1, Mr. Pardeep
21
M. Tech Student, Department of civil engineering, SPGOI, Rohtak
2
Asst. Professor, Department of civil engineering, SPGOI, Rohtak
ABSTRACT
Efficient transportation is very important for the rapid economic growth of a country and road transportation is the only mode that is complete in itself. The urban transportation framework is the backbone of the economic activities in all urban communities everywhere throughout the world, and consequently sustains livelihood of the people living in them. Normal urban transportation facility involves railways, waterways and roads. Among these, the huge extent comprises of roads. Most planning and research efforts have focused on the road system. In essence, road transportation system is the major player in the economic activities of most urban centers. In recent times, many cities have seen a large increase in road traffic and transport demand, which has consequently, lead to decrease in capacity and inefficient performance of traffic systems.
Keywords: Efficient, transportation, potentiality, pace analysis, urban road.
INTRODUCTION
As the road development has not matched the transport demand, the country is facing a problem of severe traffic congestion resulting in large number of accidents, delays and frustration on the roads. In the past, it was thought that in order to resolve the decreased capacity problem it was simply to provide additional road space. This was the main strategy applied in the U.S.A at the wake of 1960’s and 1970’s.
A lesson learnt from this strategy is that increasing capacity of road alone is ineffective because it induces travel growth that negates the benefits of highway expansion. Moreover, there is complexity in so doing for one reason that most cities are already built-up areas; hence it is difficult to carry out any substantial expansion works. In practice, it is neither socially nor economically acceptable to balance supply and demand solely by increasing road capacity. Although the expansion of road infrastructure is not absolutely ruled out as the demand may be expected to continue to grow by time, the immediate, most relevant and acceptable strategy to mitigate capacity problems and increase efficiency of the road network is through traffic management applications. The most recent approach that has gained prominence in traffic management operations is the introduction of Intelligent Transportation System (ITS). Such technology helps in monitoring and managing traffic flow, reduce congestion, and provide alternate routes to travelers and increases safety. These frameworks have made noteworthy accomplishment in significant urban areas of many created nations of America, Asia and Europe. For most cities of the developing countries, they have yet to realize these benefits, primarily due to economic and technological constraints.
On the other hand the traditional tools that are applied as traffic and demand management tools to increase the efficiency of the transport system include and not limited to: prioritization of road users (i.e. introduction of truck lanes, bicycle and pedestrian routes etc.), road markings and signs, enforcement devices (i.e. camera, police patrol, etc.), regulation of parking space, congestion charges, traffic restraints (i.e. limiting entry to city centre etc.), improvement of public transportation, etc. These tools are relatively cost effective and technologically affordable and are applicable both in developing and developed countries. However, much as they may seem affordable, yet they are not effectively implemented in most developing countries.
13 traverse a point or a uniform segment of the roadway during a given time period under condition of roadway, traffic and control conditions”. Capacity is greatly influenced by the roadway, traffic and friction on the road. The roadway conditions include geometric parameters such as type of facility, lane width, shoulder width, horizontal and vertical alignments etc. The traffic parameters include dimensions of vehicles, type of vehicle etc. Side friction factors are defined as all those activities taking place by the sides of road and sometimes within the road, which interfere with the traffic flow on traveled way.
CAPACITY OF URBAN ROADS IN PLAIN AREAS
Capacity provides the basis for determining the number of traffic lanes to be provided for different road section regarding volume, composition and other parameters of traffic. IRC has developed the guideline on the capacity of urban roads. These guidelines are based on experience in developed countries and limited studies carried out in India. IRC 106:1990 provides “Guidelines for Capacity of Urban Roads in Plain Areas”. These guidelines are applicable for the mid block sections of urban roads but these are not directly applicable for the urban expressways.
Capacity
Capacity is defined as “maximum hourly rate at which persons or vehicles are reasonably expected to traverse a point or a uniform segment of a roadway during a given time period under conditions of roadway, traffic and control conditions”. The roadway conditions consist of geometric parameters such as type of facility, lane width, shoulder width, horizontal and vertical alignments, curves etc. Friction on the road also affects the speed and capacity of vehicles.
Speed
Speed is the rate of motion of individual vehicles of the traffic stream. It can be measured in meters per second or generally as kilometers per hour. Two types of speed measurements are commonly used in the traffic flow analysis i.e.
i) Space mean speed ii) Time mean speed
For the purpose of study space mean speed is preferred over time mean speed. Space mean speed is the mean speed of vehicles in a traffic stream at any instant of time over a certain length (space) of road. In other words, this is average speed based of vehicles to traverse a known segment of roadway based on the average time. Time mean speed is the mean speed of vehicles observed at a point on the road over a period of time. It is the mean spot speed. Space mean speed is slightly less than the time mean speed.
Density
Density (or concentration) is the number of vehicles' occupying a unit length of road at an instant of time. The unit length is generally one kilometer. Density is expressed in relation to the width of the road (i.e. per lane or per two lanes etc.). When vehicles are in a jammed condition, the density is at maximum. It is then termed as the jam density.
Functional classification of urban roads
Besides the Expressways, urban roads can be classified into the following four main categories:
(i) Arterial (ii) Sub-arterial (iii) Collector Street (iv) Local Street
14 (ii)Sub-arterial:- A general continuous route for through traffic usually but offering somewhat lower level of traffic
mobility than the arterial.These are functionally similar to arterials but with somewhat lower level of travel mobility. These have property of Frontage development, side roads, bus stops, nostanding vehicles, waiting restrictions.
(iii)Collector Street:- A street for collecting and distributing traffic from and to local streets and also for providing access to arterial streets. Normally, full access is allowed on these streets from abutting properties. There are few parking restrictions except during the peak hours. Characteristics of these roads are free frontage access, parked vehicles, bus stops, no waiting restrictions.
(iv) Local Street:- A street primarily for access to residence, business or other abutting property. They allow unrestricted parking and pedestrian movements.
Idealized Speed--Flow Relationship
The idealized relationship between speed, volume and density is expressed in the three basic diagrams given in Fig.1, which are collectively known as the fundamental diagram of traffic flow.
15 DATA COLLECTION
In essence this chapter focused to find information about traffic facilities, traffic conditions, environmental conditions, side friction and to identify relevant variables which are included in the experimental design.
SITE SELECTION CRITERIA
The speed-flow data and friction data for the present study were collected on the identified section of urban arterial road. The study sites were selected to meet the requirement of the objectives of the study. The following criteria were followed while selecting th e sites for the study-
(i) The section of road selected for the study constitutes four -lane with straight stretch, leveleda wa y from the influence of road intersection. The road pavement was in good condition.
(ii) The platooning of the vehicles on the road should not be present. (iii) The site is not having any hindrance to the sight distance.
(iv) The study site presents uniform features in respect of pavement condition, shoulder condition and road alignment for sufficient distance on its both sidesalon g length of the road.
(v) The site of study provided proper working space for the positioning of thestudy teams and for proper placement of the video camera.
(vi) The section of road selected for study has some streets for enabling the merging and divergin g of vehicle on the road. The study site is so selected that the placement of equipment or team doesn’t attract undue attention of the drivers to affect their speeds.
(vii) Convenience of the road users and safety of the study team also taken care.
Traffic Conditions
Identification of traffic conditions involved primarily two items, which includes vehicle composition and directional distribution as explained below:
(i) Vehicle composition
The motor traffic mainly consists of passenger cars,light vehicles (jeeps, pickups, micro-vans, and utility vehicles), mini-buses, and fewlarge buses, big trucks, and motorcycles (two-wheelers) and three wheelers. Later in this paper the vehicle types are classified in two major groups based on speed. They include fast moving vehicles and slow moving vehicles. Fast moving vehicles includes car, jeep, Two wheelers, autos, buses, trucks, tractor trailer and slow moving vehicle includes cycle and cycle rickshaw which includes manual effort to drive.
(ii) Directional distribution
Traffic flow is normally recorded separately for each direction of traffic in the studied section. However, in this study vehicle distribution for each side of median consisting of two lanes each side is assumed to be same on both the sides. But the side friction on the road noted individually for both sides for 200 meters on each side of road.
COLLECTION OF SPEED FLOW DATA
Volume is the actual number of vehicles observed to be passing apoint during a given time interval. The rate of flow represents the number of vehiclespassing a point during a time interval less than 1 hour, but expressed as an equivalenthourly rate. Time intervals ranging from about 2 minute up to one hour are used tomeasure capacities of facilities and to determine daily peaking patterns (James, 1998).
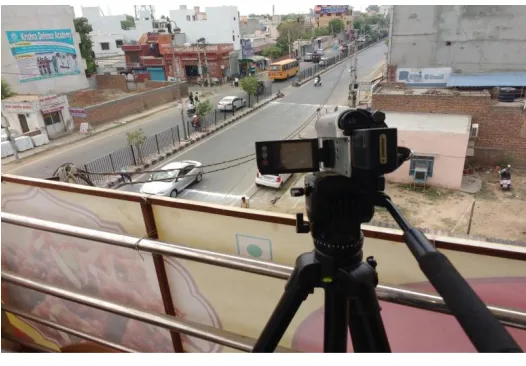
16 In the present study, five-minute time interval was taken to determine theequivalent hourly traffic flow rate. Accordingly, the speed-volume data were collected in terms of 5-minute time intervals. In manual data collection, the number and type ofvehicles with their direction of movement and their respective speeds were noteddown in each 5-minute interval during the total duration of the study. But there is very large probability of having error in manually recording speed at site. In the VRT, thedata extraction was done in such a manner so as to get the speed and volume data in each five-minute interval for the total duration of the study. Five-minute traffic countis converted to the equivalent hourly flow rate by multiplying the number of vehicles with 12. The data extracted from the VRT study is used in the project.
Fig 2: Data Collection by VRT
TRAFFIC ANALYSIS
Data Reduction
Data reduction essentially concerns registering of relevant events not directlymeasured in the field and creates merged files with all relevant data for the site, and finally reduces the data to obtain traffic flow, speeds, vehicle types andfriction events. In this case, for instance events recorded in the video from thefield are considered as not directly measured in the field, hence retrieving themfrom the videocassettes is considered as part of the reduction process.However, there is some overlap of interpretation here, because at some pointthis is also part of data collection.
Traffic Analysis Requirements
Traffic analysis in terms of daily and hourly variation and its composition helps the designer to adopt the appropriate values of traffic for the design of geometrics and pavement for the road. It also helps in planning the various facilities on the road. Regulatory measures for controlling traffic are based on peak hour traffic on the road. PCU values are required for converting number of traffic into total traffic in terms of passenger car units which is unit for expressing traffic volume on the road.
Composition of Traffic
The traffic using a road is composed of a variety of vehicles ranging from the simple cycle to the motor car and the heavy commercial vehicles, each type having an influence on the performance of' the road in its own way. A simple volume count, without classifying the vehicle into distinct types, is of limited use. It is, therefore, the normal practice to classify the vehicles into distinct types.
The vehicles are mainly classified into two types: i) Fast Moving Vehicles
17 (i) Fast Moving Vehicles: - In this category motor driven vehicles are considered such as cars, jeeps, autos, buses,
trucks, motorcycles, scooters, light commercial vehicles and tractor-trailers etc. They generally move on the road with speed more than 20 kmph.
(ii) Slow Moving Vehicles: - In this category manually driven or animal driven vehiclesare considered such as cycles, cycle rickshaws, horse drawn vehicles and bullockcarts. They generally move on the road with speed less than 20 kmph.
CONCLUSIONS
In the present paper traffic volume, speed and friction factor is studied on an urban stretch in the Karnal city. The selected stretch is four lane divided road with 2×7.5 m carriageway, 1m median and 1m shoulder on each side. The following main conclusions were drawn from the study-
(i) Traffic study was carried out in the three stretches of 2 hours each i.e. 08:00 AM to 10:00 AM, 12:00PM to 02:00 PM and 08:00 PM to 10:00 PM.
(ii) From the traffic volume data it is observed that maximum hourly traffic on the road is 2460 vehicles/ 3132 PCU (12:30 PM to 01:30 PM) and the minimum traffic is 356 vehicles/467 PCU (09:00 PM to 10:00 PM).
(iii) From the traffic composition it is observed that maximum contribution is of two wheelers with 38% followed by Autos having 29%, cars/jeeps 25% and others 8%.
(iv) The traffic in terms of PCUs maximum contribution is of autos with 45% followed by two wheelers 22%, cars/jeeps 19% and others 14%.
(v) The fast moving vehicle on the road is 98% and 2% vehicle on the road is slow moving vehicle or human drawn vehicles. The fast moving vehicle on the road in terms of PCU is almost 99% and the slow moving vehicle on the road is almost 1%
(vi) From the speed flow results it is observed that 98th percentile speed is found to be 52 kmph which is less than the present recommendation of IRC which is 60 kmph. The 85th percentile speed for the road is found to be 39kmph which indicated the upper safe limit for the vehicles moving on the road. The 15thpercentile speed on the road is found to be 15kmph which defines the minimum speed to avoid congestion on the road.
REFERENCES
[1]. Reddy,R., Rao, S.N. and Rao, C.R. (2008),“Modeling and evaluation patterns on the impact of on-street parking in reference to traffic mobility”, Journal of Indian Roads Congress, Vol.69 (1), 101 — 109.
[2]. Koshy, R.Z., and Arasan, V.T. (2005), “Influence of Bus Stops on Flow Characteristics of Mixed Traffic”, Journal of Transportation Engineering, ASCE, Vol.131 (8), 640-643.
[3]. Munawar, A. (2006), Queues and Delays at Signalized Intersections, Indonesian Experience, Paper at 5th International Conference on Highway Capacity and Quality of Service, Yokohama, Japan.
[4]. Bang, K.L., Carlsson, A., and Palgunadi. (1995)“Development of Speed-flow Relationships for Indonesian Rural Roads using Empirical Data and Simulation”Transportation Research Record 1484,Transportation Research Board, National Academy Press, Washington, D.C.
[5]. Kadiyai, L.R., Lal, N.B. and Swaminathan A.K. (1991) “Speed Flow Characteristics on Indian Highways, IRC Journal. Vol. 52-2, pp 233-262.
[6]. Indian Road Congress (IRC: 106-1990) “Guidelines for the Capacity of Urban Roads in Rural Areas”, New Delhi. [7]. Munawar, A. (2011) “Speed and Capacity for Urban Roads”, IndonesianExperience 6th International Symposium on
Highway Capacity and Quality of Service Stockholm, Sweden June 28 — July 1, 2011.
[8]. Gibreel, G., Dimeery,SA. andHassan,Y. (1999)Impact of highway consistency on capacity utilization of two-lane rural highways. Canadian Journal of Civil Engineering, 26(6): 789¬798.
[9]. Chandra, S. and Kumar, U.,(2003)“Effect of Lane Width on Capacity Under Mixed Traffic Conditions in India” Journal of Transportation Engineering, ASCE, 129(2): 155-160.
[10]. Greenshields, B.D. (1935), “A study of traffic capacity” Highway Research Board Proceedings, Vol.14: 448-477. [11]. Chiguma, M.L.M. (2007), “Analysis of Side Friction Impacts on Urban Road Links: Case study of Dar-es-salaam”,
Doctoral Paper submitted to Royal Institute of Technology, Stockholm, Sweden.