Research Journal
Volume 7, No. 20, Dec. 2013, pp. 11–16
DOI: 10.5604/20804075.1073045 Original Article
Received: 2013.09.19 Accepted: 2013.10.14 Published: 2013.12.06
DETERMINATION OF OPERATOR’S IMPACT ON THE MEASUREMENT DONE
USING COORDINATE TECHNIQUE
Ksenia Ostrowska1, Danuta Szewczyk2,Jerzy Sładek3
1 Laboratory of Coordinate Metrology, Mechanical Department, Cracow University of Technology, Al. Jana Pawła II 37, 31-864 Kraków, Poland, e-mail: [email protected]; [email protected]; [email protected]
ABSTRACT
Coordinate measuring arms (CMAs) are devices which more and more often replace conventional coordinate measuring machines because of their undoubted advantages, such as mobility, the opportunity to increase the measuring volume, the opportunity to connect the optical probe, and above all, good price-quality ratio. Because these devices are handheld and redundant, what has the greatest impact on the measurement result accuracy are the operator, the machine kinematics and its ability to obtain
re-peatable measurement results; despite the fact that one point can be obtained from an infinite number of shoulders’ positions. In this paper it was determined by using R&R method how significant are the impacts of both the operator and the measuring device
on the accuracy of measurements done with CMA, both with rigid switch probe and optical probe.
Keywords: R&R method, coordinate measuring arms (CMA), operator impact, re -peatability, reproducibility.
INTRODUCTION
Coordinate Metrology enables imaging objects by scanning surfaces and whole ob-jects through the use of optical technique and computed tomography. Not long ago classical (contact) measuring machines were the main direction of development of the coordinate measuring technique. In recent years, how-ever, growing interest in optical measuring devices of coordinate measuring technique was noted. Contactless measurement methods are characterized by: a very short measure-ment time, lack of necessity to program the machine, non-invasiveness and a large amount of data obtained for later analysis. The big-gest disadvantage of this method is its small accuracy in comparison to contact coordinate measurements [6, 7, 9, 12].
Currently the coordinate measurements are the most advanced section in measuring
tech-nique used during quality control in the indus-try. Because of higher and higher requirements manufacturers of measuring instruments tend to continuously improve their devices. Coor-dinate Measuring Arms (CMAs)are among the most modern measuring devices. Their design makes it is possible to perform measurements of complex objects with high accuracy and in a very short time, what has a big impact on the quality of the product. CMAs cooperate with both switch probes, as well as contactless tri-angulation probes. Their undoubtedly biggest advantages are mobility and opportunity to increase their measuring volume up to 60 m through the use of systems, such as Gridlock or SpaceLock [5, 8, 11, 16, 19].
This paper presents the impact of the
op-erator and of the measuring device using R&R
R&R METHOD
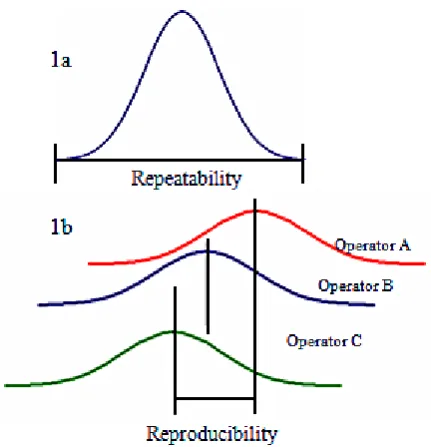
The “R&R” method (Repeatability and Re -producibility) is based on the calculation of re-peatability and reproducibility of measurements, where reproducibility is, depending on the adopt-ed set of variable conditions, a resultant of uncer-tainty including these conditions, while repeat-ability is an element of uncertainty derived from the gauge [10, 15].
In analysis by the “R&R” method, three basic
concepts need to be used, such as: repeatability,
re-producibility and inaccuracy. The definition of re -peatability given as the standard uncertainty is de-termined in general as σg (gauge). The repeatability given as expanded uncertainty is in fact given as double expanded uncertainty (range of uncertain-ty) and is described as an abbreviation EV (equip-ment variation). A coverage factor t = 2.575 (level
of confidence p = 99%) is most commonly used:
EV = 2t σg = 5.15 σg (1) Reproducibility of measurements [17] is the degree of compliance of the measurements results performed in variable conditions. To determine
the reproducibility of the “R&R” method, follow -ing the experience gained in the industry, only the operator that performs measurements under re-peatability conditions needs to be changed.
The reproducibility given as the standard un-certainty is usually determined as σa (appraiser – carrying measurement). Reproducibility ex-pressed in the form of the expanded uncertainty is reported as double expanded uncertainty (range of uncertainty) and described as an acronym AV (appraiser variation). A coverage factor t = 2.575 is most commonly used:
AV = 2t σa = 5.15 σa (2) To interpret the difference between
repeat-ability and reproducibility, definitions of the con -ditions of continuity need to be known, because all the cross between these concepts usually arise
from the definition [10] (Figure 1).
According to [17] refractoriness is defined
as a systematic error, i.e. the difference between
the average of an infinite number of measurement
results of the same size performed in terms of re-peatability, and the true value measured quantity. Refractoriness is generally designated averaging the error of the appropriate number of repetitions of measurements.
Reproducibility conditions cause randomiza-tion of systematic error, but its expected value in
a hypothetical repetition of a series of
measure-ments is zero. Analysis of R&R applies the same
mathematical apparatus, which Shewhart used to develop his control cards, especially card Xcer– R
(therefore the „R&R“ methodology is often called
as the analysis of medium and stretch marks). This analysis is a tool to isolate and evaluate the participation of components of variation in the to-tal scatter of measurements carried out during the monitoring of the manufacturing process.
Currently, the “R&R” analysis is a proven,
recognized and required by many customers method (particularly the automotive industry).
Till now, accepted procedures of “R&R” analysis
have been introduced by the so-called “big three” (Ford, Chrysler, General Motors) in collabora-tion with Automotive of the American Society for Quality Control (ASQC) and the Automotive Industry Action Group (AIAG) under the require-ments of the quality system QS-9000 [3, 10].
R&R METHOD (FORD-TYPE-2 FULL
VERSION)
This method allows to determine the error of repeatability and reproducibility of the measuring gauge in a separated form (separately). The surements were made by three operators, who mea-sured ten parts (distance on step gauge ball-bar) in three trials. Measurement conditions were similar to the conditions of repeatability [1, 2, 3, 4, 13, 14, 17].
At the beginning the measurement was performed using CMA with rigid switch probe, where infor-mation of the contact was induced by an operator.
The results were then processed in PC-Dmis met -rological software (Figure 2).
Then the measurement was performed using CMA with a mounted R-Scan triangulation probe.
As a result a cloud of points in 3DReashaper col -laborative software was obtained, and then it was imported into Gom Inspect software pro-vided by GOM, where data were processed and calculated (Figure 2).
Sequence of performed operations in R&R method for Coordinate Portable – Arm with switch probe
a) Each of the operators carried out the measure-ment of 10 different length of artefact (Figure 3).
b) Heave value (R) for each operator was calcu-lated, as an absolute value of the difference between the value of maximum and minimum length of the measurement results:
RJ = P Pg− d (3)
c) The sums of individual heave values were
calcu-lated (ΣRA, ΣRB, ΣRC).
d) Average values of the heave sum of the indi-vidual operators were calculated:
L R
R A
Acer =
∑
= 0.0140 (4)L R
R B
Bcer =
∑
= 0.0220 (5)L R
R C
Ccer =
∑
= 0.0190 (6)where: L – quantity of measured parts. e) Average values from measurements of all
tri-als for the individual operator were calculated:
I
X
X
AAcer
=
∑
= 549.7200 (7)I
X
X
BBcer
=
∑
= 549.7150 (8)I
X
X
CCcer
=
∑
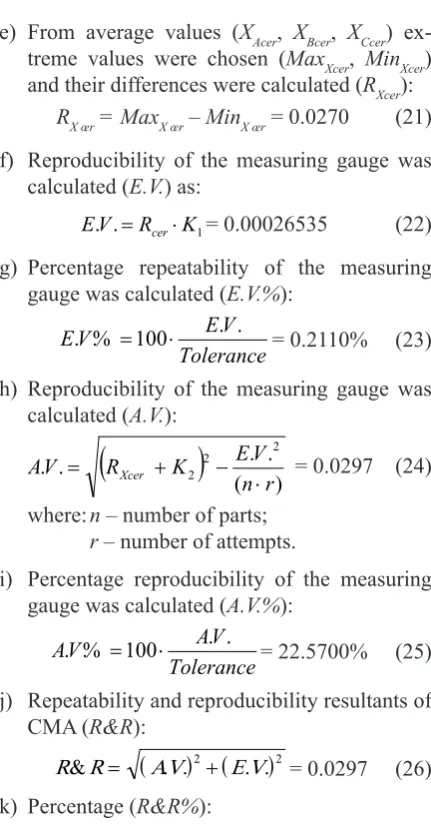
= 549.7040 (9) f) From average values (XAcer, XBcer, XCcer) ex-treme values were chosen (MaxXcer, MinXcer) and their differences were calculated (RXcer):RX œr = MaxX œr – MinX œr = 0.0160 (10)
g) The values of coefficients were determined D4 and K1 on the basis of Table 1, depending on the number of attempts.
Table 1. Values of coefficients D4 and K1
Number of attempts D4 K1
2 3.27 4.56
3 2.58 3.05
h) Reproducibility of the measuring gauge was calculated (E.V.) as:
1
.
.V R K
E = cer⋅ = 0.000042 (11)
i) Percentage repeatability of the measuring gauge was calculated (E.V.%):
Tolerance V E V
E. .% =100⋅ . . = 0.0310% (12) Fig. 2. The window of the GOM company software
Fig. 3. Measuring station with Ball-Bar artefact
j) The value of coefficient K2 on the basis of Ta-ble 2 was determined:
Table 2. Values of coefficient K2 Number of
operators K2
Number of operators
2 3.65 2
3 2.70 3
k) Reproducibility of the measuring gauge was calculated (A.V.):
(
)
) ( . . .. 2 2
2 EnVr K
R V
A = Xcer+ − ⋅ = 0.0190 (13)
where: n – number of parts, r – number of attempts.
l) Percentage reproducibility of the measuring gauge was calculated (A.V.%):
Tolerance V A V
A. .% =100⋅ . . = 13.9950% (14)
m) Repeatability and reproducibility resultants of
CMA (R&R):
(
)
(
)
R R& = AV. .2+ E V. .2
= 0.0190 (15) n) Percentage (R&R%):
(
) (
)
R R& %= AV. .% 2+ E V. .% 2
= 13.9951% (16)
Sequence of performed operations in R&R method, for Coordinate Portable – Arm with an optical probe
a) Each of the operators carried out the measure-ment of 10 different length of artefact (Figure 3). b) Heave value (R) for each operator was calcu-lated, as an absolute value of the difference between the value of maximum and minimum length of the measurement results:
RJ = P Pg− d (17) c) The sums of individual heave values were
cal-culated (ΣRA, ΣRB, ΣRC).
d) Average values of the heave sum of the indi-vidual operators were calculated:
L R
R A
Acer =
∑
= 0.0710 (18)L R
R B
Bcer =
∑
= 0.0980 (19)L R
R C
Ccer =
∑
= 0.0930 (20)where: L – quantity of measured parts.
e) From average values (XAcer, XBcer, XCcer) ex-treme values were chosen (MaxXcer, MinXcer) and their differences were calculated (RXcer):
RX œr = MaxX œr – MinX œr = 0.0270 (21) f) Reproducibility of the measuring gauge was
calculated (E.V.) as:
1
.
.V R K
E = cer⋅ = 0.00026535 (22)
g) Percentage repeatability of the measuring gauge was calculated (E.V.%):
Tolerance V E V
E. .% =100⋅ . . = 0.2110% (23)
h) Reproducibility of the measuring gauge was calculated (A.V.):
(
)
( . .).
. 2 2
2 EnVr K
R V
A = Xcer + − ⋅ = 0.0297 (24)
where: n – number of parts;
r – number of attempts.
i) Percentage reproducibility of the measuring gauge was calculated (A.V.%):
Tolerance V A V
A. .% =100⋅ . . = 22.5700% (25)
j) Repeatability and reproducibility resultants of CMA (R&R):
(
)
(
)
R R& = AV. .2+ E V. .2
= 0.0297 (26) k) Percentage (R&R%):
(
) (
)
R R& %= AV. .% 2+ E V. .% 2= 22.5701% (27)
IN TERPRETATION OF RESULTS
The percentages obtained from the
calcula-tion of specific indicators of concern:
• E.V.% – gauge (repeatability), • A.V.% – operator (reproducibility),
• R&R% – gauge and operator together (repeat -ability and reproducibility).
• below 10% – resultant error of repeatability and reproducibility (gauge and operator) is ac-ceptable,
• 10–30% – resultant error of repeatability and reproducibility can be acceptable depending on the required accuracy of measurement, • above 30% – resultant error of repeatability
and reproducibility is too high, the system should not be allowed to use.
R&R method concerns the assessment of the
re-peatability, reproducibility and dispersion in a sit-uation where measurements were carried out by different operators [15]. In both cases the opera-tors have the biggest impact. This is not surpris-ing because CPAs are manual machines, but the percentage of operator participation suggests that during calibration of given device it should be taken into account as a part of the system. Look-ing at Table 3 it can be seen, that after connection
of the optical probe to CMA the error significantly
increased, almost twice. This is related to the fact that probe errors propagate the device error. The device equipped both with contact and contact-less probe can be used conditionally depending on what measurement we want to do.
Table 3. Summary of results
Parameter CPA with switch probe (%) CPA with optical probe (%)
E.V.% 0.0310 0.2110
A.V.% 13.9950 22.5700
R&R% 13.9951 22.5701
CONCLUSION
Taking into account PN-EN ISO 14253-1 standard (Figure 5) [18], it can be seen that with
the increase of measurement uncertainty the field
of compliance decreases, which may lead to go beyond the scope of the MPE of measuring de-vice. For comparison the same measurements were carried out with the operators who use the
CMA for the first time. AV% reproducibility error
was over 18% [10].
Figure 6 shows how many factors affect the accuracy of measurement on CMA. These de-vices are largely dependent on the operator, its
experience, software experience, manual effi
-ciency, or ways of object attachment. Designat -ed error of reproducibility of the measurement originating from the operator increases the range of maximum permissible error MPE of a mea-suring device, especially in hand-held devices
for measurement, where the influence is domi -nant [10, 15].
Fig. 6. Ishikawa diagram developed for the process of assessment of measurement error [15]
Fig. 5. Measurement uncertainty: the range of
uncertainty reduces the fields of compliance and
non-compliance [15]
Effect of operator can be reduced if we as-sume the measurement strategy that includes ac-cess to the measuring object on the same side,
without changing significantly the characteristics
of the distribution of encoders.
Acknowledgements
Reported research were realized within
confines of project financed by Polish Nation
-al Centre for Research and Development No: LIDER/06/117/L-3/11/NCBR/2012.
REFERENCES
1. Ermer D.S., Prond P.E. A Geometrical Analysis of
Measurement System Variations. Annual Quality Congress Transactions, Boston 1993, p. 929-935. 2. Gawlik J., Rewilak J. Dobór i ocena zdolności
maszy-nowym. [In:] VI Sympozjum Klubu Polskie
Fo-rum ISO 9000 „Metrologia w systemach jakości”,
Kielce 2000.
3. Chrysler, Ford, General Motors: Measurements
Systems Analysis, Southfield, MI, Automotive In -dustry Action Group, March 1998.
4. Ermer D.S. Improved Gage R&R Measurement
Studies, Quality Progress 2006, p. 77-79.
5. Juras B., Szewczyk D. Dokładność pomiarów rea-lizowanych skanerem optycznym. Postępy Nauki i
Techniki, 2011, 7: 29-36.
6. Ostrowska K., Szewczyk D., Sładek J. Wzorcow
-anie systemów optycznych zgodnie z normami ISO i zaleceniami VDI/VDE. Czasopismo Techniczne,
2012, 26: 167-179.
7. Ratajczyk E., Zawacki M. Accuracy tests of mea-suring arms– is it possible to compare ASME and ISO standard requirements? Coordinate Measur-ing Technique. Problems and Implementations,
Bielsko-Biała 2008, p. 137-146.
8. Sładek J. Ocena i modelowanie dokładności maszyn oraz pomiarów współrzędnościowych,
Zeszyty naukowe seria Mechanika nr 87, Politech-nika Krakowska, 2001.
9. Sładek J., Gąska A., Olszewska M., Ostrowska K., Ryniewicz A. Metoda oceny dokładności po
-miarów realizowanych za pomocą ramion po
-miarowych wyposażonych w optyczne głowice skanujące. Mechanik, 2012, 2.
10. Sładek J., Ostrowska K., Gacek K., Bryndza M. Designation of operator impact on errors of measure -ments realized by coordinate measuring arm. Ad-vances in Coordinate Metrology, 2010, p. 130-137.
11. Sładek J., Ostrowska K., Gąska A. Modeling and identification of errors of coordinate measuring
arms with the use of a metrological model. Mea-surement, 2013, 46: 667-679 www.elsevier.com/ locate/measurement.
12. Sładek J., Sokal G., Kmita A., Ostrowska K. Wzorcowanie Współrzędnościowych Ramion Po -miarowych (WRP). Acta Mechanica et Automati-ca, 2007, 1(2).
13. Voelkel J.G. Gauge R&R analysis for two-dimen -sional data with circular tolerances. Journal of Quality Technology, 2003, 35: 153-167.
14. Duncan A.J. Quality Control and Industrial Statis
-tics (fifth edition) Richard D. Irwin Inc., 1986.
15. Sładek J. Dokładność pomiarów
współrzędnościo-wych. Wydawnictwo Politechniki Krakowskiej,
Kraków 2011.
16. Ostrowska K. Metoda oceny dokładności pomiarów realizowanych za pomocą Współrzędnościowych Ramion Pomiarów, Praca Doktorska. Politechnika
Krakowska 2009.
17. Rewilak J. Metoda doboru środków pomiarowych
w Statystycznym Sterowaniu Procesem, Praca
Doktorska. Politechnika Krakowska 2009.
18. PN-EN ISO 10360 14253-1 Kontrola wyrobów i sprzętu pomiarowego za pomocą pomiarów. Reguły orzekania zgodności lub niezgodności ze specyfikacją.
19. VDI VDE 2617 blat 9 - Accuracy of coordinate
measuring machines Characteristics and their
re-verification Acceptance and rere-verification tests for
articulated arm coordinate measuring machines –
![Fig. 4. Measuring CPA with optical probe [6]](https://thumb-us.123doks.com/thumbv2/123dok_us/8810021.1776825/3.595.306.526.169.576/fig-measuring-cpa-with-optical-probe.webp)
![Fig. 6. Ishikawa diagram developed for the process of assessment of measurement error [15]](https://thumb-us.123doks.com/thumbv2/123dok_us/8810021.1776825/5.595.306.522.230.456/fig-ishikawa-diagram-developed-process-assessment-measurement-error.webp)
