white paper4
18
0
0
Full text
(2) 26. NEAR REAL-TIME UPDATES. 27 28 29 30 31 32 33 34 35 36 37 38 39 40 41 42 43 44 45 46 47 48 49 50 51 52 53 54 55 56 57 58 59 60 61 62 63 64 65. Jay Lawrimore1, Stephan Bojinski2, Chris Little3, Matthew Menne1, Scott Woodruff4, Albert Klein Tank5 1. NOAA NCDC, Asheville NC, USA WMO, Geneva, Switzerland 3 Met Office, Exeter, UK 4 NOAA ESRL, Boulder CO, USA 5 KNMI, De Bilt, the Netherlands 2. Introduction The real-time and near real-time exchange of weather and climate data 1 and information is made possible by the collective contributions of World Meteorological Organization (WMO) Member nations. Data collected by National Meteorological and Hydrological Services (NMHSs) are exchanged and distributed rapidly to support forecasting and warnings of hydrometeorological hazards as well as a wide range of other activities including climate monitoring, detection and attribution of climate change, and ongoing research. This exchange of data and information is made possible by the Global Telecommunication System (GTS), a wide-area network that has connected WMO Members for more than four decades. Details on the design and structure of the GTS are provided in Appendix A. The GTS has supported the exchange of high-time-resolution data to support the needs of the meteorological and hydrological communities for decades. It also has largely met the needs of the climate community for high quality low-time-resolution (e.g. monthly) land station (LS) data. However, as the need for daily and sub-daily LS data has developed over the past 20 years, policy, procedures, and technology have not kept pace. While the timeliness of daily and subdaily LS data exchange typically exceeds the current requirements of the climate community, there are a number of problems associated with the transmission of these data including very limited associated metadata, and insufficient quality, consistency, and completeness required by the climate community. These problems and potential solutions are discussed in later sections. Related to the challenge of improving the availability of global surface temperature data for the purpose of climate analyses, it is important to agree on target and maximum allowed “near-real” time delays between taking a LS observation and its availability in a centralized data repository. For the purpose of this paper, we understand “near-real time” as being 24 hours (target)/48 hours (maximum) for daily and sub-daily data, and 5 days after the end of a month for monthly data for the previous month (in accord with WMO Technical Regulations).. 1. Climate data in the context of this paper refers to integrated current and historical meteorological variables, such as temperature and precipitation, used to describe, monitor, and assess climate conditions.. 2.
(3) 66 67 68 69 70 71 72 73 74 75 76 77 78 79 80 81 82 83 84 85 86 87 88 89 90 91 92 93 94 95 96 97 98 99 100 101. Data Exchange WMO Resolution 40 The free and open exchange of meteorological and climatological data over the GTS is supported by WMO Resolution 40 (WMO 2009b). This formal, albeit not legally-binding, agreement was made during the 12th WMO Congress (Cg-XII) in 1995, to address concerns that commercial meteorological activities had the potential to undermine the free exchange of meteorological data. Through Resolution 40, WMO Member nations committed to broaden and enhance the free and unrestricted (i.e. non-discriminatory and free-of-charge except for the cost of reproduction and delivery) international exchange of meteorological and related data and products (to include climatological data and products). These include data and products deemed “Essential” for the protection of life and property—particularly those required to accurately describe and forecast weather and climate. A similar Resolution 25, from the 13th WMO Congress (Cg-XIII) in 1999, concerns hydrological data. Through these Resolutions Members also committed to provide additional data and products which are required to sustain WMO Programmes at the global, regional, and national levels and to assist other Members in the provision of meteorological services in their countries. However, Members may place restrictions on the re-export for commercial purposes outside of the receiving country or group of countries forming a single economic group. Members also agreed to provide to the research and education communities, for their non-commercial activities, free and unrestricted access to all data and products exchanged under the auspices of WMO (Refer also to the white paper on Data Policy, #5). Data Types The types of observational data exchanged on the GTS are (a) Surface “instantaneous” (or shortperiod e.g. 10-minute) observations on land and sea (and coastal areas), including data from Voluntary Observing Ships (VOS) and buoys; (b) Upper-air observations including data from aircraft; (c) Climatological data (e.g. daily or monthly summaries); (d) Selected satellite data; and (e) Seismic data (level 1), Tsunami and Other types of data as agreed (including e.g. subsurface oceanographic data). The surface temperature observations from land stations that form the principal focus of this grand challenge, and from sea/coastal stations, are transmitted over the GTS at both the (a) instantaneous and (c) climatological levels, and in a variety of formats. Among the formats still defined by WMO at the climatological level are CLIMAT and CLIMAT SHIP messages 2, which contain among other elements 3 monthly summaries of maximum, minimum, and mean temperature from land and ocean weather stations, respectively. 2. Similarly, WMO uses the CLIMAT TEMP and CLIMAT TEMP SHIP codes for reporting monthly aerological (upper-air) means from land and ocean weather stations.. 3. From WMO (2009d): ‘The reported parameters in CLIMAT (SHIP) Reports from weather stations include monthly mean values for atmospheric pressure (henceforth “pressure”) at station level and reduced to sea level or to an agreed datum level or the geopotential of an agreed standard constant pressure level, air temperature, daily minimum and daily maximum air temperatures, vapour pressure, precipitation, sunshine characteristics at station level and some other parameters.’. 3.
(4) 102 103 104 105 106 107 108 109 110 111 112 113 114 115 116 117 118 119 120 121 122 123 124 125 126 127 128 129 130 131 132 133 134 135 136 137 138 139 140 141 142 143 144 145 146. Unfortunately, the last surviving ocean weather station M (Mike, operated by Norway) now may be permanently closed (Schiermeier 2009). Moreover the actual level of utilization (and archival preservation) of CLIMAT SHIP messages in recent years (or decades) is not known. For the marine domain, in contrast to the handling of data from land stations, higher-resolution data formats are generally used to assemble climatological data, as used for example to construct ICOADS (http://icoads.noaa.gov/). (See Table 1 and further discussion of higher-resolution marine data below.) The dissemination and collection of CLIMAT messages supports monitoring and analysis of local, regional, and global mean patterns of climate change. WMO agreements are in place for the collection and dissemination of monthly CLIMAT bulletins from more than 200 countries and other territories for 2924 stations that comprise the Regional Basic Climatological Network (including Antarctica). This is a number sufficient to provide good regional as well as global coverage, although more stations are needed to provide detailed information required by other applications. A subset of these, 1025 stations that comprise the GCOS Surface Network (GSN), have been designated as the global baseline climate network because of the stations’ lengthy histories and reliable reporting records. Land temperature observations at daily and sub-daily timescales are provided via GTS transmission of Synoptic Bulletins as well as hourly and sub-hourly METAR and SPECI reports. Sub-daily observations available via synoptic reports must be disseminated on 3-hour and 6-hour frequencies; often in practice they are disseminated hourly. Procedures for providing daily summaries in the synoptic reports are determined on a regional basis (WMO 2009c) and are typically for the reporting period midnight to midnight UTC. A total of 4404 stations comprise the Regional Basic Synoptic Network (including Antarctica), but many of these stations do not provide daily climate summaries. In the marine domain, the data collection and dissemination framework for the higher-resolution instantaneous data is quite different than on the land side (see Table 1), partly emerging historically from the very different reporting requirements for moving “stations,” e.g. ships and drifting buoys. Over the GTS for example SHIP and BUOY (FM 13 and FM 18) messages are largely used for input to climate databases (e.g. ICOADS) in the form of individual marine “reports,” i.e. the range of data elements (sea surface and air temperatures, humidity, wind, barometric pressure, clouds, waves, etc.) reported from a ship or buoy at a given time or place. Additionally, delayed-mode VOS logbook marine reports are exchanged internationally under the longstanding (since c. 1963) Marine Climatological Summaries Scheme (MCSS)—this system will be modernized (Woodruff et al. 2010), but still serves an important role through the dissemination of often higher-quality and more complete (paper, or increasingly electronic) logbook data. Among other issues currently confronting the marine community, is the masking of ship call signs on the GTS (and to some extent in delayed-mode data) for commercial and security reasons. This masking can prevent the association of ship reports with platform and instrumental ship metadata that are made available separately, i.e. in WMO (1955) Publication No. 47. 4.
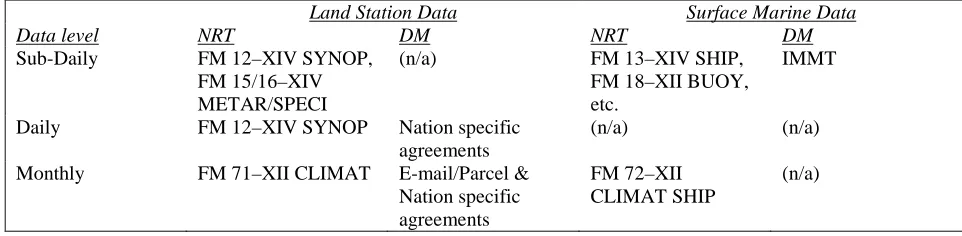
(5) 147 148 149 150 151 152. Table 1. A comparison between the land station and surface marine domains of the formats used (or not presently available, “n/a”) internationally to report meteorological observations at “instantaneous” (or short-period e.g. 10-minute averages) versus climatological daily and monthly summary levels, stratified also between near-real-time (NRT) and delayed-mode (DM) reporting. These present versions of the GTS “FM” formats are documented in WMO (2009c). Data level Sub-Daily. Daily Monthly. 153 154 155 156 157 158 159 160 161 162 163 164 165 166 167 168 169 170 171 172 173 174 175 176 177 178 179 180 181 182 183. Land Station Data NRT DM FM 12–XIV SYNOP, (n/a) FM 15/16–XIV METAR/SPECI FM 12–XIV SYNOP Nation specific agreements FM 71–XII CLIMAT E-mail/Parcel & Nation specific agreements. Surface Marine Data NRT DM FM 13–XIV SHIP, IMMT FM 18–XII BUOY, etc. (n/a) (n/a) FM 72–XII CLIMAT SHIP. (n/a). Design versus Practice While the GTS system has proven to be technologically well designed to be reliable and provide data with the quality and timeliness required of Member nations, its efficacy in practice has proven to be limited by factors external to the technical functioning of the system. The GTS requires detailed catalogues of metadata for land observing stations (‘station lists’) and distribution catalogues (‘routing tables’) that specify where information originates and which Members subscribe to it. These catalogues allow messages to be very terse and compact, increasing the efficiency and speed of the system. While the system functions well if these tables and lists are updated and maintained, the necessary updates are often not made in practice or made only after errors are identified and months of effort needed for correction are spent. When these catalogues are not up-to-date, the dissemination of LS (and other) data is disrupted, preventing data reaching end users. The failure of the NMHSs, RMSCs and RTHs to continually maintain the routing catalogues lowers the overall effectiveness of the GTS. Inconsistencies and gaps in data delivery can also be tracked to other causes. Some nations lack the human or technical resources to provide climate observations on a routine and reliable basis, while even some of the largest and most developed encounter problems occasionally. According to WMO Technical Regulations, CLIMAT reports should be provided not later than the 5th day of the month following the month to which the data refers (WMO 2009d). While the majority of NMCs provide CLIMAT bulletins within this window, each month there are a number of NMCs that disseminate their reports one or more days after the 5th. In some cases NMCs do not have the resources that support transmission of CLIMAT reports over the GTS. Data Monitoring and Assistance To assist nations that cannot transmit data via the GTS, procedures have been established that enable NMCs to provide their data via e-mail or even parcel post. In some cases data collected via these methods are inserted onto the GTS via WMO Commission for Basic Systems (CBS) Lead Centers for GCOS. Procedures also have been established that allow countries to 5.
(6) 184 185 186 187 188 189 190 191 192 193 194 195 196 197 198 199 200 201 202 203 204 205 206 207 208 209 210 211 212 213 214 215 216 217 218 219 220 221 222 223 224 225. automatically submit their CLIMAT messages onto the GTS using e-mail. At least seven countries began using this method in 2009 (Lefebvre 2010). Broader efforts to track and improve data quality from the climatological networks GSN and RBCN and the delivery of data across the GTS are accomplished by two GSN Monitoring Centers (GSN-MCs), the GSN Lead/Archive Center for GCOS at the U.S. NOAA National Climatic Data Center (NCDC), and CBS Lead Centers for GCOS Data for each WMO region. The feedback and facilitation they provide at all levels of the GTS has been instrumental in identifying errors and enabling timely correction and resolution of problems associated with the collection and transmission of CLIMAT bulletins. The GSN-MCs [hosted by Japan Meteorological Agency (JMA) and Deutscher Wetterdienst (DWD)] and the GSN Lead/Archive Center at NCDC also act as CBS Lead Centers for GCOS and work to improve the reception and quality of all CLIMAT messages including but not limited to GSN stations. The Lead Center at DWD has extended monitoring beyond its own region to support the overall health of global CLIMAT transmissions. In 2009, the Center contacted about 40 countries on all continents to acquire missing bulletins or correct errors in GTS bulletins (Lefebvre, 2010). It uses internal quality control processes to identify errors in CLIMAT bulletins such as data transmitted for the wrong month. In some cases, contacts on the part of DWD have not resulted in efforts on the part of member nations to correct the identified problem. This may be due to inadequate resources for addressing the problem on the part of the NMC or the inability of the Lead Center to make contact with the persons best able to ensure the problem is addressed. An up-to-date GCOS focal point list of the WMO World Weather Watch 4 is one essential element for resolving incorrect or missing CLIMAT reports. Training programs conducted by the JMA have aimed at improving the transmission of CLIMAT messages. The JMA invites staff members of some NMHSs to the Group Training Course for Reinforcement of Meteorological Services at JMA. In 2009 this course included training on encoding of CLIMAT reports to staff of the NMHSs of Mongolia, Bhutan, Myanmar, and Cambodia. This resulted in commitments from Myanmar to begin sending CLIMAT reports for five GSN and/or RBCN stations (Umeda 2010). NCDC in its capacity as GSN Lead/Archive Center and CBS Lead Center for GCOS compares CLIMAT messages received via the Washington WMC with other Lead and Monitoring Centers and works to improve the number of CLIMAT messages received at the Archive Center. Recent efforts along with the Australian Bureau of Meteorology identified and corrected problems in a routing catalogue that prevented the transfer of more than 100 CLIMAT reports. The Center also contacts WMO member nations in an effort to improve archive holdings and facilitates the dissemination of data and corrections via e-mail reports. The combination of e-mail and parcel post delivery of CLIMAT messages results in an additional 60 to 80 station reports not available via the GTS (Menne 2010).. 4. http://www.wmo.int/pages/prog/www/ois/rbsn-rbcn/FocalPointsGCOS.doc. 6.
(7) 226. 7.
(8) 227 228 229 230 231 232 233 234 235 236 237. 238 239 240 241 242 243 244 245 246 247 248 249 250 251 252 253 254. Reporting Efficiencies Training programs and intensive monitoring and support to NMCs by CBS Lead Centers for GCOS have proven effective at improving the dissemination of CLIMAT messages over the past several years. Summaries of CLIMAT reporting provided by DWD and JMA showed that compared to 2008, the overall availability of CLIMAT reports for the GSN stations increased slightly reaching up to about 83 % from May to August 2009 (Lefebvre, 2010). Reporting frequency of CLIMAT reports for GSN stations received at the Lead/Archive Center was greatest in North America, Europe, Asia, and Australia. The greatest reporting deficits in 2009 were in Region I as shown in Figure 1 below.. Figure 1. Number of monthly CLIMAT messages received at the Lead/Archive Center at the NOAA National Climatic Data Center during 2009. Though CLIMAT reports should be distributed globally via the GTS, there are differences in the reception rate at the various lead and monitoring centers. Efforts to address these discrepancies have included updates to routing catalogues and direct transfer of CLIMAT reports between some NMHCs and Centers. THE FUTURE Addressing deficiencies in Daily and Instantaneous Data Even though most nations operate one or more land surface observing networks that produce daily summaries of temperature, there is no analog to CLIMAT bulletins on the daily timescale. Consequently, while stations in the RBCN are required to provide monthly climate summaries, NMHSs are not required to report daily climate observations. For this reason daily data are not 8.
(9) 255 256 257 258 259 260 261 262 263 264 265 266 267 268 269 270 271 272 273 274 275 276 277 278 279 280 281 282 283 284 285 286 287 288 289 290 291 292 293 294 295 296 297 298 299. routinely shared and no central repository exists because of the lack of a formal process for sharing data with such temporal resolution. At the level of instantaneous LS data, the situation is even less formalized. Although there is a special “climatological data” code group in synoptic bulletins used for summarizing conditions during the preceding 24 hours, the transmission of daily observations over the GTS remains optional even for the 4404 stations that are part of the Regional Basic Synoptic Network (WMO 2009c). In addition, daily temperature observations from synoptic bulletins are historically incomplete. This is due largely to the lack of a requirement that any station provide daily summaries of maximum and minimum temperature in synoptic reporting and as a result a natural lack of commitment at the national or regional level toward dedicating the resources necessary for consistently providing such reports. Furthermore there is no international program for monitoring the transmission or receipt of daily climate summaries equivalent to that for CLIMAT, no monitoring program for identifying reporting errors, and no program for facilitating corrections to daily observations reported in error. The daily summaries that have been disseminated and collected via the GTS also often suffer from inconsistencies with historical climate records. The inconsistencies result from differences in 24-hour reporting periods between the daily observations provided in synoptic reports with those available in historical archives. Daily observations included in synoptic reports typically cover the period that begins and ends at midnight UTC. This differs from historical climate data for the same station which is often based on a reporting period that ends at local midnight. The discontinuity resulting from the use of daily maximum and minimum temperature from two different 24-hour periods introduces bias to the climate record, complicates analyses and lowers confidence in overall conclusions based on such data. Some of the daily and sub-daily data also have a higher (perceived or real) commercial value to NMSs which limits their willingness to broadly exchange such data. For these and other reasons, at the instantaneous LS data level (from which level in theory more homogeneous climatological products might be computed or replicated; ref. Table 1) the necessary international agreements supporting format standardization and regular international data exchange appear largely nonexistent. As discussed above this situation stands in sharp contrast with the surface marine domain (as however does the reverse lack of standardized exchange of climatological products in that domain, in contrast to the land side). These longstanding contrasts in data (and associated station/platform metadata) handling between the land and marine domains could complicate efforts to harmonize archives (e.g. surface temperature) across the domains. These are all problems that have greatly complicated the development and maintenance of global daily land data sets, and climate monitoring and analysis have been negatively impacted as a result. The IPCC Fourth Assessment Report (Trenberth, 2007) noted that global studies of daily temperature extremes have suffered from a scarcity of data and regions with missing data. As a result the extent to which the scientific community has been able to make strong conclusions regarding observed changes in temperature extremes has been limited. Although many problems remain, efforts have been made to improve global daily data archives in the ensuing years. 9.
(10) 300 301 302 303 304 305 306 307 308 309 310 311 312 313 314 315 316 317 318 319 320 321 322 323 324 325 326 327 328 329 330 331 332 333 334 335 336 337 338 339 340 341 342 343. Some NMCs have established bilateral data sharing agreements with other NMCs to facilitate the collection of daily climate observations. These agreements are most beneficial when they include the transfer of full historical data sets and arrangements for ongoing updates. A 2008 letter by the WMO Secretary-General called upon NMHSs of all WMO member nations to enhance the routine provision of daily and sub-daily data for climate purposes to the WDC-Asheville at NCDC, but the response by NMSs response was limited. However, as a consequence, and as part of efforts to develop and maintain the Global Historical Climatology Network-Daily dataset, the GCOS Archive Center at NOAA NCDC now receives ongoing updates of daily data from seven other WMO Members (Iran, Estonia, Uzbekistan, Estonia, Cyprus, Canada, and Australia).This is a model that could work to improve access to data from other countries in the future. In addition to these updates, the Center has also received copies of the complete daily climate databases from Canada and more recently Australia. As a result, GHCN-Daily soon will contain comprehensive daily climate databases for the USA, Canada and Australia. An extension of similar data sharing arrangements led by a Center in each WMO region could be effective at establishing expansion of global daily historical archives and facilitate ongoing updates of climate quality daily as well as sub-daily observations. Such a program is currently in place at KNMI, making possible the collection of daily data from over 60 countries (see: http://eca.knmi.nl).. The WMO Information System (WIS) Bilateral arrangements such as those discussed above represent information available to WMO Members outside the GTS framework. The GTS is not structured to meet newly evolving requirements for the exchange of data in near real-time. It has a tightly controlled style to meet the safety critical needs of day-to-day operational weather forecasting and is essentially a private communications system connecting WMO Members on a wide area network. It acts like early telegraph and telephone systems, where operators route data messages over dedicated lines using systems dedicated to the WMO. In this manner it is connectivity-oriented instead of data and service oriented. Today WMO Members have other requirements for more ad hoc exchange of data in near real time. Over recent decades there have been efforts to support such ‘request-reply’ traffic, but only recently have mainstream technologies made this a tractable problem. While the use of ‘store and forward’ catalogues of the GTS has made the system robust, it is less flexible in the face of the increasing pace of change. With NMCs resorting to establishing bilateral links outside the GTS data management framework, duplication occurs as information circulated on the GTS is also distributed via bilateral links and the internet. To address these issues, the WMO in 2003 agreed to move to a WMO Information System (WIS) to meet all of its information needs, rather than just those of the World Weather Watch program. With the WIS, the WMO is taking a step beyond managing data messages and moving to an overarching approach based on managing the data and information. At the core of WIS is a comprehensive catalogue that will make data and information easier to find and access, both current and archived. WIS builds on the existing GTS 10.
(11) 344 345 346 347 348 349 350 351 352 353 354 355 356 357 358 359 360 361 362 363 364 365 366 367 368 369 370 371 372 373 374 375 376 377 378 379 380 381. and will provide real and near real-time data exchange, as well as data access and retrieval services. The WIS is designed around a series of catalogues that describe what information and access services exist, what they contain, where they are and how to retrieve the required information. A single NMHS can serve multiple roles within the WIS and functions can be implemented ‘virtually’ with functions being distributed between physically separated and distributed nodes. It supports Discovery, Access, Retrieval and Subscription services using ‘push’ and ‘pull’ mechanisms. The pull mechanism will allow authorized users to make ad hoc requests for data through portals that enable users to gain access from any web browser to search, request, view, or analyze archived data catalogued through WIS. While the WIS is well conceived, and many institutions have committed to becoming a part of it, its long-term effectiveness will be gauged in the coming years as it becomes more firmly established. It should not be viewed as the answer to all problems with the current system. It is designed to capitalize on the current generation of communications technology, but it alone will not resolve many of the problems associated with data exchange via the GTS. Governments and NMHSs will still be required to make the distribution and exchange of climate information a top priority, to dedicate resources to identifying and resolving problems, and to improving the overall quantity and quality of data exchanged. Details on the design and structure of the WIS are provided in Appendix B. Table-Driven Code Forms WMO Members exchange observations and forecasts using standard methods of representing the data. Traditional Alphanumeric Codes (TACs; e.g. FM 13/18 SHIP/BUOY codes as used for marine data) have been used for many decades. They have the advantage of being humanreadable, but are inefficient for transferring large amounts of data and are difficult to adapt to meet changing needs and are not amenable to processing by software. Table-Driven Code Forms (TDCF); principally BUFR (Binary Universal Form for the Representation of meteorological data) and GRIB (GRIdded Binary), but also the less widely known CREX (Character form for the Representation and EXchange of data), are efficient for transferring large amounts of data, are more flexible and were designed specifically to be processed easily and efficiently by software and without entailing expensive software changes. 5 However, there are potential disadvantages with the complex BUFR format in particular. BUFR is generally limited to storage of data in SI units (e.g. temperatures are stored in Kelvin), thus leading to possible questions about the accurate and complete preservation of originally reported. 5. BUFR and GRIB are binary, making them more compact than equivalent character based formats. GRIB is for regularly gridded data, whereas BUFR is better for irregularly distributed point and line based data. CREX is character based, but still table driven, to be used where local telecommunications infrastructure is still character based and possibly unreliable, and there is a requirement for human readability, with minimal, or no, software.. 11.
(12) 382 383 384 385 386 387 388 389 390 391 392 393 394 395 396 397 398 399 400 401 402 403 404 405 406 407 408 409 410 411 412 413 414 415 416 417 418 419 420 421 422 423 424 425. data forms. Moreover variables such as ocean temperature may have more than one BUFR variable assigned, since ocean temperatures can be recorded to 1, 2, or 3 decimal places, each requiring a different number of bits and each requiring a different BUFR designator. Also, because BUFR data are in binary format, they are not human readable. Different computer operating systems often handle binary data in different ways, requiring different encoding and decoding software routines, which makes the creation of identical results more difficult to achieve (JCOMM 2008). In the context of climate studies the consistency and completeness of data are critical considerations. WMO plans to exchange all observations and model data between international centres using Table Driven Formats and to stop the transmission of the TACs, to increase flexibility and reduce software and transmission costs. The Fourteenth World Meteorological Congress (CgXVI) endorsed the plan for the migration and timescale. Although there is a lengthy period during which different data types are migrated, the migration has already started (WMO 2009e). Following the migration, bulletins of TEMP, SYNOP and SHIP observations (for example) will no longer be exchanged—they will be replaced by the equivalent Table Driven Format method of representing the data. However some non-NMHS customers will still require some types of observations and forecasts in human readable traditional formats for the foreseeable future. In the plan, the CLIMAT (SHIP) codes are in Category 1 (Common) and Category 4 (Maritime), respectively. For Category 1, the migration started in November 2005 and should be completed by November 2010, while the migration of Category 4 started in November 2007 and should be completed by 2012. Members of WMO are invited to be ready for the migration to TDCF and implement it as soon as possible. (WMO 2009d) Recommendations Recognizing that (i) there is no analog to CLIMAT bulletins on the daily timescale, (ii) daily data are not routinely shared, (iii) no central repository exists because of the lack of a formal process for sharing data with daily resolution, and (iv) the “climatological data” code group in synoptic bulletins does not support the climate communities need for daily summary observations, establish a formal mechanism for dissemination of daily climate messages or requirement for transmission of daily climate observations with synoptic reports. Recognizing more pronounced issues of the same sort at the basic instantaneous data level, consider as a secondary priority the feasibility (including data exchange policy issues) of adoption of international mechanisms to standardize the exchange of the highest resolution data. Recognizing that a limited number of bilateral arrangements (e.g. US-Australia, US-Canada) have proven effective at improving access and near real-time data sharing of daily and sub-daily data, establish efforts at the WMO regional level to expand bilateral arrangements for sharing of daily and sub-daily data to increase data holdings and foster regular updates of global and regional daily data sets.. 12.
(13) 426 427 428 429 430 431 432 433 434 435 436 437 438 439 440 441 442 443 444 445 446 447 448 449. Recognizing that training programs such as those of the JMA have proven effective at improving NMHS capabilities to provide CLIMAT data, expand training opportunities at the regional and national level to improve the routine and regular dissemination of CLIMAT bulletins from developing nations. Recognizing the success that GCOS Monitoring Centres and CBS Lead Centres for GCOS have had on improving the quality and quantity of CLIMAT reports, continue to support Monitoring of quality and completeness of CLIMAT transmissions and feedback to data providers. Work to garner commitments for enhanced monitoring and feedback related to synoptic bulletins and daily climate summaries. Recognizing the efficiencies and flexibility of Table-Driven Code Forms for transferring large amounts of data, their design for ease and efficiency of processing, as well as their costeffectiveness, encourage and support NMCs conversion of data transmissions to TDCFs, while at the same time ensuring adequate attention to issues of long-term data homogeneity in support of climate research. 6 Recognizing that the GTS is not structured to meet newly evolving requirements for the exchange of data in near real-time, and recognizing the 2003 agreement to move to a WMO Information System (WIS) to meet all of the WMO’s information needs, support adoption of WIS technologies and encourage establishment of GISCs and DCPCs.. 6. Similarly in the marine domain, Woodruff et al. (2010) specifically recommended in this regard: “Ensure that migration to BUFR and other table driven codes does not compromise the quality of climate archives by: (a) preserving all data as originally reported, (b) effective validation of new codes to ensure accurate preservation of reported data, (c) considering the requirement for continuity when developing new codes, and (d) developing standards for ship-to-shore transmission.”. 13.
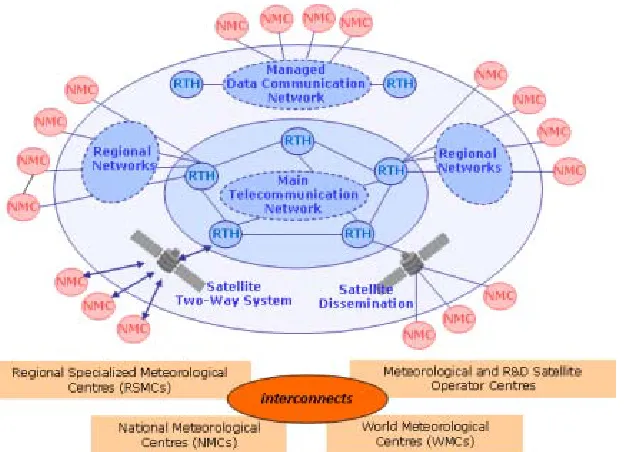
(14) 450 451 452 453 454 455 456 457 458 459 460. 461 462 463 464 465 466 467 468 469 470 471 472 473 474 475 476 477 478. Appendix A. The Global Telecommunication System As shown in Figure A1, the backbone of the GTS is the Main Telecommunication Network (MTN), which comprises three World Meteorological Centers (WMCs; Moscow, Washington, Melbourne) and 15 Regional Telecommunication Hubs (RTHs, e.g. Exeter). National Meteorological Centers (NMCs) and Regional or Specialized Meteorological Centers (RSMCs) connect to the GTS via a RTH or WMC (WMO 2009a). WMO Members maintain National Telecommunication Networks that facilitate the dissemination and collection of data internal to each nation. “Store and forward” catalogues are used to facilitate the flow of information on the network, which has proven to be very robust, although not particularly flexible.. Figure A1. Structure of the Global Telecommunication System. Provided by the World Meteorological Organization (http://www.wmo.int/pages/prog/www/TEM/GTS/index_en.html). GTS Circuits are established via a combination of terrestrial and satellite telecommunication links, and data-communication network services. Circuits are designed to be highly reliable. NMCs are responsible for collecting and disseminating land station (LS) observational data within their own territory or other Member nations according to bilateral agreements. Those responsibilities also extend to handling meteorological and oceanographic data from a variety of other observing platforms—such as aircraft, VOS and moored and drifting buoys—when received by communication centers located within each nation’s area of responsibility. Collection takes place as soon as possible within 15 minutes of the observing station’s nominal observation time. The NMCs and RSMCs provide their “bulletins” (i.e. collections of observations or products) to WMCs or RTHs, which in turn transmit them in the appropriate form on the MTN. WMCs/RTHs are responsible for confirming the proper format of the data messages and for coordinating corrections with the associated NMC before disseminating messages.. 14.
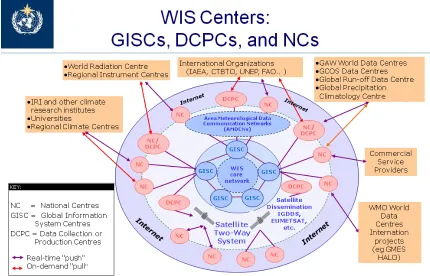
(15) 479 480 481 482 483 484 485 486 487 488 489 490 491 492 493. 494 495 496 497 498 499 500 501 502. Appendix B. The WMO Information System (WIS) The WMO Information Sysem (WIS) is designed around a series of catalogues that describe what information and access services exist, what they contain, where they are and how to retrieve the required information. Synchronised copies of these catalogues, along with at least 24 hours of Resolution 40 Essential data and products for routine global exchange, will reside in Global Information and System Centers (GISCs). These will also collect and disseminate information from and to Data Collection or Production Centres (DCPCs), National Centres (NCs) and other GISCs, as shown in Figure B1. Furthermore, GISCs will support Discovery, Access, Retrieval and Subscription services using ‘push’ and ‘pull’ mechanisms. The pull mechanism will allow authorized users to make ad hoc requests for data. This can be accomplished through WIS Portals, which are designed to standard metadata and interoperable search standards. The portals enable users to gain access from any web browser to search, request, view, or analyze archived data catalogued through WIS.. Figure B1. Implementation of WMO Information System (WIS). In operational terms, WIS encompasses three types of centres: Global Information System Centres (GISCs), Data Collection or Production Centres (DCPCs) and National Centres (NCs). Existing NMHSs become WIS NCs. DCPCs collect, disseminate, add value to, and archive regional or programme-specific data and products. DCPCs maintain catalogues of their holdings and services, and appropriate parts of these catalogues update the comprehensive catalogue of WIS holdings, hosted by the GISCs. GISCs also hold and distribute copies of at least 24 hours of WMO data and products intended for global distribution. 15.
(16) 503 504 505 506 507 508 509 510 511 512 513 514 515 516 517 518 519. The DCPCs essentially serve the role that the Regional Telecommunication Hubs and Global Data Centers serve in the GTS, to collect, disseminate, add value to, and archive regional or program-specific data and products. DCPCs maintain catalogues of their holdings and services, and the catalogues of the DCPCs update the comprehensive catalogue that is hosted by GISCs. The WIS supports interoperability by giving GISCs, DCPCs, and NCs the capabilities of providing data and products directly to users as well as among themselves A single entity such as the UK Met Office can serve multiple roles. In addition to proposing to serve as a combined GISC with Météo-France, there are also plans for the Met Office to serve as a National Centre, and also have multiple DCPCs to cover existing regional and specialized roles: e.g. RTH, Climate Prediction, Regional NWP, Ocean Forecasting and Marine Observations. Both GISCs and DCPCs may be implemented ‘virtually’ with the functions being distributed between physically separated and distributed nodes, giving rise to the name vGISC. National Centres will have the obligation, in conjunction with their GISC, to generate the correct catalog entries for their data and products.. 16.
(17) 520 521 522 523 524 525 526 527 528 529 530 531 532 533 534 535 536 537 538 539 540 541 542 543 544 545 546 547 548 549 550 551 552 553 554 555 556 557 558 559 560 561 562 563. References JCOMM, 2008: JCOMM Data Management Plan. JCOMM Technical Report No. 40, WMO/TDNo. 1426 [29 pp]. http://www.wmo.int/pages/prog/amp/mmop/jcomm_reports.html Lefebvre, C., G. Asmussen, K. Hansen, J. Kallies, and J. Busche, 2010: Summary. In: DWD Activities as CBS Lead Centre for GCOS for the WMO RA VI in the Year 2009. Deutscher Wetterdienst, Business Unit: Climate and Environment, [3 pp.]. http://www.wmo.int/pages/prog/gcos/documents/GCOS-CBSLC%28DWD%292010.pdf Menne, M.J., 2010: Summary. In: NCDC Lead Center Report. NOAA National Climatic Data Center, [9 pp.]. http://www.wmo.int/pages/prog/gcos/documents/GCOSCBSLC%28NCDC%292010.pdf Schiermeier, Q., 2009: Last weather ship faces closure. Nature, 459, 759 (doi:10.1038/459759a). Trenberth, K.E., P.D. Jones, P. Ambenje, R. Bojariu, D. Easterling,, A. Klein Tank, D. Parker, F. Rahimzadeh, J.A. Renwick, M., Rusticucci, B. Soden, and P. Zhai, 2007: Observations: surface and atmospheric climate change. In: Climate Change 2007: The Physical Basis. Contribution of Working Group I to the Fourth Assessment Report of the Intergovernmental Panel on Climate Change [Solomon, S., D. Qin, M. Manning, Z. Chen, M. Marquis, K.B. Averyt, M. Tignor, and H.L. Miller (eds.)]. Cambridge University Press, Cambridge, UK, and New York, pp. 235-335. Umeda, T., 2010: Summary. In: Report of the CBS Lead Centre for GCOS. Japan Meteorological Agency, [1 p.]. http://www.wmo.int/pages/prog/gcos/documents/GCOSCBSLC%28JMA%292010.pdf WMO, 1955: International List of Selected, Supplementary and Auxiliary Ships. WMO–No. 47 (serial publication, recently annual; Eds. prior to 1966 were entitled International List of Selected and Supplementary Ships). WMO, 2009a: Manual on the Global Telecommunication System. Vol. I (Annex III to the Technical Regulations). (WMO-No.386) World Meteorological Organization, various pages. http://www.wmo.int/pages/prog/www/TEM/GTS/ManOnGTS_en.html WMO, 2009b: Resolutions of Congress and the Executive Council, WMO-No. 508, 2009 edition. http://www.wmo.int/pages/governance/policy/documents/508_E.pdf WMO, 2009c: Manual on Codes. Vol. I.1 (Annex II to the Technical Regulations). (WMONo.306) World Meteorological Organization, various pages. http://www.wmo.int/pages/prog/www/WMOCodes.html WMO, 2009d: Handbook on CLIMAT and CLIMAT TEMP Reporting. (WMO/TD-No.1188) World Meteorological Organization, 115 pp. 17.
(18) 564 565 566 567 568 569 570 571 572 573 574 575 576 577 578. http://www.wmo.int/pages/prog/www/OSY/Publications/TD1188/HandbookCLIMATCLIMATTEMP_en.pdf WMO, 2009e: Monitoring of the Migration to TDCF for RBSN stations Period: July 2009 to April 2010. http://www.wmo.int/pages/prog/www/WMOCodes/MigrationTDCF/status/MonitoringMigration 097-104.doc Woodruff, S.D., N. Scott, D.I. Berry, M.A. Bourassa, E. Charpentier, S. Gulev, H. Haar, E.C. Kent, R.W. Reynolds, G. Rosenhagen, M. Rutherford, V. Swail, S.J. Worley, H.-M. Zhang, R. Zöllner, 2010: Surface In situ Datasets for Marine Climatological Applications. In Proceedings of OceanObs'09: Sustained Ocean Observations and Information for Society (Vol. 2), Venice, Italy, 21-25 September 2009, Hall, J., Harrison D.E. & Stammer, D., Eds., ESA Publication WPP-306 (in press) [ http://www.oceanobs09.net/blog/?p=452]. 18.
(19)
Figure

Related documents
97 percent of veterans who are seen by the Veterans Justice Outreach specials access mental health treatment services, and 72 percent of veterans access substance abuse
In a study into the relation between perceptions of the school psychological environment and school-related beliefs, affect and achievement, Roeser, Midgley and Urdan (1996)
Methods based on linear regression provide an easy way to use the information in control variates to improve the efficiency with which certain features of the distributions
The analysis leverages Knowledge Flow Theory to explain how the HTT creates, shares, and harnesses relevant cultural knowledge to improve the competitive performance of the host
Farther to the east (Czech Republic, Western Slovakia, Poland and Eastern Slovakia), the Magura Nappe contacts the Cen- tral Carpathians to the south through a narrow zone of
The current study (1) assessed participants ’ support for SIFs and NSPs, and (2) evaluated several demographic factors (e.g., age, gender, race, education, political ideology,
The rule proposes a performance period of one calendar year (January 1 through December 31) for applicable measures and activities, further proposing to utilize the 2017 performance
