Ocean Circulation
Surface Circulation
– 10% of water involved
– Primary forces are wind, thermal expansion/contraction and density – Secondary factors: Coriolis effect, friction, ocean basin shape, gravity – Generally occur above the pycnocline (zone of rapid density change)
Deep Water Circulation
– Primarily driven by density differences of water – Called Thermohaline circulation
– Driven by Gravity
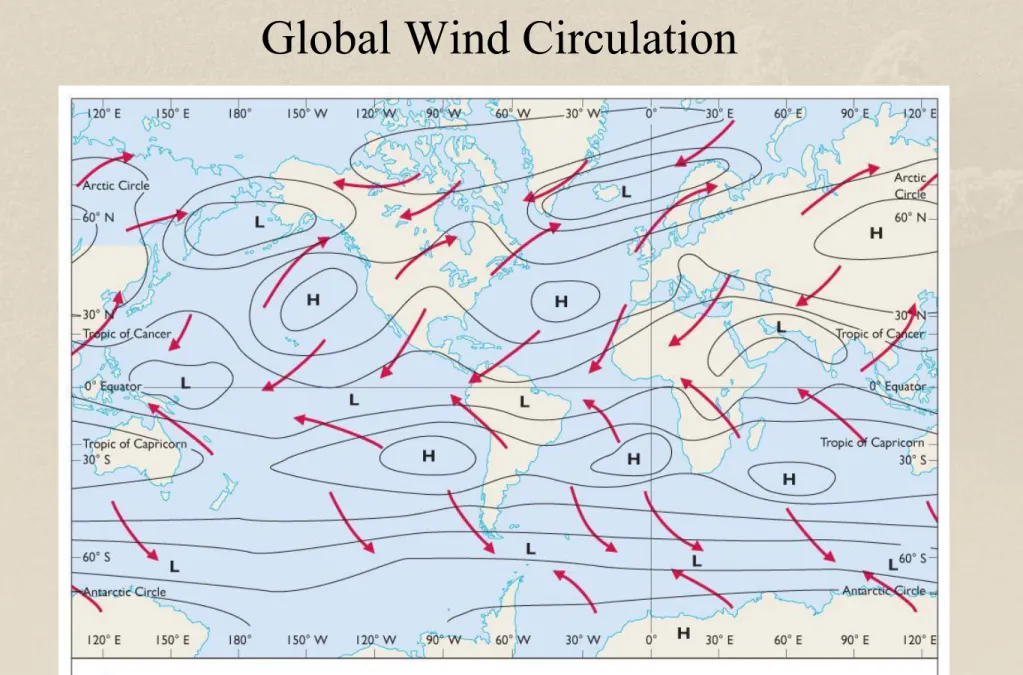
Global Wind Circulation
• Zonal wind flow is wind moving nearly parallel to latitude.
– This is a result of Coriolis deflection.
• A gyre is a circular current caused by: – Westerly-driven ocean currents in the trade
winds
– easterly-driven ocean currents in the Westerlies – deflection of the ocean currents by the
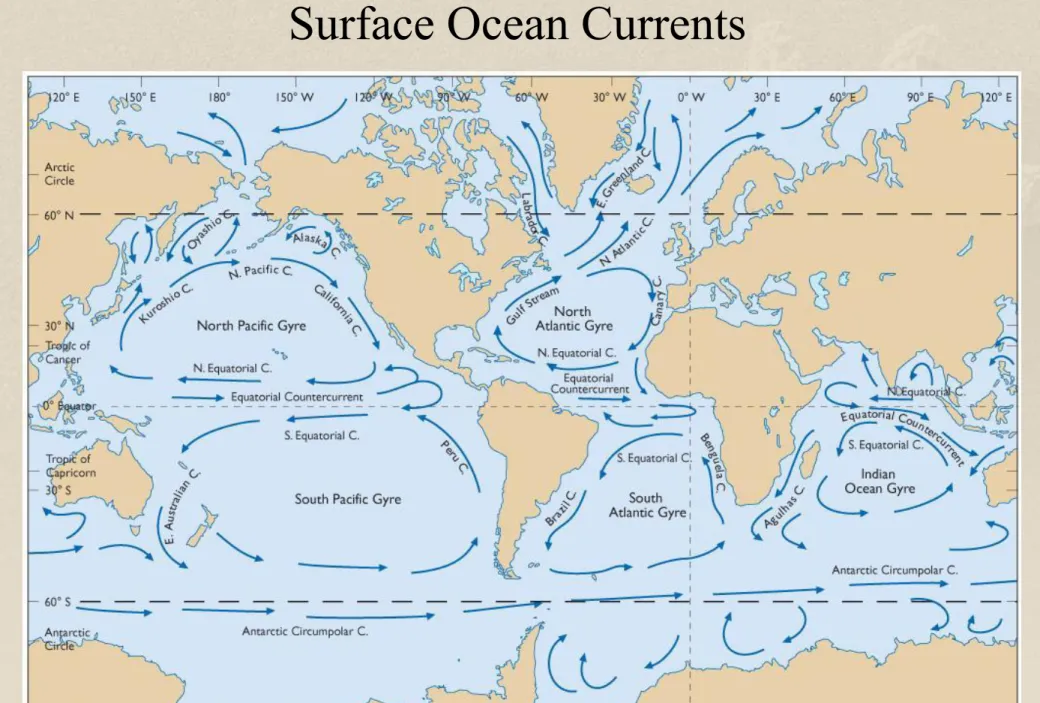
Surface Ocean Currents
Wind-driven currents are produced by the interaction between the wind and the water • As wind moves across the water, air
molecules collide with water molecules.
• When they collide, energy is transferred from the air to the water.
• This energy transfer is inefficient:
• With time, wind-driven surface water
motion extends downward into the water column.
– speed decreases
– direction changes because of Coriolis deflection
• Eckman Spiral is the pattern caused by
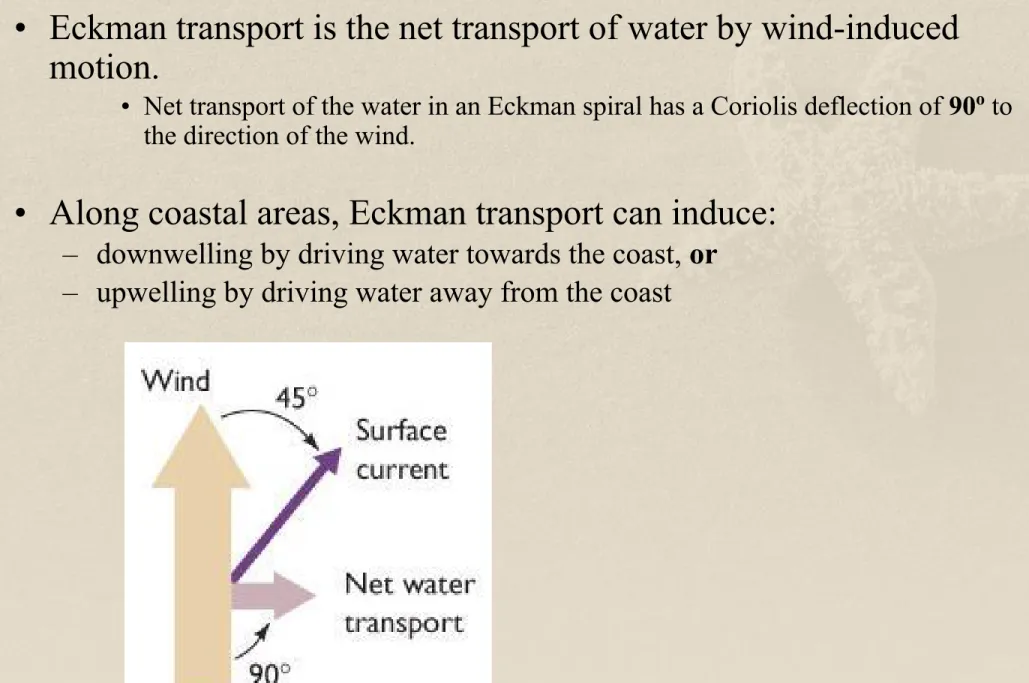
• Eckman transport is the net transport of water by wind-induced motion.
• Net transport of the water in an Eckman spiral has a Coriolis deflection of 90o to the direction of the wind.
• Along coastal areas, Eckman transport can induce:
– downwelling by driving water towards the coast, or
– upwelling by driving water away from the coast
Western Intensification
The wind and Coriolis Effect piles up water against the western continental boundaries.
This creates a mound…and sets up Geostrophic Circulation
Currents appear to move in the direction of the wind…but, they do this because of Geostrophic
Image derived from data obtained by the Topex/Poseidon
satellite. The line indicates a “hill”; it is about 2 meters high…but, this establishes a pressure gradient. Red is the highest, green/blue the lowest.
• The current flow pattern in gyres is asymmetrical:
– narrow, deep and swift currents along the basin’s western edge
– broad, shallow slower currents along the basin’s eastern edge
Geostrophic Circulation
1. Mound of water = pressure gradient
2.Gravity Pulls water downhill
3.As water flows down, picks up speed.
4.Coriolis deflects water direction to horizontal direction
5.When Coriolis Effect = gravity down force, flow is Geostrophic
Net flow appears to be parallel to the direction of wind in horizontal
Geostrophic Currents
Figure 6-9
(b) Effect of pressure gradient (a) Stacking of water in center of ocean
Geostrophic flow allows currents to flow long distances with no apparent Coriolis deflection. • Coriolis effect deflects water into the center of the
gyres, forming a low mound of water.
• As height of the mound increases, the pressure gradient steepens pushing the water outward to level the mound.
• When the pressure gradient equals Coriolis
deflection, the current flows parallel to the wind around the mound.
• The sea surface is further warped into broad mounds
and depressions with a relief of about one meter as a result of flows in gyres.
• Mounds on the ocean’s surface are caused by
converging currents.
• Depressions on the ocean’s surface are caused by
diverging currents.
• The flowing water is deflected by the Coriolis effect.
• Western boundary currents, such as the Gulf Stream, form a meandering boundary.
• These boundaries separate coastal waters from warmer waters in the gyre’s center.
• Meanders can be cut off to form warm-core
Gulf Stream Meanders and Rings
• Thermohaline circulation is: – a density driven flow of water
– generated by differences in salinity or temperature
• Water at the surface is exposed to changes in:
• Salinity and temperature vary little once water sinks and becomes isolated from the atmosphere.
• Based upon depth, surface water masses can be broadly classified as:
– Central waters (from 0 to 1 km)
– Intermediate waters (from 1 to 2 km)
• Most deep and bottom water originate at the surface where cooling and increased salinity raise their density until they sink.
• Ocean basins interconnect and exchange water with each other and with the surface.
• The major thermohaline currents appear to flow mainly equatorward. This is because :
– they originate in the polar regions
– their outward flow is confined between the continents
• Warmer water (>10oC) is confined between 45o north and south latitude.
• Poleward of 45o, density of water increases because of:
– declining temperature
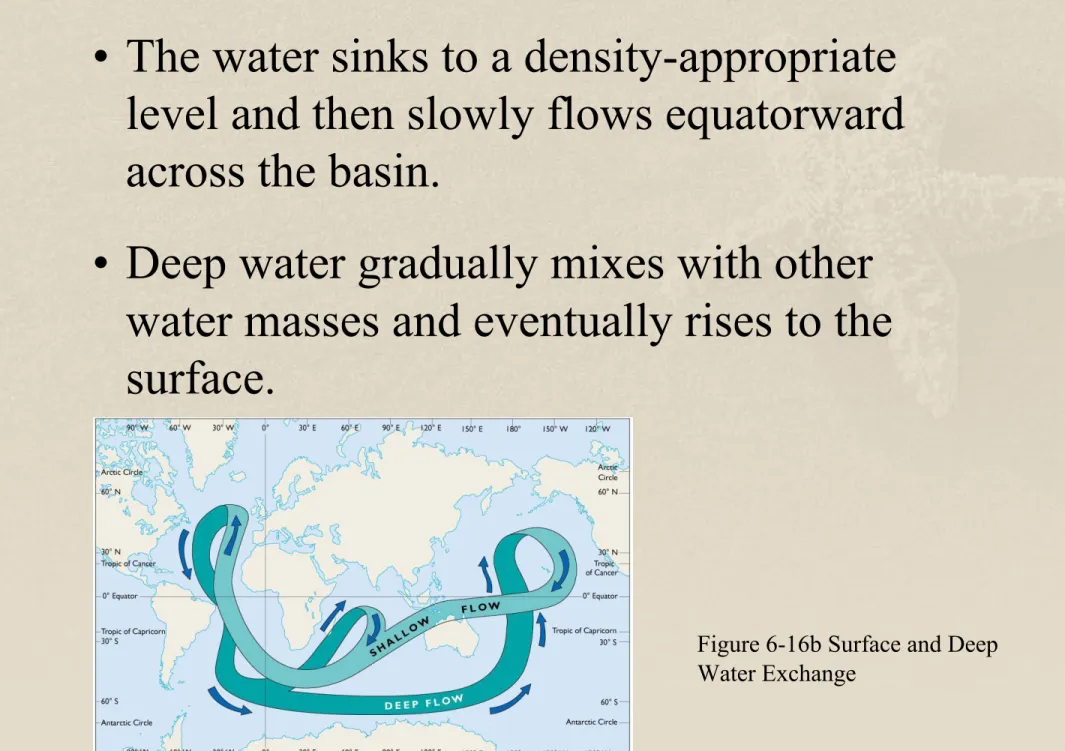
• The water sinks to a density-appropriate level and then slowly flows equatorward across the basin.
• Deep water gradually mixes with other water masses and eventually rises to the surface.
• The Atlantic Ocean has the most complex ocean stratification containing the following layers:
– Antarctic Bottom Water – Antarctic Deep Water
– North Atlantic Deep Water – Arctic Intermediate Water
– Mediterranean Intermediate Water
• The Pacific Ocean:
– has a less complex stratification than the North Atlantic
– is weakly layered
– displays sluggish circulation
• The Indian Ocean has the simplest stratification consisting of:
– Common Water
• Most seas are:
– indentations into continents
– partially isolated from the ocean
• In the Mediterranean Sea:
– Atlantic Ocean water flows in through the Straits of Gibraltar at the surface
– Warm, highly saline Mediterranean Sea water flows out through the Straits at the bottom
• In the Black Sea:
– The surface water is brackish because of high levels of precipitation and river inflow
– The bottom water is anoxic
Water Flow in Semienclosed Seaways
There are two principle ways to measure currents:
• Eulerian method employs current meters fixed to the sea bottom.
• Langrangian method employs: • Drifters
• Drogues • Floats.
– These are set loose at the sea surface or at
predetermined depths and tracked acoustically.
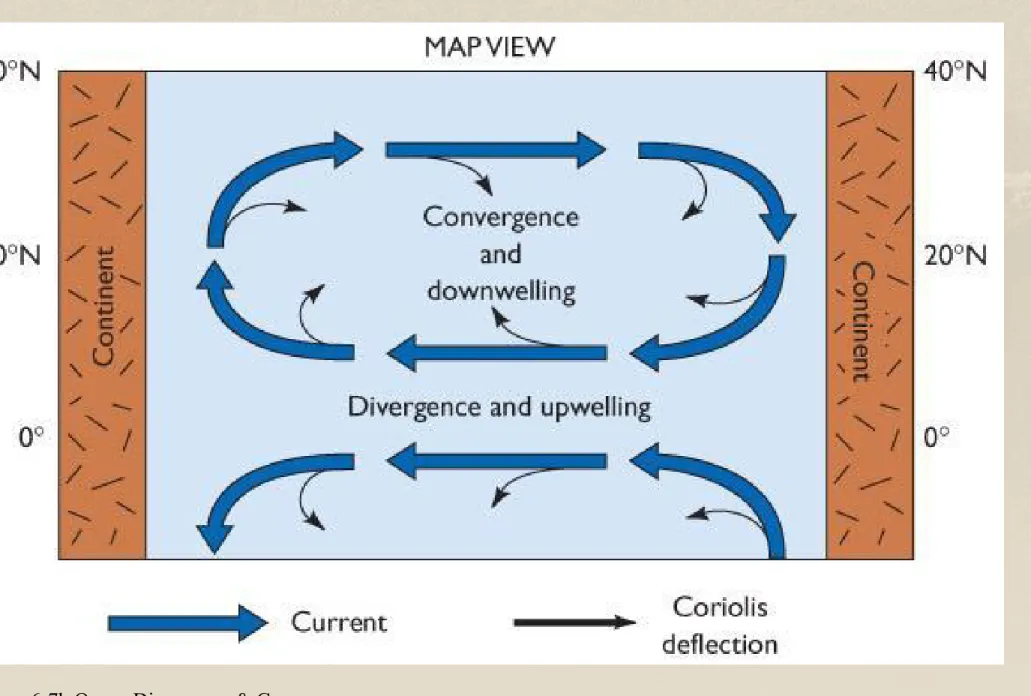
Convergence & Divergence of Water Currents in the Northern Hemisphere
• The geostrophic mound is deflected to the western part of the ocean basin because of the eastward rotation of the Earth on its
axis.
• The Sargasso Sea is a large lens of warm water:
– encircled by the North Atlantic gyre
• Langmuir circulation is a complex horizontal
helical (spiral) motion that extends parallel to the wind.
• Adjacent helices rotate in opposite directions.
– This creates alternating zones of convergence and
divergence.
• Material floating on the surface becomes concentrated in the zones of convergence.
Langmuir Cells