Study on leaf area index and leaf area duration of growth
analytical parameters in Wheat, Barley, and Oat
Deepika Verma
1, A.S. Gontia
1, Amit Jha
2*and Anita Deshmukh
3 1Department of Plant Physiology, JNKVV, Jabalpur, India2Department of Agronomy, JNKVV, Jabalpur, India 3Department of Extension, Dr. PDKV, Akola, India *Corresponding author: [email protected]
Paper No. 509 Received: 14-3-2016 Accepted: 18-9-2016
Abstract
An experiment were conducted in rabi season during 2012-2013 and 2013-2014 to find out the effect of cereal crops (Wheat, Oat, Barley) and cutting schedule on forage and grain yield. The study revealed the maximum chlorophyll accumulation in Barley and wheat during the initial stage at 95 DAS and wheat and barley during the reproductive stage at 30 DAS. Cutting at 50 DAS is proved beneficial on chlorophyll accumulation. Photosynthetic rate was maximum in wheat at 90 DAS. However cutting did not affect photosynthesis rate stomatal conductance and transpiration rate. Barley gave maximum fodder yield (fresh/day). Cutting at 50 DAS was beneficial in producing maximum forage yield without sacrificing grain yield of cereal crops.
Highlight
• Barely recorded the average maximum LAI and LAD in crops whereas cutting at 50 DAS among cutting management systems found maximum LAI and LAD.
Keywords: Wheat, Oat, Barleyleaf area index and leaf area duration Citation: IJAEB: 9(5): 827-831, October 2016
DOI: 10.5958/2230-732X.2016.00106.6
©2016 New Delhi Publishers. All rights reserved
Wheat (Triticumaestivum), Oat (Avena sativa L.) and Barley (Hordeumvulgare L.) are the cereal crops of the world in general and India in particular. India ranks second in wheat, fifth in oat, fourth in barley. Wheat is the most important staple food grain in India (70 million tons per year). Owing to versatile ecological adaptability barley is the second largest producing crop cereal crop of the winter season in India. Oat is mainly used such a fodder crop in the world as compared to food grain crop. In the recent years, it has been observed that because of severe drought in the drier of northern plains (Rajasthan, Southern Haryana, Western U.P. and Madhya Pradesh), there is an acute shortage of green fodder in the months of November to January. Barley can be utilize as a source of green fodder under such situations. The crop can be given one cut at definite
time after sowing for green fodder and regeneration crop may be utilized for grain purpose. Oats (Avena sativa L.) rank fifth in terms of regarding wordiness production of cereals.
They are also widely used as a companion crop for under-seeding of forage legumes The average green yield of local cultivars (tall with very narrow leaves and thin stems, hence, not responsive to nitrogenous fertilizers due to lodging) under rainfed conditions is 20 tons/ha , which is very low and insufficient to provide even maintenance rations for the numbers of live stock kept. In winter farmers have only dried summer grass or dry stalks of summer cereals to supplement the small amount of forage grown and have to purchase costly fodder transported in large quantities from distant irrigated tracts.
et al.
In contrast to local landraces, improved oats grow very fast, can be cut earlier and have considerable potential to provide feed during deficit periods and low temperatures. Generally, Farmers harvest these fodders at 50 percent flowering, or at a later stage to get maximum green yield with a consequent loss in quality.
The productivity of a crop stand depends on its capacity of photosynthesis, photosynthetic area and the utilization of photosynthetic active radiation within the crop canopy. In graminaceous crops, the grain yield is a product of grain weight per ear and number of ear per unit area.
Chlorophyll is vital for photosynthesis, which allows plants to absorb energy from light. Chlorophyll content is an index of organic matter production and plant growth. The increased photosynthesis has linked to increased chlorophyll content in plants. As a result, chlorophyll content is a measurement of physiological activities in plants. Abiotic stress
is major factor around the world in limiting plant growth and productivity. Exposure of plants to a stressful environment during various developmental stages appears to induce various physiological and developmental changes.
Indian dairy industry is facing a lot of shortage of green forage during winter and summer seasons especially in terms of cereal forage. Hence the present experiment was conducted to find out suitable cereal crop for rabi season by cutting existing crop once and then crop grown for food grain production without reducing food grain productivity. Physiological traits like chlorophyll index, photosynthetic rate, stomatal conductance
and transpiration rate were used as parameters to
judge the suitability of cereal crops for fodder and grain production with reference to central India.
Materils and Methods
The present investigation was carried out at the experimental field of All India Co-ordinated Research Project on forage crops, Live Stock Farm, Department of Agronomy, College of Agriculture, JNKVV, Jabalpur (M.P.) during the rabi season
2012-13 in a Spilt Plot Design (SPD), replicated thrice.The experimental material consisted of 3 cereal crops viz.; (VL829), Oat (RD2552), Barley (JO1) as main plot treatments and 4 cutting dates i.e. no cutting wheat, single cutting at 50 days after sowing (DAS),
single cutting 60 (DAS) and single cutting at 70 (DAS) respectively as sub -plot treatment. Growth parameters studied were leaf area index (LAI) at 45, 60, 75, 90 and 105 DAS), and leaf area duration at 45, 60, 75, 90 and 105 DAS), the leaf area index was determined as per specifications of Gardner et al. (1985)and LAD expresses the magnitude and persistence of leaf area of leafiness during the period of crop growth. It reflects the extent or seasonal integral of light interception and correlates with yield. Fischer’s method of analysis of variance was applied for the analysis of the data and interperation of results as suggested by Panse and Sukhatme (1967). The level of significance used in F and t test was P=0.05 critical difference (CD) values were calculated at 5 per cent probability level, wherever F test was significant.
Results and Discussion
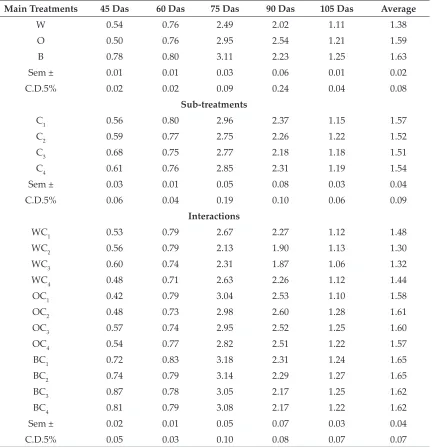
Leaf area indexThe results that barely (0.78) had the significant maximum LAI. Main treatments oat (0.50) showed the significant minimum. Among sub treatment C3 (0.68) significant superseded other sub treatment for the same trait C1 had the lowest (0.56). In interaction, BC3 (0.87) and BC4 (0.81) registered significant more LAI over rest of the interaction. The significant lowest was recorded in OC1 (0.42) at the 45 days and at 60 days the result showed that barely showed that barely (0.80) significantly dominated other for LAI. Oat registered the lowest (0.76) magnitude among main treatment. Among sub treatment C1 (0.80) and C2 (0.77) though were at par between them but significant supersede other sub treatment for LAI C3 indicated the lowest (0.75) LAI. In interaction, BC1 (0.83) showed significant higher LIE over rest of the interaction. WC4 (0.71) was associated with the lowest magnitude for this character.
Table 1: Leaf area index of various treatments and interactions at different growth periods
Main Treatments 45 Das 60 Das 75 Das 90 Das 105 Das Average
W 0.54 0.76 2.49 2.02 1.11 1.38
O 0.50 0.76 2.95 2.54 1.21 1.59
B 0.78 0.80 3.11 2.23 1.25 1.63
Sem ± 0.01 0.01 0.03 0.06 0.01 0.02
C.D.5% 0.02 0.02 0.09 0.24 0.04 0.08
Sub-treatments
C1 0.56 0.80 2.96 2.37 1.15 1.57
C2 0.59 0.77 2.75 2.26 1.22 1.52
C3 0.68 0.75 2.77 2.18 1.18 1.51
C4 0.61 0.76 2.85 2.31 1.19 1.54
Sem ± 0.03 0.01 0.05 0.08 0.03 0.04
C.D.5% 0.06 0.04 0.19 0.10 0.06 0.09
Interactions
WC1 0.53 0.79 2.67 2.27 1.12 1.48
WC2 0.56 0.79 2.13 1.90 1.13 1.30
WC3 0.60 0.74 2.31 1.87 1.06 1.32
WC4 0.48 0.71 2.63 2.26 1.12 1.44
OC1 0.42 0.79 3.04 2.53 1.10 1.58
OC2 0.48 0.73 2.98 2.60 1.28 1.61
OC3 0.57 0.74 2.95 2.52 1.25 1.60
OC4 0.54 0.77 2.82 2.51 1.22 1.57
BC1 0.72 0.83 3.18 2.31 1.24 1.65
BC2 0.74 0.79 3.14 2.29 1.27 1.65
BC3 0.87 0.78 3.05 2.17 1.25 1.62
BC4 0.81 0.79 3.08 2.17 1.22 1.62
Sem ± 0.02 0.01 0.05 0.07 0.03 0.04
C.D.5% 0.05 0.03 0.10 0.08 0.07 0.07
Table 2: Leaf area duration (cm2 days) in different and interactions at successive growth intervals
Main Treatments 45 Das 60 Das 75 Das 90 Das 105 Das Average
W 576.77 1070.35 2659.72 1967.23 737.95 1402.40
O 609.54 1118.13 2970.75 2212.38 738.66 1529.89
B 708.80 1194.97 3587.47 2370.75 813.74 1735.14
Sem ± 7.35 28.70 40.70 55.08 3.61 27.09
C.D.5% 22.71 26.06 137.77 205.60 11.67 80.76
Sub-treatments
C1 598.40 1159.00 3230.41 2284.14 799.92 1614.37
C2 632.34 1142.17 2963.29 2154.03 765.75 1531.52
C3 678.79 1087.00 2976.21 2089.85 736.34 1513.64
et al.
other for LAI. Wheat registered the lowest (2.02) magnitude among main treatments. Among sub treatment C1 (2.37) and C4 (2.31) through were at par between them but significant superseded other sub treatment for LAI. C3 indicated lowest (2.18). In interaction, OC2 (2.60) had significant more LAI over rest of the interaction. Though OC1 (2.53) lagged behind the former but showed significant superiority over rest of the interaction except OC3 which was at par. The lowest value (1.87) was noted in WC3.
The result revealed that the barely (1.25) possessed the higher LAI over rest of the main treatment. Wheat registered the lowest (1.11). Among sub treatment C2 (1.22) supersede other sub treatment for the same trait. The lowest magnitude was noted in C1 (1.15). In interaction, OC2 (1.28) had significant more LAI over rest of the interactions. Though BC2 (1.27) lagged behind the former but showed significant supersede over rest of the interactions except OC3 and BC3 which were at par, WC3 had the lowest (1.06) at the 105 days.
Leaf area duration
The result exhibited that the barely (708.80) and wheat 576.77 possessed the maximum and minimum values for LAD. Among sub treatments C (678.79) and C (632.34) possessed higher LAD
Sem ± 21.18 47.51 102.44 73.47 15.65 52.05
C.D.5% 48.11 53.26 233.73 124.37 36.03 99.10
Interactions
WC1 571.74 1082.50 2907.88 2143.65 781.25 1497.40
WC2 616.79 1081.84 2313.88 1788.51 771.56 1314.51
WC3 617.61 1049.21 2486.75 1814.68 704.83 1334.61
WC4 500.95 1067.84 2930.38 2122.10 694.15 1463.08
OC1 567.80 1137.36 3030.38 2229.89 772.92 1547.67
OC2 602.22 1147.24 2981.00 2263.81 722.13 1543.28
OC3 638.69 1029.96 2979.13 2157.19 703.68 1501.73
OC4 629.46 1157.95 2892.50 2198.64 755.93 1526.90
BC1 655.65 1257.13 3752.99 2478.88 845.59 1798.04
BC2 678.02 1197.44 3595.00 2409.76 803.58 1736.76
BC3 780.08 1181.84 3462.75 2297.69 800.51 1704.57
BC4 721.43 1143.48 3539.13 2296.69 805.28 1701.20
Sem ± 18.35 41.15 88.71 63.63 13.55 45.08
C.D.5% 40.85 NS 198.47 105.61 30.60 93.88
over other sub treatment. C1 (598.40) recorded the lowest value for this character though was at par with C2. In interaction, BC3 (780.08) and BC4 (721.43) registered significant more biological yield over rest of interactions. The lowest value was recorded in WC4 (500.95) at 45 days and the result indicated at 60 days that the barely (1194.97) wheat (1070.35) had significant maximum and minimum values for LAD. Among sub treatment C1 (1159.00) supersede other sub treatment for the same character. The lowest magnitude was noted in C3 (1087.00). In interaction BC1 (1257.13) and OC1 (1029.96) possessed the maximum and minimum values for LAD.
recorded an average higher (1735.14 cm2 days) LAD
followed by Oat (1529.89 cm2 days). On the other
hand C1 (1614.37 cm2 days) in sub treatments and
combinations of Barely with all sub-treatments recorded the higher magnitudes for this character.
References
Aggarwal, P.K. and Sinha, S.K. 1984. Differences in water relations and physiological characteristics in leaves of wheat associated with leaf position on the plant. Plant Physiology74: 1041-1045.
Bhilare, R.L. 2009. Physiological basis of yield variation in oat in relation to nitrogen levels under different cutting management. Journal of Maharashtra Agricultural Universities34(2): 164-167.
Chau, N.M. and Deshmukh, P.S. 1989. Net assimilation rate during grain filling and grain yield in relation to nitrogen application. New Botanist 16: 261-266. Delgado, E. and Medrano, H. 1991. Field performance and
leaf characteristic of Nicotianatabaccum genotypes selected by low CO2 survival Photosynthetica. Indian Journal Plant Physiology25: 313-322.
Dingkuhn, M, HF, Sehnier, S.K., Datta De, Dorffing, K. and Javella, C. 1991. Relationship between ripening phase productivity and crop duration, canopy photosynthesis and senescence in transplanted and direct-seeded lowland rice. Field Crops Research26: 327-345.
Khaifa, M.A. 1993. Effect of nitrogen on leaf area index, leaf area duration, net assimilation rate and yield of wheat. Agronomy Journal65: 253-256.
Kumar Naresh, S. and Singh, C.P. 1999. Yield and yield components to maize (Zea maysl): Physiological analysis on seasonal variations. Indian Journal of Plant Physiology4(2): 90-94.
Singh, S., Aggarwal, P.K. and Kumar, S. 2006. Physiological analysis of growth and productivity in wheat cultivars. Indian Journal of Plant Physiology 11(1): 57-62.
Timmannavar, S.R. and Patil, B.C. 2000. Photosynthesis, light interception and seed cotton yield of different cotton species under rain fed conditions. Indian Journal of Plant Physiology5(3): 236-239.
Weber, C.R., Shibles, R.M. and Byth, D.E. 1966. Effect of plant population and row spacing in soybean development and production. Agronomy Journal58: 99-102.
the lowest. In interaction BC1 (2478.88) at par with BC2 (2409.76) had significant more LAD other rest of the interaction. The value was found in WC (1788.51) and at 105 days result showed that the barely (813.74) dominated others for LAD. Wheat registered the lowest (737.95) magnitude among main treatments. Among sub-treatment, C1 (799.92) superseded other sub-treatment for the same trait. The lowest magnitude was noted in WC4 (964.15). In interaction, BC1 (845.59) registered significant more LAD over rest of the interactions. The lowest value (694.15) was recorded in WC4.
The present study showed that the LAD was found
to increase in magnitudes in all treatments and
interactions with the attainment of age till 75 DAS, afterwards it reduced in subsequent growth period which was due to reduction in the magnitude of LAI as a result of drying and senescence of leaf foliage and transport of food material from the source to the utilization sinks. Among main treatments Barley recorded an average higher (1735.14) LAD followed by oat (1529.89). On the other hand C1 (1614.37) in sub treatments and treatment combinations of barley with all sub treatments recorded the highest magnitudes for this trait.
Conclusion
The leaf area index (LAI) had an increasing trend with the advancement of crop age till 75 DAS in all treatment and interactions, after that, it declined during the successive growth period. Barely recorded the average maximum (0.63) LAI in crops whereas C1 (1.57) among cutting management systems and OC3 (1.60), BC1 and BC2 (1.65) in interactions recorded an average higher performance for LAI, respectively.