R E S E A R C H A R T I C L E
Open Access
Head to head comparison of the
propensity score and the high-dimensional
propensity score matching methods
Jason R. Guertin
1,2, Elham Rahme
3,4, Colin R. Dormuth
5and Jacques LeLorier
6*Abstract
Background:Comparative performance of the traditional propensity score (PS) and high-dimensional propensity score (hdPS) methods in the adjustment for confounding by indication remains unclear. We aimed to identify which method provided the best adjustment for confounding by indication within the context of the risk of diabetes among patients exposed to moderate versus high potency statins.
Method:A cohort of diabetes-free incident statins users was identified from the Quebec’s publicly funded medico-administrative database (Full Cohort). We created two matched sub-cohorts by matching one patient initiated on a lower potency to one patient initiated on a high potency either on patients’PS or hdPS. Both methods’performance were compared by means of the absolute standardized differences (ASDD) regarding relevant characteristics and by means of the obtained measures of association.
Results:Eight out of the 18 examined characteristics were shown to be unbalanced within theFull Cohort. Although matching on either method achieved balance within all examined characteristic, matching on patients’hdPS created the most balanced sub-cohort. Measures of associations and confidence intervals obtained within the two matched sub-cohorts overlapped.
Conclusion:Although ASDD suggest better matching with hdPS than with PS, measures of association were almost identical when adjusted for either method. Use of the hdPS method in adjusting for confounding by indication within future studies should be recommended due to its ability to identify confounding variables which may be unknown to the investigators.
Keywords:Confounding by indication, Propensity scores, High-dimensional propensity scores
Background
Observational studies provide real world information on drug use and their potential effect on health outcomes but are prone to confounding by indication [1–4]. The traditional propensity score (PS) method is often used to control for confounding by indication. It represents“the conditional probability of assignment to a particular treat-ment given a vector of observed covariates”and is gener-ally obtained thanks to a logistic regression model [5].
The high-dimensional propensity score (hdPS) method has recently been proposed and has been rapidly and
widely adopted to address confounding by indication [6, 7]. Unlike the PS method which is limited to investigator-specified covariates; the hdPS method also uses a computerized algorithm to select a large number of potential confounders contained within the exam-ined database [5, 7].
It is of interest to compare the performance of these two methods in controlling for confounding by indica-tion to inform the design of future observaindica-tional studies. Performance of both methods may be compared using two distinct approaches, 1) by examining the balance achieved on key potential confounders between sub-cohorts matched on these two scores [4, 8–11], and 2) by comparing the measures of associations obtained
* Correspondence:[email protected]
6Pharmacoeconomic and Pharmacoepidemiology unit, Research Center of the Centre hospitalier de l’Université de Montréal, Pavillon S, 850 St-Denis, 3e étage, Montreal, QC, Canada
Full list of author information is available at the end of the article
from the matched sub-cohorts to a gold standard com-parator [7, 12–14].
Recently, results of a meta-analysis of randomized controlled trials (RCT) have found that exposure to higher statin doses might be associated with higher risks of diabetes (Odds ratio [OR] =1.12 [95 % confidence in-tervals (CI) 1.04–1.22]) [15]. Although results obtained from observational studies have been conflicting [16], four out of five published studies found a small in-creased but statistically significant dose-dependent rela-tionship [17–20]. However, it is possible that in those observational studies, patients at higher risk of diabetes were more likely to be initiated on higher statins doses: a classic example of confounding by indication offering an excellent opportunity to compare the relative per-formance of these two scores. In this study, we aim to compare the performance of the PS and hdPS methods in adjusting for confounding by indication using the two approaches defined above.
Methods
Data sources
This study was performed using medico-administrative databases from the province of Quebec, Canada. Quebec is the second most populated province in Canada, with more than 8 million inhabitants [21]. A unique identifi-cation number is assigned to every individual, and all diagnoses and all health services provided are systemat-ically recorded within the Régie de l’assurance maladie du Québec (RAMQ) databases. Pharmaceutical claims are also recorded but only for residents covered by the RAMQ public drug insurance plan. Information was ob-tained from the Quebec physician’s service and claims databases (i.e. RAMQ databases) and the Quebec hospi-talisation databases (i.e., Maintenance et Exploitation des Données pour l’Étude de la Clientèle Hospitalière [MED-ECHO] databases), which have previously been validated [22–25]. For this study we used three RAMQ databases (i.e., the Demographic, Medical Services and Claims and Pharmaceutical databases) and three MED-ECHO databases (i.e. the Hospitalisation Descriptions, Diagnoses and Intervention databases). Patient records were linked across all databases by use of the unique identification number. The identification numbers were encrypted to protect patient confidentiality. Access to data was granted by the Commission d’accès à l’information and the protocol was approved by the Centre hospitalier de l’Université de Montréalethics’committee.
Full Cohort
RAMQ provided us with a cohort of 800,551 incident statin users; the date of the first statin dispensation was defined as the cohort entry date. Patients were consid-ered to be incident statin users if they did not have a
claim for a statin dispensation in the year prior to the cohort entry date. Eligible patients had: 1) to have been newly initiated on either simvastatin, lovastatin, prava-statin, fluvaprava-statin, atorvastatin or rosuvastatin between January 1st1998 and December 31st2010, 2) to be cov-ered by the RAMQ public drug insurance plan for at least a year prior to the cohort entry date and 3) to be at least 40 years of age at the cohort entry date. We ex-cluded every patient who, in the year prior or on the cohort entry date: 1) received any other cholesterol low-ering drug dispensation (including niacin, cerivastatin or a combination statin drug); 2) received a dispensation for drugs used in the treatment of diabetes (WHO ATC A10) [26]; 3) received a diagnosis of diabetes (ICD-9 code: 250.x; ICD-10 codes: E10.x – E14.x); 4) were ad-mitted in a long-term care facility or 5) received >1 sta-tin dispensation on the cohort entry date. Patients who met both inclusion and exclusion criteria were entered within theFull Cohort.
Exposure status
Patients were categorized into two categories based on the dose and relative potency of the first statin dispensa-tion they received [18, 27]. Patients whose first statin dispensation was for a daily dose of≥10 mg of rosuvas-tatin, ≥20 mg of atorvastatin or ≥40 mg of simvastatin formed the high potency group and remaining patients formed the lower potency group.
Outcome status
Every patient who received either a dispensation of a drug used in the treatment of diabetes (WHO ATC A10) or a diagnosis of diabetes (ICD-9 code: 250.x; ICD-10 codes: E10.x – E14.x) within the 2 years following the cohort entry date was defined as a case, all other pa-tients were considered to be diabetes-free.
Propensity score method
vascular disease (PVD), congestive heart failure, coron-ary artery bypass graft, and percutaneous coroncoron-ary intervention (PCI), all in the year prior to the cohort entry date).
Following the selection of the PS model, patients’ PS were assessed for all patients included within the Full Cohort. Trimming was performed and patients located within non-overlapping regions of the PS distribution were excluded from the analysis, all other patients were eligible for inclusion within theMatched PS Sub-Cohort [28]. Lower potency controls were found for patients in the high potency group using a greedy, nearest neighbor 1:1 matching algorithm. Matching occurred if the differ-ence in the logit of PS between nearest neighbors was within a caliper width equal to 0.2 times the standard deviation (SD) of the logit of the PS [29]. Patients se-lected by the matching algorithm were included within theMatched PS Sub-Cohort.
High-dimensional propensity score method
hdPS were estimated for all patients included in theFull Cohort[7]. Detailed description of the hdPS method can be found elsewhere [7]. Briefly, the construction of the hdPS model involves two processes, 1) investigators se-lect covariates to be forced within the hdPS model (simi-lar to what is done within an investigator-specified PS model) and 2) the hdPS algorithm selects an additional list of covariates measured within the selected data di-mensions based on their multiplicative bias assessment which is then also included within the final hdPS model. Within this study, estimation of patients’ hdPS were conducted using the default setting of the SAS hdPS macro v.1 (i.e., top 200 most prevalent variables per data dimensions, top 500 binary empirical covariates based on multiplicative bias assessment).
We structured the data collected from the year prior to the cohort entry date from the following 6 data di-mensions: 1) drugs dispensed in an outpatient setting, 2) physician claims codes for inpatient and outpatient procedures, 3) physician claims for inpatient and out-patient diagnostic codes, 4) specialty of the physician providing care, 5) hospitalisation discharge data for inpatient procedure codes and 6) hospitalisation dis-charge data for inpatient diagnostic code.
In addition to the 500 variables selected by the default option of the hdPS algorithm [7], we forced the follow-ing covariates within the hdPS model: patients’sex, age and poverty level status (yes versus no) at the cohort entry date, year of entry within the cohort (as a categor-ical variable), medcategor-ical resource utilization variables (≥1 hospitalisation, ≥5 outpatient visits, ≥5 distinct drugs dispensed to the patient, all within the year prior to the cohort entry date). These variables were forced in the model since they could not be selected by the SAS hdPS
algorithm v.1 we were using. Trimming was performed and patients located within non-overlapping regions of the hdPS distribution were excluded from the analysis [28], all other patients were eligible for inclusion within the Matched hdPS Sub-Cohort. Lower potency controls were found for patients in the high potency group using a greedy, nearest neighbor 1:1 matching algorithm. Matching occurred if the difference in the logit of hdPS between nearest neighbors was within a caliper width equal to 0.2 times the SD of the logit of the hdPS [29]. Patients selected by the matching algorithm were in-cluded within theMatched hdPS Sub-Cohort.
Statistical analyses
Absolute standardized differences (ASDD), defined as the absolute between group difference over the pooled SD of the two groups, were used to compare patient characteristics between patients exposed to a high potency versus lower potency statin within the Full Cohort and both sub-cohorts [4, 8–11]. ASDD < 0.1 are generally assumed to indicate good balance be-tween groups [2, 10]. Discrete data are presented in absolute and relative values (n [%]) and continuous data are presented as mean (SD). OR (95%CI) of dia-betes occurrence in the high over lower potency sta-tin groups were estimated within the Full Cohort and within both matched sub-cohorts; no adjustment be-yond matching was performed.
All statistical analyses were conducted with SAS version 9.3 (SAS Institute, Cary, North Carolina).
Results
Characteristics of the patients included within the Full Cohort
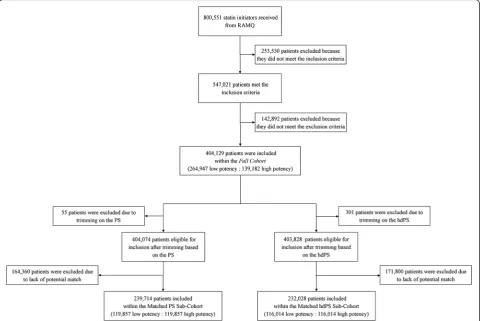
Figure 1 shows the flow chart of patients included within the Full Cohort, the Matched PS Sub-Cohort and the Matched hdPS Sub-Cohort.
Characteristics of patients included within the Matched PS Sub-Cohort
PS were calculated for all 404,129 patients included within the Full Cohort (kernel density PS curves for all patients included within the Full Cohortare provided in Additional file 1). Fifty-five (0.0 %) patients, 33 (0.0 %) lower potency and 22 (0.0 %) high potency, had PS lo-cated within non-overlapping regions and were excluded from the analysis. Among the remaining 404,074 pa-tients, we matched 119,857 patients (29.7 %) initiated on a high potency statin to 119,857 patients (29.7 %) initi-ated on a lower potency statin based on their individual PS; selected patients formed theMatched PS Sub-Cohort (Fig. 1). This sub-cohort was comprised of 119,931 male patients (50.0 %) and the average age was 64.7 years (SD 11.2) (Table 2). Balance was obtained for all 18 examined patient characteristics (ASDD ranged from 0.002 to 0.031 with an average of 0.015).
Characteristics of patients included within the Matched hdPS Sub-Cohort
Three hundred and one (0.1 %) patients, 54 (0.0 %) lower potency and 247 (0.1 %) high potency, had hdPS located within non-overlapping regions and were
excluded from the analysis (kernel density hdPS curves for all patients included within the Full Cohort are provided in Additional file 2). Among the remaining 403,828 patients, we matched 116,014 patients (28.7 %) initiated on a high potency statin to 116,014 patients (28.7 %) initiated on a lower potency statin based on their individual hdPS; selected patients formed the Matched hdPS Sub-Cohort(Fig. 1).
Patients included within the Matched hdPS Sub-Cohort were on average 64.6 years old (SD 11.2) and 116,688 of them were males (50.3 %) (Table 3). Balance was obtained in all 18 examined patient characteristics, whether or not they were forced within the hdPS model (ASDD ranged from 0.001 to 0.023 with an average of 0.008).
Performance of the PS and hdPS in adjusting for confounding by indication
regression model used within the Full Cohort and both matched sub-cohorts. Figure 2 shows the direct compari-son of the ASDD for the examined patient characteristics within the Full Cohort, the Matched PS Sub-Cohort and theMatched hdPS Sub-Cohort. Results indicate that both matched sub-cohorts were more balanced than the un-matched Full Cohort. Although the Matched PS Sub-Cohortprovided greater balance on three of the 18 exam-ined patient characteristics (MI, hypercholesterolemia,
and PVD), overall, the Matched hdPS Sub-Cohort
achieved the most balanced sub-cohort (average ASDD = 0.008 and average ASDD = 0.015 in the Matched hdPS Sub-CohortandMatched PS Sub-Cohort, respectively).
Measures of associations obtained within theFull Cohort and the two matched sub-cohorts indicated that patients in the high potency group had higher odds of developing diabetes within 2-years follow-up. Results obtained within both sub-cohorts overlapped (OR = 1.10 [95 % CI 1.05– 1.15] within the Matched PS Sub-Cohort and OR = 1.13 [95 % CI 1.08–1.19] within theMatched hdPS Sub-Cohort) but both were lower than those obtained within the Full Cohort(OR = 1.22 [95%CI 1.18–1.27]).
Discussion
As expected, overall patient profiles within theFull Cohort showed imbalance on many key baseline characteristics
suggesting the presence of confounding by indication. Such results would tend to indicate the presence of bias within measures of associations estimated within the Full Cohort if appropriate adjustment were not used in the analyses.
In their original paper, Schneeweisset al. [7] assessed the performance of the hdPS method by comparing measures of associations adjusted for patients’ hdPS to the results of a RCT. By showing that the adjusted mea-sures of association were closer to the results of the RCT than the crude measure of association, they showed that hdPS method had improved the adjustment for con-founding by indication within their study. Performance of the hdPS method has been assessed by others using the same approach and their results also supported its use [12–14]. Measures of association obtained within both matched sub-cohorts were closer to the null (OR = 1.10 [95%CI 1.05–1.15] within the Matched PS Sub-Cohort and OR = 1.13 [95%CI 1.08–1.19] within the Matched hdPS Sub-Cohort) than within the Full Cohort (OR = 1.22 [95%CI 1.18–1.27]). However, since the CIs obtained from both methods overlap with each other and are as precise, their performance cannot be differen-tiated based solely on this criterion.
However, performance based on the level of balance achieved within matched sub-cohorts does not require
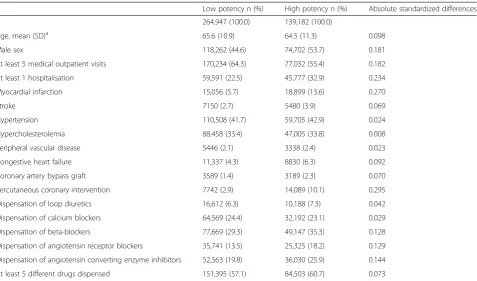
Table 1Demographic characteristics and comorbidity status of theFull Cohortat baseline
Low potency n (%) High potency n (%) Absolute standardized differences
264,947 (100.0) 139,182 (100.0)
Age, mean (SD)a 65.6 (10.9) 64.5 (11.3) 0.098
Male sex 118,262 (44.6) 74,702 (53.7) 0.181
At least 5 medical outpatient visits 170,234 (64.3) 77,032 (55.4) 0.182
At least 1 hospitalisation 59,591 (22.5) 45,777 (32.9) 0.234
Myocardial infarction 15,056 (5.7) 18,899 (13.6) 0.270
Stroke 7150 (2.7) 5480 (3.9) 0.069
Hypertension 110,508 (41.7) 59,705 (42.9) 0.024
Hypercholesterolemia 88,458 (33.4) 47,005 (33.8) 0.008
Peripheral vascular disease 5446 (2.1) 3338 (2.4) 0.023
Congestive heart failure 11,337 (4.3) 8830 (6.3) 0.092
Coronary artery bypass graft 3589 (1.4) 3189 (2.3) 0.070
Percutaneous coronary intervention 7742 (2.9) 14,089 (10.1) 0.295
Dispensation of loop diuretics 16,612 (6.3) 10,188 (7.3) 0.042
Dispensation of calcium blockers 64,569 (24.4) 32,192 (23.1) 0.029
Dispensation of beta-blockers 77,669 (29.3) 49,147 (35.3) 0.128
Dispensation of angiotensin receptor blockers 35,741 (13.5) 25,325 (18.2) 0.129
Dispensation of angiotensin converting enzyme inhibitors 52,563 (19.8) 36,030 (25.9) 0.144
At least 5 different drugs dispensed 151,395 (57.1) 84,503 (60.7) 0.073
Comorbidity status, drug dispensations and medical utilization rates were assessed in the year prior to the cohort entry date. Absolute standardized differences are defined as the between group difference over the pooled standard deviation of the two groups
a
an additional comparator. Based on this second perform-ance criterion, we showed that using both methods cre-ated balanced matched sub-cohorts (i.e. ASDD were < 0.1 for all patient characteristics in both matched sub-cohort). When directly comparing both sub-cohorts, use of the hdPS method was favored since 14 out of the 18 examined patient characteristics were more balanced within the Matched hdPS Sub-Cohort than within the Matched PS Sub-Cohortwhich should tend to lead to less biased mea-sures of association within theMatched hdPS Sub-Cohort. Seeing as the hdPS model adjusted for more variables than the PS model, such a result was to be expected but it needed to be verified in a situation where we have prior knowledge on which confounders to adjust for. The re-sults we show in this study support the idea that the hdPS method may be used to adjust for confounding by indication, but the possibility that residual confounding remaining after this adjustment cannot be ruled out.
Our study has several strengths. First, we compared the PS and hdPS method in a large cohort of incident statin users showing substantial imbalance suggesting the potential for confounding by indication. As such, this provided an excellent situation in which to compare the performance of both methods.
Second, our conclusions favored the hdPS method when our study design should have favored the PS
method. Although all of the examined covariates were forced within the PS model, only five investigator-selected covariates were forced within the hdPS model (only demographic, socio-economic and medical re-source utilization variables were forced within the hdPS model, all remaining covariates were selected by the hdPS algorithm [n = 500]) [7]. Therefore, the hdPS method performance was mainly achieved through the use of the automated hdPS algorithm and not by investi-gator choice.
Our study has also several limitations.First, we com-pared patients on a relatively small number of baseline patient characteristics. It is possible that the perform-ance observed within the 18 prespecified patient char-acteristics may not be representative of the overall performance regarding all potential patient characteris-tics. However, these variables were selected because we believed, like others have [18], that they could lead to confounding by indication and our results show that the hdPS method achieved substantial balance within all of these even though most were not forced within the hdPS model.
Second, we defined unbalance as ASDD > 0.1. Al-though this cut-off is frequently used [2, 10, 16], other values could have been used as well. Regardless of the cut-off value chosen, our results indicate that the hdPS
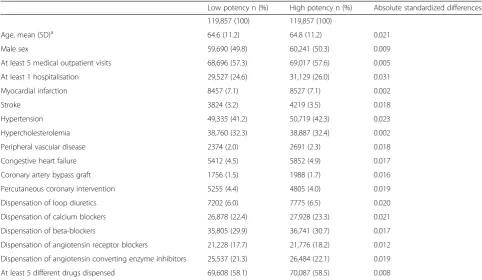
Table 2Demographic characteristics and comorbidity status of theMatched PS Sub-Cohortat baseline
Low potency n (%) High potency n (%) Absolute standardized differences
119,857 (100) 119,857 (100)
Age, mean (SD)a 64.6 (11.2) 64.8 (11.2) 0.021
Male sex 59,690 (49.8) 60,241 (50.3) 0.009
At least 5 medical outpatient visits 68,696 (57.3) 69,017 (57.6) 0.005
At least 1 hospitalisation 29,527 (24.6) 31,129 (26.0) 0.031
Myocardial infarction 8457 (7.1) 8527 (7.1) 0.002
Stroke 3824 (3.2) 4219 (3.5) 0.018
Hypertension 49,335 (41.2) 50,719 (42.3) 0.023
Hypercholesterolemia 38,760 (32.3) 38,887 (32.4) 0.002
Peripheral vascular disease 2374 (2.0) 2691 (2.3) 0.018
Congestive heart failure 5412 (4.5) 5852 (4.9) 0.017
Coronary artery bypass graft 1756 (1.5) 1988 (1.7) 0.016
Percutaneous coronary intervention 5255 (4.4) 4805 (4.0) 0.019
Dispensation of loop diuretics 7202 (6.0) 7775 (6.5) 0.020
Dispensation of calcium blockers 26,878 (22.4) 27,928 (23.3) 0.021
Dispensation of beta-blockers 35,805 (29.9) 36,741 (30.7) 0.017
Dispensation of angiotensin receptor blockers 21,228 (17.7) 21,776 (18.2) 0.012
Dispensation of angiotensin converting enzyme inhibitors 25,537 (21.3) 26,484 (22.1) 0.019
At least 5 different drugs dispensed 69,608 (58.1) 70,087 (58.5) 0.008
Comorbidity status, drug dispensations and medical utilization rates were assessed in the year prior to the cohort entry date. Absolute standardized differences are defined as the between group difference over the pooled standard deviation of the two groups
a
method outperformed the PS method in achieving the most balanced sub-cohort. Although this added level of balance may not eliminate all biases within the observa-tional study (i.e. information bias, unmeasured con-founders, time-varying confounding), it will at least tend to reduce the level of bias caused by these baseline characteristics.
Third, no mechanism of action by which statins could cause diabetes has been identified. Although we com-pared both methods using a frequently used exposure definition, we cannot claim that this exposure definition reflects the true mechanism of action by which statins could cause diabetes. It is possible that the results ob-tained, had we used an exposure definition reflecting the true mechanism of action, could have differed from those obtained within this study. This also reflects the fact that we do not know what the true measure of asso-ciation between the exposure to statins and diabetes is. As mentioned, traditionally the hdPS method has been validated by comparing the crude and hdPS-adjusted measures of association to a gold standard measure but in this case, such a true gold standard is not available. We recognize that this would not have been the case had we conducted this comparison within an ordinary simulation study in which the truth would be defined by the investigators. However, as others have highlighted,
[7, 30] the hdPS method cannot be evaluated through the use of ordinary simulation studies since its perform-ance depends on the complexity and quantity of data available to the hdPS algorithm, levels of which cannot be reproduced within a fully artificial setting. In order to circumvent this issue, Franklin et al. [30] recently pro-posed that performance of the hdPS method compared to the performance of the PS method be compared using plasmode simulation studies. Using this framework, Franklin et al. showed that an investigator-independent hdPS method performed nearly as well as a fully speci-fied PS model further supporting the use of the hdPS method in situations where little prior knowledge re-garding potential confounding variables is available [30]. Such an approach may be validated in future work aimed at further evaluating the performance of the hdPS method.
Fourth,our results show that hdPS trimming removed slightly more patients than PS trimming (301 vs 55). Al-though this could impact our conclusion regarding the value of both methods, its impact should be marginal since the total number of patients that were trimmed in both settings remains trivial in comparison to the total sample size of theFull Cohort.
Finally, we only examined the relative performance of the PS and hdPS methods within a single context; the
Table 3Demographic characteristics and comorbidity status of theMatched hdPS Sub-Cohortat baseline
Low potency n (%) High potency n (%) Absolute standardized differences
116,014 (100.0) 116,014 (100.0)
Age, mean (SD)a 64.6 (11.2) 64.6 (11.2) 0.002
Male sex 58,194 (50.2) 58,494 (50.4) 0.005
At least 5 medical outpatient visits 66,453 (57.3) 66,390 (57.2) 0.001
At least 1 hospitalisation 28,265 (24.4) 28,604 (24.7) 0.007
Myocardial infarction 7558 (6.5) 7995 (6.9) 0.015
Stroke 3620 (3.1) 3897 (3.4) 0.013
Hypertension 48,268 (41.6) 48,474 (41.8) 0.004
Hypercholesterolemia 37,486 (32.3) 37,841 (32.6) 0.007
Peripheral vascular disease 2293 (2.0) 2671 (2.3) 0.023
Congestive heart failure 5198 (4.5) 5479 (4.7) 0.012
Coronary artery bypass graft 1670 (1.4) 1661 (1.4) 0.001
Percutaneous coronary intervention 4590 (4.0) 4846 (4.2) 0.011
Dispensation of loop diuretics 7139 (6.2) 7256 (6.3) 0.004
Dispensation of calcium blockers 26,510 (22.9) 26,716 (23.0) 0.004
Dispensation of beta-blockers 33,901 (29.2) 34,389 (29.6) 0.009
Dispensation of angiotensin receptor blockers 20,345 (17.5) 20,876 (18.0) 0.012
Dispensation of angiotensin converting enzyme inhibitors 24,472 (21.1) 25,289 (21.8) 0.017
At least 5 different drugs dispensed 66,600 (57.4) 66,820 (57.6) 0.004
Comorbidity status, drug dispensations and medical utilization rates were assessed in the year prior to the cohort entry date. Absolute standardized differences are defined as the between group difference over the pooled standard deviation of the two groups
a
results obtained within this study may not be generalizable to other studies focusing on other exposure-disease asso-ciations. Furthermore, we only compared the traditional PS method estimated using a logistic regression model to hdPS method, while other methods are also available (e.g., classification and regression trees and boosting methods) [31, 32]. Future work will be needed to com-pare the relative performance of all these different methods.
Conclusions
In conclusion, we recommend comparing the PS and hdPS methods by means of their relative ability to select balanced sub-cohorts over their adjustment potential within ethiological studies. Although both methods ad-equately adjusted for confounding by indication, we cannot rule out the possibility that the hdPS method will be dominant in other contexts since it has the
potential to identify confounders which are unknown to the investigators.
Ethics approval and consent to participate
Access to data was granted by theCommission d’accès à l’information and the protocol was approved by the Centre hospitalier de l’Université de Montréal ethics’ committee.
Consent for publication Not applicable
Additional files
Additional file 1:Kernel density curves of the PS distribution within theFull Cohort.(TIF 261 kb)
Additional file 2:Kernel density curves of the hdPS distribution within theFull Cohort.(TIF 460 kb)
Fig. 2Comparison of the level of balance achieved using the absolute standardized differences obtained within theFull Cohort, theMatched PS
Sub-Cohortand theMatched hdPS Sub-Cohortthe examined patient characteristics. ACEI, Angiotensin converting enzyme inhibitors; ARB,
Abbreviations
ASDD:absolute standardized differences; CI: confidence interval; hdPS: high-dimensional propensity score; MED-ECHO: Maintenance et Exploitation des Données pour l’Étude de la Clientèle Hospitalière; MI: myocardial infarction; OR: odds ratio; PCI: percutaneous coronary intervention; PS: propensity score; PVD: peripheral vascular disease; RAMQ: Régie de l’assurance maladie du Québec; RCT: randomized controlled trials; SD: standard deviation.
Competing interests
JRG has received a CIHR Frederick Banting and Charles Best Doctoral Award in work related to this paper. JRG has also received a Pfizer Canada Inc. Post-Doctoral Mentoree Award and the 2015-2016 Bernie O’Brien Post-Doctoral Fellowship Award for work unrelated to this paper. ER has received funds and consultancy fees from Janssen Inc. and from Pfizer Canada Inc. not related to this paper. JL has received funds and consultancy fees from Astra-Zeneca, Glaxo-Smith-Kline, Janssen Inc., Merck Canada, Novartis, Pfizer Canada Inc., and from Sanofi-Avantis not related to this paper. CRD had no conflicts of interest to disclose.
Authors’contributions
JRG contributed to the conception, design, analysis and interpretation of the data, drafted the first draft of the manuscript and agreed to be accountable for the all aspects of the work presented. ER contributed to the conception, design, analysis and interpretation of the data, critically revised the manuscript for important intellectual content and agreed to be accountable for all aspects of the work presented. CD contributed to the design, analysis and interpretation of the data, critically revised the manuscript for important intellectual content and agreed to be accountable for all aspects of the work presented. JLL contributed to the conception, design, acquisition, analysis and interpretation of the data, critically revised the manuscript for important intellectual content and agreed to be accountable for all aspects of the work presented. All authors read and approved the final manuscript.
Funding
This study was financially supported in part by the Canadian Network for Observational Drug Effect Studies (CNODES), a collaborating centre of the Drug Safety and Effectiveness Network (DSEN) that is funded by the Canadian Institutes of Health Research (Grant Number DSE-111845). This study was made possible through data sharing agreements between CNODES and the provincial government of Quebec. The opinions, results, and conclusions reported in this paper are those of the authors. No endorsement by the province is intended or should be inferred. We would like to also thank the CNODES investigators and collaborators for their contribution in developing the study protocol evaluated in this paper.
Author details
1Department of Clinical Epidemiology and Biostatistics, McMaster University, Hamilton, ON, Canada.2Programs for Assessment of Technology in Health, St. Joseph’s Healthcare Hamilton, Hamilton, QC, Canada.3Research Institute of the McGill University Health Centre, Montreal, QC, Canada.4Department of Medicine, McGill University, Montreal, QC, Canada.5Department of Anesthesiology, Pharmacology & Therapeutics, University of British Columbia, Vancouver, BC, Canada.6Pharmacoeconomic and Pharmacoepidemiology unit, Research Center of the Centre hospitalier de l’Université de Montréal, Pavillon S, 850 St-Denis, 3e étage, Montreal, QC, Canada.
Received: 20 November 2015 Accepted: 2 February 2016
References
1. Groenwold RH, Hak E, Hoes AW. Quantitative assessment of unobserved confounding is mandatory in nonrandomized intervention studies. J Clin Epidemiol. 2009;62(1):22–8.
2. Austin PC. An introduction to propensity score methods for reducing the effects of confounding in observational studies. Multivar Behav Res. 2011; 46(3):399–424.
3. Shrank WH, Patrick AR, Brookhart MA. Healthy user and related biases in observational studies of preventive interventions: a primer for physicians. J Gen Intern Med. 2011;26(5):546–50.
4. Austin PC. The relative ability of different propensity score methods to balance measured covariates between treated and untreated subjects in observational studies. Med Decis Making. 2009;29(6):661–77.
5. Rosenbaum PR, Rubin DB. The central role of the propensity score in observational studies for causal effects. Biometrika. 1983;70(1):41–55. 6. Black CM, Tadrous M, Cadarette SM. Diffusion of methodological innovation in
pharmacoepidemiology: high-dimensional propensity score co-authorship network analysis. CAPT; Toronto: J Popul Ther Clin Pharmacol. 2013;21(1):e138. 7. Schneeweiss S, Rassen JA, Glynn RJ, Avorn J, Mogun H, Brookhart MA.
High-dimensional propensity score adjustment in studies of treatment effects using health care claims data. Epidemiology. 2009;20(4):512–22. 8. Belitser SV, Martens EP, Pestman WR, Groenwold RHH, de Boer A, Klungel
OH. Measuring balance and model selection in propensity score methods. Pharmacoepidemiol Drug Saf. 2011;20(11):1115–29.
9. Austin PC. Balance diagnostics for comparing the distribution of baseline covariates between treatment groups in propensity-score matched samples. Stat Med. 2009;28(25):3083–107.
10. Mamdani M, Sykora K, Li P, Normand SL, Streiner DL, Austin PC, et al. Reader’s guide to critical appraisal of cohort studies: 2. Assessing potential for confounding. BMJ. 2005;330(7497):960–2.
11. Ali MS, Groenwold RHH, Pestman WR, Belitser SV, Roes KCB, Hoes AW, et al. Propensity score balance measures in pharmacoepidemiology: a simulation study. Pharmacoepidemiol Drug Saf. 2014;23(8):802–11.
12. Garbe E, Kloss S, Suling M, Pigeot I, Schneeweiss S. High-dimensional versus conventional propensity scores in a comparative effectiveness study of coxibs and reduced upper gastrointestinal complications. Eur J Clin Pharmacol. 2012;69:549–57.
13. Polinski JM, Schneeweiss S, Glynn RJ, Lii J, Rassen JA. Confronting
“confounding by health system use”in Medicare Part D: comparative effectiveness of propensity score approaches to confounding adjustment. Pharmacoepidemiol Drug Saf. 2012;21:90–8.
14. Rassen JA, Glynn RJ, Brookhart MA, Schneeweiss S. Covariate selection in high-dimensional propensity score analyses of treatment effects in small samples. Am J Epidemiol. 2011;173(12):1404–13.
15. Preiss D, Seshasai SR, Welsh P, Murphy SA, Ho JE, Waters DD, et al. Risk of incident diabetes with intensive-dose compared with moderate-dose statin therapy: a meta-analysis. JAMA. 2011;305(24):2556–64.
16. Ko DT, Wijeysundera HC, Jackevicius CA, Yousef A, Wang J, Tu JV. Diabetes and cardiovascular events in older myocardial infarction patients prescribed intensive-dose and moderate-dose statins. Circ Cardiovasc Qual Outcomes. 2013;6:315–22.
17. Carter AA, Gomes T, Camacho X, Juurlink DN, Shah BR, Mamdani MM. Risk of incident diabetes among patients treated with statins: population based study. BMJ. 2013;346:f2610.
18. Dormuth CR, Filion KB, Paterson JM, James MT, Teare GF, Raymond CB, et al. Higher potency statins and the risk of new diabetes: multicentre, observational study of administrative databases. BMJ. 2014;348:g3244. 19. Wang K-L, Liu C-J, Chao T-F, Huang C-M, Wu C-H, Chen S-J, et al. Statins, risk
of diabetes, and implications on outcomes in the general population. J Am Coll Cardiol. 2012;60(14):1231–8.
20. Zaharan NL, Williams D, Bennett K. Statins and risk of treated incident diabetes in a primary care population. Br J Clin Pharmacol. 2013;75(4):1118–24. 21. Soucy A. Québec Handy Numbers, 2015 Edition. Québec: Institut de la
statistique du Québec; 2015.
22. Blais C, Lambert L, Hamel D, Brown K, Rinfret S, Cartier R, et al. Évaluation des soins et surveillance des maladies cardiovasculaires: Pouvons-nous faire confiance aux données médico-administratives hospitalières ? Montreal: Institut national d’excellence en santé et en services sociaux (INESSS); 2012. 23. Lambert L, Blais C, Hamel D, Brown K, Rinfret S, Cartier R, et al. Evaluation of
care and surveillance of cardiovascular disease: can we trust medico-administrative hospital data? Can J Cardiol. 2012;28(2):162–8.
24. Tamblyn R, Lavoie G, Petrella L, Monette J. The use of prescription claims databases in pharmacoepidemiological research: the accuracy and comprehensiveness of the prescription claims database in Quebec. J Clin Epidemiol. 1995;48(8):999–1009.
25. Tamblyn R, Reid T, Mayo N, McLeod P, Churchill-Smith M. Using medical services claims to assess injuries in the elderly: sensitivity of diagnostic and procedure codes for injury ascertainment. J Clin Epidemiol. 2000;53(2):183–94. 26. World Health Organisation Collaborating Centre for Drug Statistics
27. Law MR, Wald NJ, Rudnicka AR. Quantifying effect of statins on low density lipoprotein cholesterol, ischaemic heart disease, and stroke: systematic review and meta-analysis. BMJ. 2003;326(7404):1423.
28. Sturmer T, Rothman KJ, Avorn J, Glynn RJ. Treatment effects in the presence of unmeasured confounding: dealing with observations in the tails of the propensity score distribution–a simulation study. Am J Epidemiol. 2010; 172(7):843–54.
29. Austin PC. Optimal caliper widths for propensity-score matching when estimating differences in means and differences in proportions in observational studies. Pharm Stat. 2011;10(2):150–61.
30. Franklin JM, Schneeweiss S, Polinski JM, Rassen JA. Plasmode simulation for the evaluation of pharmacoepidemiologic methods in complex healthcare databases. Comput Stat Data Anal. 2014;72:219–26.
31. Westreich D, Lessler J, Funk MJ. Propensity score estimation: neural networks, support vector machines, decision trees (CART), and meta-classifiers as alternatives to logistic regression. J Clin Epidemiol. 2010;63(8):826–33. 32. Lee BK, Lessler J, Stuart EA. Improving propensity score weighting using
machine learning. Stat Med. 2010;29(3):337–46.
• We accept pre-submission inquiries
• Our selector tool helps you to find the most relevant journal
• We provide round the clock customer support
• Convenient online submission
• Thorough peer review
• Inclusion in PubMed and all major indexing services
• Maximum visibility for your research
Submit your manuscript at www.biomedcentral.com/submit